
Silver Price Forecasts: XAG/USD returns above $77 as the US Dollar tumbles
Oleh Guillermo Alcala
Dikemas kini: 8 Apr 2026


ARTIKEL POPULAR

Silver rallies on risk-on markets and reaches session highs above $77.00.
Silver rallies on risk-on markets and reaches session highs above $77.00.
The safe-haven US Dollar tumbled on news of a ceasefire in Iran.
XAG/USD’s bulls are targeting the area around the $80.00 psychological level.
Silver (XAG/USD) accelerated its recovery on Wednesday, as investors unwound their US Dollar longs amid a higher appetite for risk following the announcement of a two-week ceasefire in Iran. The precious metal rallies more than 6% on the day so far, reaching levels above $77.00, from lows at $68.28 on Tuesday.
Markets are celebrating a last-minute agreement between the US and Iran to cease the hostilities for the next two weeks and allow safe passage of Oil, Gas, fertilisers, and other goods through the Strait of Hormuz. US President Trump has claimed “total victory,” and Tehran said that conversations for a steady peace deal will start soon. A relief rally sent Oil and the Greenback tumbling, while precious metals are appreciating alongside risk-sensitive assets
Technical Analysis: Silver bulls eye the $80.00 area
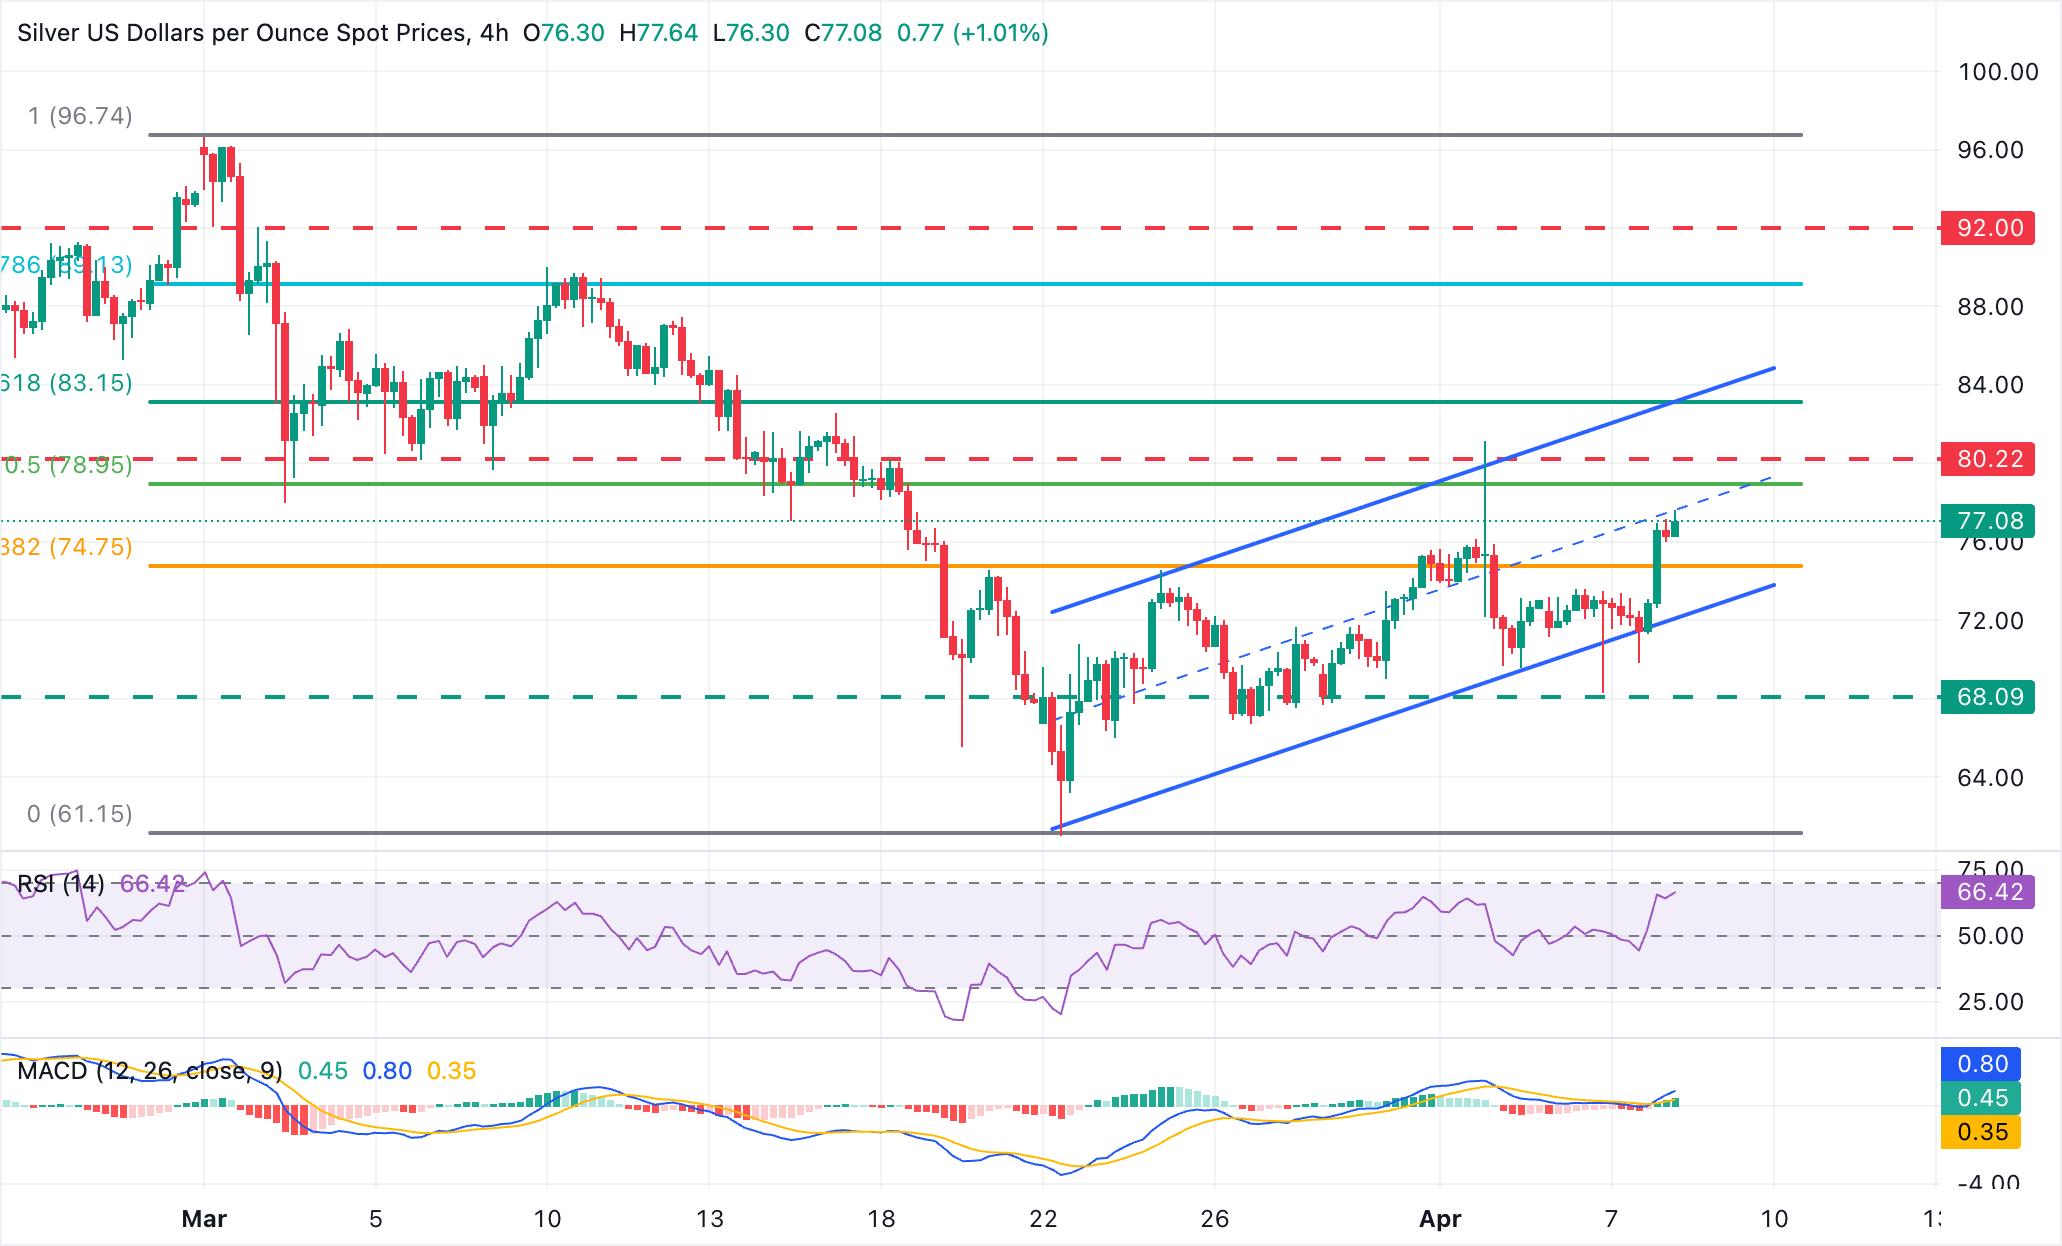
XAG/USD trades right above $77.40 amid a bullish near-term bias, with price action holding within an ascending channel from lows around $61 in late March.
Technical indicators in 4-hour charts support the bullish view. The Relative Strength Index (RSI) is rising toward 68, while the Moving Average Convergence Divergence (MACD) line has turned higher into positive territory, suggesting that buyers retain control.
Bulls are likely to find resistance in the area between the 50% Fibonacci retracement of the early March sell-off, at $78.90, and a previous support, turned resistance in the $80.00 area. Further up, the channel top meets the 61.8% Fibonacci retracement at $83.20.
On the downside, the previous resistance area around the 38.2% Fibonacci retracement, in the $75.00 area, is likely to provide support ahead of the channel floor around $72.60, and Tuesday's low near $68.00.
(The technical analysis of this story was written with the help of an AI tool.)
Silver FAQs
Silver is a precious metal highly traded among investors. It has been historically used as a store of value and a medium of exchange. Although less popular than Gold, traders may turn to Silver to diversify their investment portfolio, for its intrinsic value or as a potential hedge during high-inflation periods. Investors can buy physical Silver, in coins or in bars, or trade it through vehicles such as Exchange Traded Funds, which track its price on international markets.
Silver prices can move due to a wide range of factors. Geopolitical instability or fears of a deep recession can make Silver price escalate due to its safe-haven status, although to a lesser extent than Gold's. As a yieldless asset, Silver tends to rise with lower interest rates. Its moves also depend on how the US Dollar (USD) behaves as the asset is priced in dollars (XAG/USD). A strong Dollar tends to keep the price of Silver at bay, whereas a weaker Dollar is likely to propel prices up. Other factors such as investment demand, mining supply – Silver is much more abundant than Gold – and recycling rates can also affect prices.
Silver is widely used in industry, particularly in sectors such as electronics or solar energy, as it has one of the highest electric conductivity of all metals – more than Copper and Gold. A surge in demand can increase prices, while a decline tends to lower them. Dynamics in the US, Chinese and Indian economies can also contribute to price swings: for the US and particularly China, their big industrial sectors use Silver in various processes; in India, consumers’ demand for the precious metal for jewellery also plays a key role in setting prices.
Silver prices tend to follow Gold's moves. When Gold prices rise, Silver typically follows suit, as their status as safe-haven assets is similar. The Gold/Silver ratio, which shows the number of ounces of Silver needed to equal the value of one ounce of Gold, may help to determine the relative valuation between both metals. Some investors may consider a high ratio as an indicator that Silver is undervalued, or Gold is overvalued. On the contrary, a low ratio might suggest that Gold is undervalued relative to Silver.

Lebih sejuta pengguna bergantung pada FXStreet untuk data pasaran masa nyata, alat carta, pandangan pakar dan berita Forex. Kalendar ekonomi yang komprehensif dan webinar pendidikan mereka membantu pedagang kekal bermaklumat dan membuat keputusan yang dikira. FXStreet disokong oleh pasukan kira-kira 60 profesional di ibu pejabat Barcelona dan pelbagai wilayah global.
Baca Lagi


