
Stellar Price Forecast: XLM risks deeper losses as derivatives metrics turn negative
Oleh Manish Chhetri
Tarikh Diterbitkan: 3 Mar 2026 | Tarikh Diubah: 3 Mar 2026


ARTIKEL POPULAR

Stellar (XLM) is trading red below $0.16 at the time of writing on Tuesday, after a slight recovery the previous day. Weakening derivatives data caps the recovery, while an unfavorable technical outlook projects a deeper correction for the XLM token in the upcoming days.
- Stellar price trades in red on Tuesday after a slight recovery on the previous day.
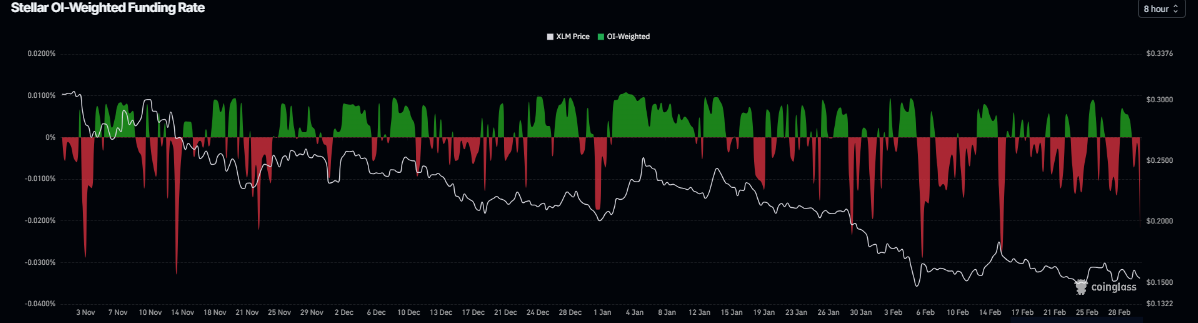
- Derivatives data caps the recovery, with XLM’s funding rates negative, short positions rising and falling open interest, signaling bearish sentiment.
- The broader technical structure remains under pressure, keeping the overall outlook tilted to the downside.
Stellar (XLM) is trading red below $0.16 at the time of writing on Tuesday, after a slight recovery the previous day. Weakening derivatives data caps the recovery, while an unfavorable technical outlook projects a deeper correction for the XLM token in the upcoming days.
Derivatives data shows bearish sentiment
Stellar’s derivatives metrics support a bearish bias. CoinGlass funding rate metric flipped to a negative rate on Monday and stands at -0.021% on Tuesday, nearing levels seen during the mid-February market dip. These negative rates indicate shorts are paying longs, suggesting bearish sentiment toward XLM.
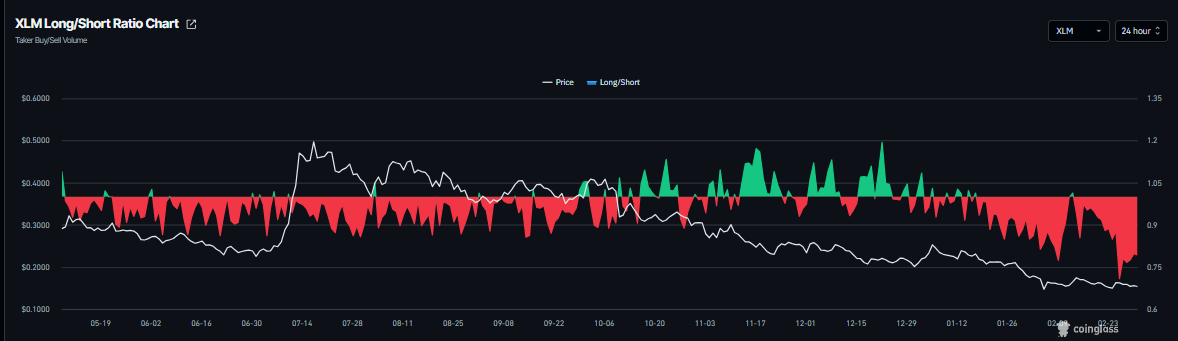
In addition, XLM’s long-to-short ratio stands at 0.79 on Tuesday, nearing its lowest level in over a month. This ratio below 1 indicates bearish sentiment as traders are betting on the Stellar price to fall.
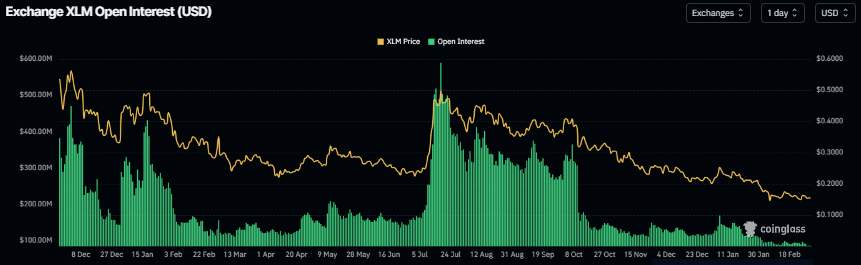
Stellar’s futures Open Interest (OI) falls to $84.87 million on Tuesday, having been steadily declining since early January and reaching levels not seen since mid-November 2024. This drop in OI reflects waning investor participation and projects a bearish outlook.
Stellar Price Forecast: XLM’s broader structure remains bearish
Stellar is trading at $0.15 as of writing on Tuesday. The near-term bias remains bearish, with price entrenched well below the 50-day and 100-day Exponential Moving Averages (EMAs), which continue to slope lower, underscoring a dominant downtrend.
The recent break back under the descending trend-line break area near $0.17 signals that sellers still control rebounds rather than a completed reversal. Momentum metrics echo this tone, as the Relative Strength Index (RSI) on the daily chart slips back toward the low-40s from mid-range readings while the Moving Average Convergence Divergence (MACD) indicator holds above the zero line but with a softening positive histogram, suggesting fading upside pressure within a broader bearish structure.
Immediate resistance aligns at $0.16, where recent highs converge with the broken trend-line region, followed by stronger resistance at the 23.6% Fibonacci retracement of the $0.13–$0.25 slide at $0.16 and then the 38.2% retracement at $0.18, which also sits near the last reaction peak.
On the downside, initial support emerges around $0.15, with a break exposing the prior swing low near $0.14 and then the Fibonacci origin zone toward $0.14–$0.13. As long as XLM remains capped below $0.16–$0.18, rallies would face supply, and the risk of a retest of the lower supports stays elevated.
(The technical analysis of this story was written with the help of an AI tool.)

Lebih sejuta pengguna bergantung pada FXStreet untuk data pasaran masa nyata, alat carta, pandangan pakar dan berita Forex. Kalendar ekonomi yang komprehensif dan webinar pendidikan mereka membantu pedagang kekal bermaklumat dan membuat keputusan yang dikira. FXStreet disokong oleh pasukan kira-kira 60 profesional di ibu pejabat Barcelona dan pelbagai wilayah global.
Baca Lagi


