
Top 3 Price Prediction: Bitcoin, Ethereum, Ripple – BTC and ETH challenge resistance, XRP shows strength
Oleh Manish Chhetri
Dikemas kini: 6 May 2026


ARTIKEL POPULAR

Bitcoin (BTC), Ethereum (ETH), and Ripple (XRP) extend gains on Wednesday, rising over 3.4%, 2%, and 2%, respectively, so far this week. BTC and ETH are approaching their key resistance zones that could determine their next directional move.
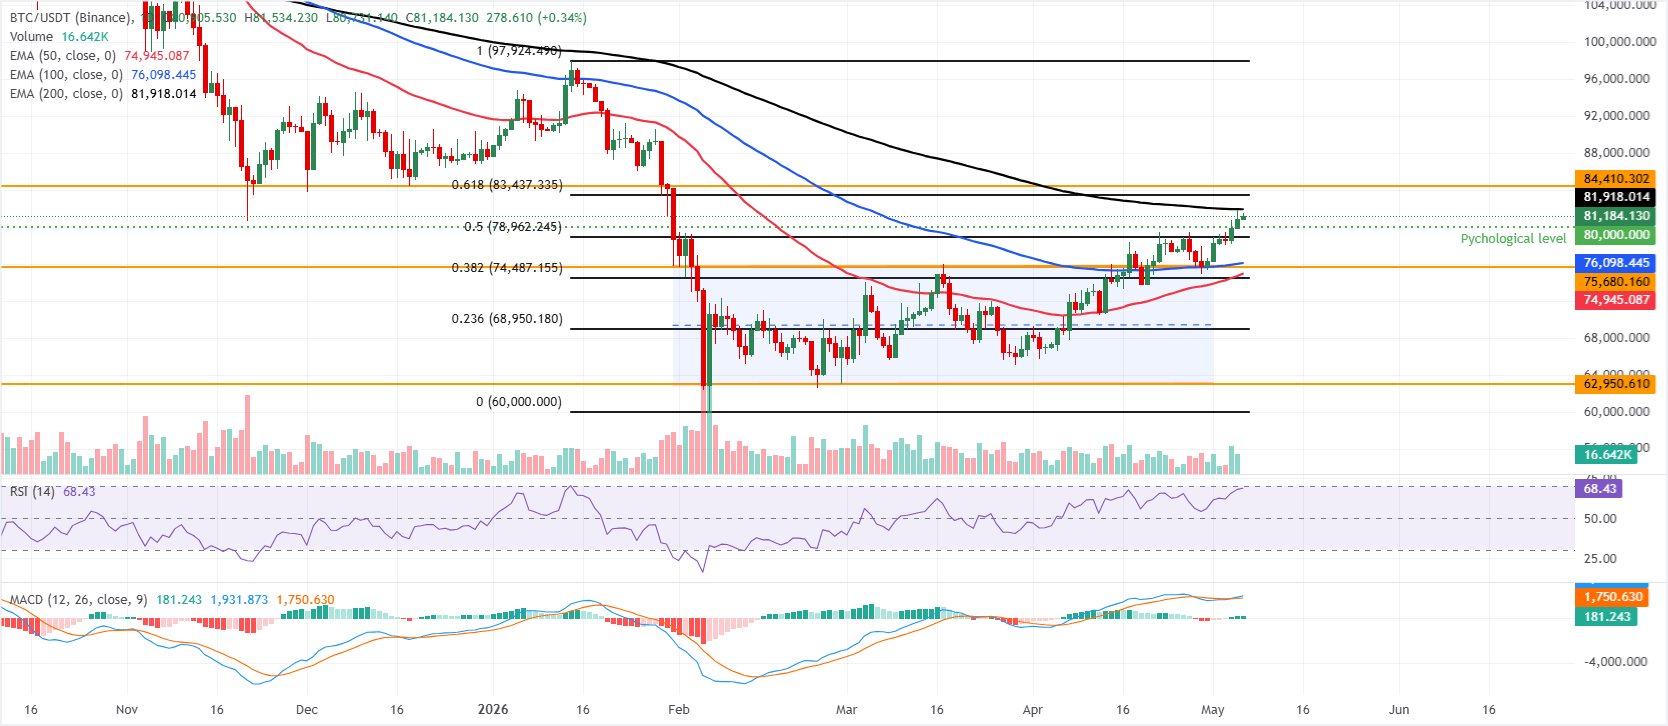
- Bitcoin nears the key 200-day EMA at $81,919 on Wednesday, up over 3.4% so far this week.
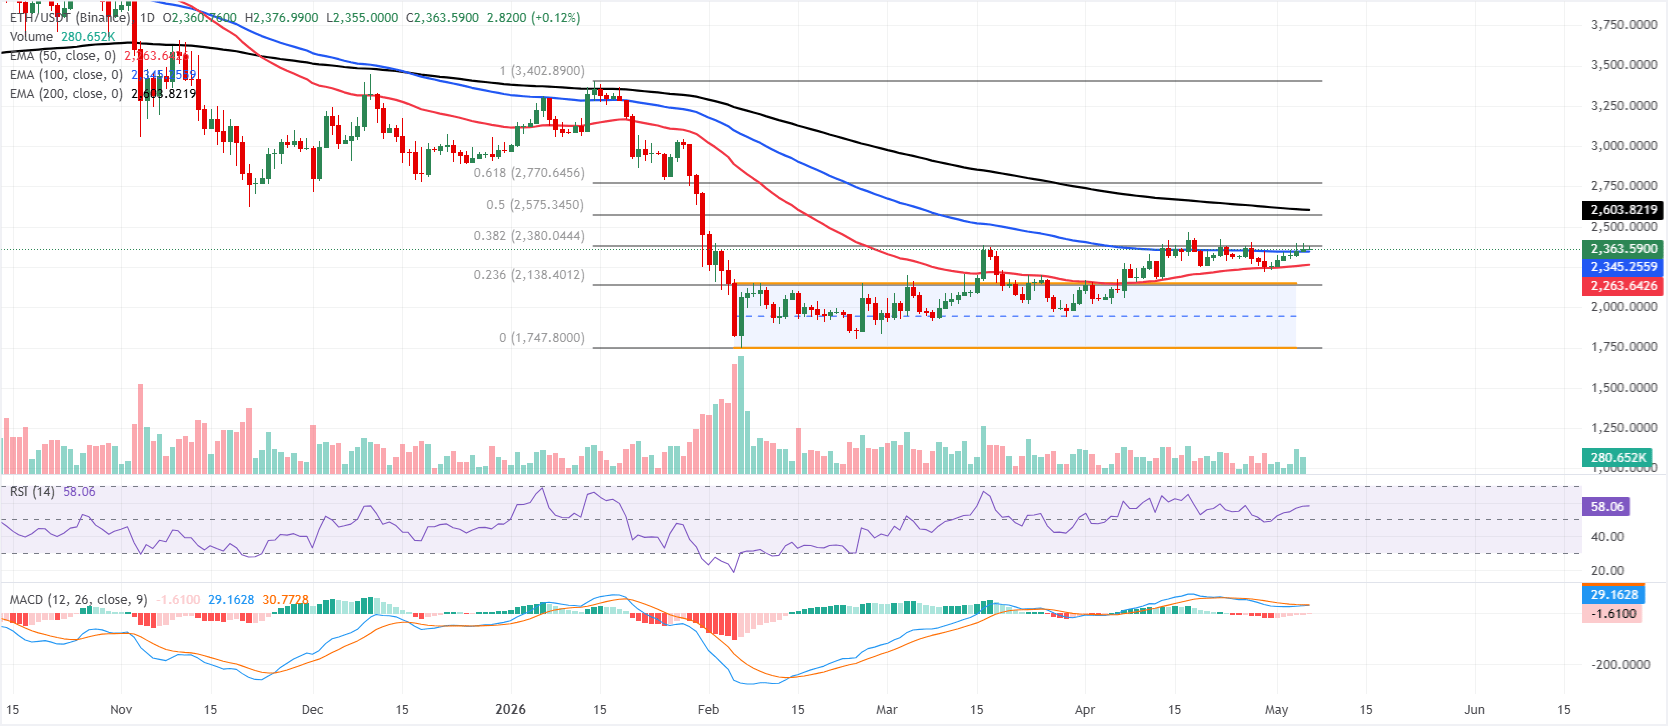
- Ethereum approaches the key 38.2% Fibonacci retracement at $2,380, a firm close above suggests further gains.
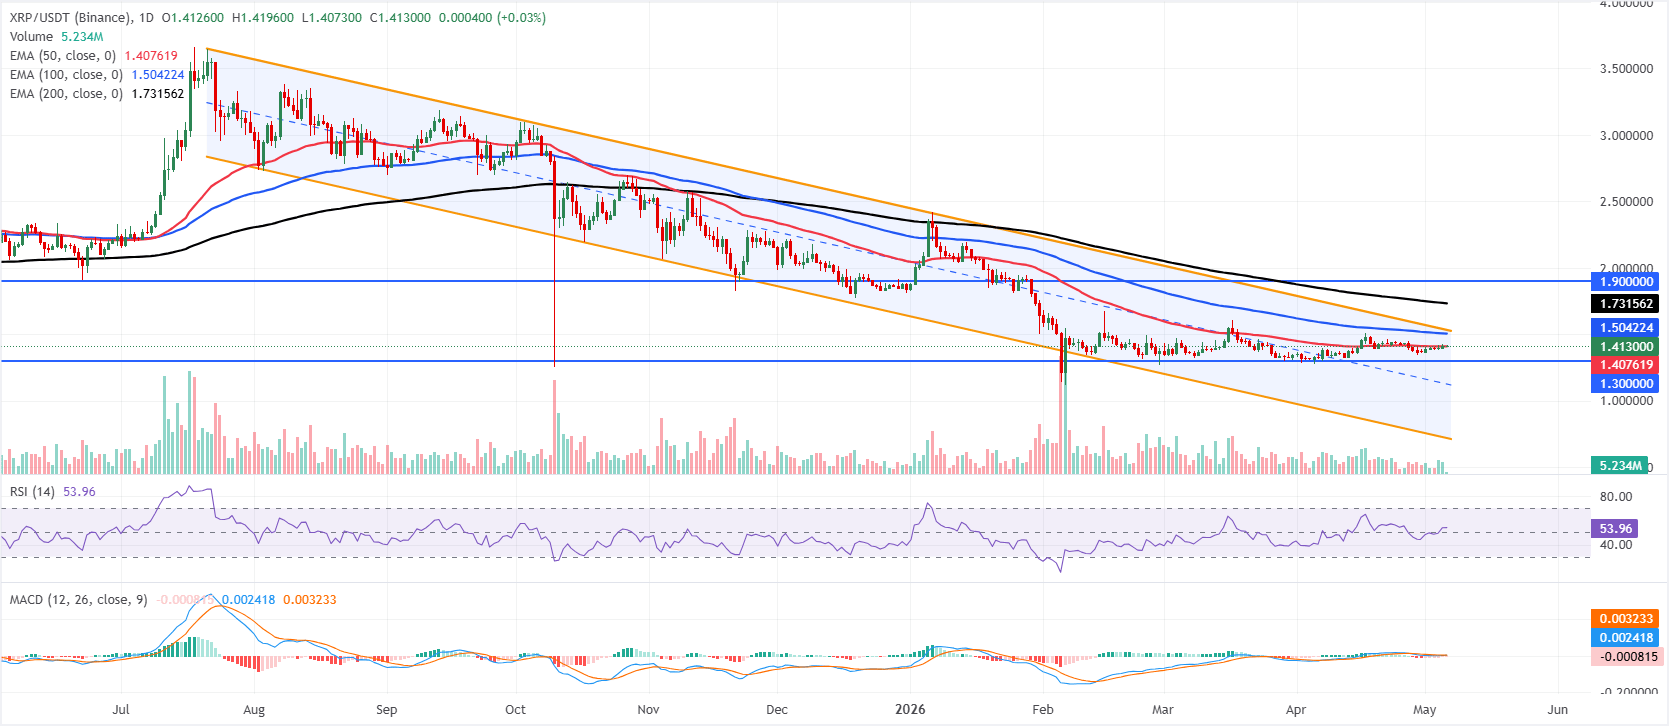
- XRP closes above the key 50-day EMA at $1.40, signaling a potential upside move.
Bitcoin (BTC), Ethereum (ETH), and Ripple (XRP) extend gains on Wednesday, rising over 3.4%, 2%, and 2%, respectively, so far this week. BTC and ETH are approaching their key resistance zones that could determine their next directional move. Meanwhile, XRP holds firmly above a crucial resistance level, signaling a potential for further upside.
Bitcoin near 200-day EMA
Bitcoin price is trading at $81,184, maintaining a constructive bullish bias as it holds well above the 50-day and 100-day Exponential Moving Averages (EMAs) at $74,945 and $76,098, respectively. The Crypto King has also reclaimed the 50% retracement at $78,962, while momentum stays strong with the Relative Strength Index (RSI) near 68 and the Moving Average Convergence Divergence (MACD) line in positive territory, hinting that buyers still control the near-term trend even as the advance approaches overhead supply.
On the topside, initial resistance emerges at the 200-day EMA near $81,918, with the 61.8% Fibonacci retracement at $83,437 next, ahead of a more substantial horizontal barrier around $84,410.
On the downside, immediate support is seen at the psychological $80,000 level, followed by the reclaimed 50% retracement at $78,962; below that, the 100-day EMA at $76,098 and, the upper boundary of the channel near $75,680 and the 50-day EMA at $74,945, are expected to attract dip buyers if a deeper pullback unfolds.
Ethereum could extend gains if it closes above $2,380
Ethereum price trades at $2,363 on Wednesday, maintaining a constructive near-term bias as it holds above the 50-day and 100-day EMAs, which are clustered around $2,263 and $2,345, respectively, and now underpin the advance.
The RSI at 58 leans bullish without entering overbought territory, while the MACD remains slightly negative but continues to recover, hinting that downside momentum is fading as spot stabilizes within the broader rising channel.
On the topside, immediate resistance aligns with the 38.2% Fibonacci retracement of the ($1,747–$3,402 leg) at roughly $2,380, with further barriers emerging at the 50% retracement near $2,575 and the 200-day EMA around $2,603 before the 61.8% retracement at $2,770.
On the downside, initial support is provided by the 100-day EMA at $2,345, followed by the 50-day EMA at $2,263; a deeper pullback would expose the prior channel top near $2,148 and then the 23.6% retracement at $2,138, while the channel floor around $1,747 marks a more distant structural base.
XRP closes above key resistance
XRP price is trading at $1.41 on Wednesday and holds just above the 50-day EMA at $1.40, which offers initial trend support, but it remains well below the 100-day and 200-day EMAs at $1.50 and $1.73, respectively, keeping the broader bias bearish within the prevailing downward channel.
The RSI near 54 hints at mildly positive momentum, yet the MACD line, hovering slightly below zero, suggests upside attempts remain vulnerable while price trades below these higher moving averages.
On the topside, immediate resistance is located at the 100-day EMA around $1.50, followed by the upper boundary of the descending channel near $1.53; a daily close above this cluster would be needed to ease the current downside pressure, with the 200-day EMA at $1.73 and the horizontal barrier at $1.90 marking higher medium-term caps.
On the downside, the 50-day EMA at $1.40 underpins the market just below spot, with a break exposing horizontal support at $1.30; failure there would open room toward the channel floor at $0.71, where stronger demand could emerge.
(The technical analysis of this story was written with the help of an AI tool.)
Cryptocurrency prices FAQs
Token launches influence demand and adoption among market participants. Listings on crypto exchanges deepen the liquidity for an asset and add new participants to an asset’s network. This is typically bullish for a digital asset.
A hack is an event in which an attacker captures a large volume of the asset from a DeFi bridge or hot wallet of an exchange or any other crypto platform via exploits, bugs or other methods. The exploiter then transfers these tokens out of the exchange platforms to ultimately sell or swap the assets for other cryptocurrencies or stablecoins. Such events often involve an en masse panic triggering a sell-off in the affected assets.
Macroeconomic events like the US Federal Reserve’s decision on interest rates influence crypto assets mainly through the direct impact they have on the US Dollar. An increase in interest rate typically negatively influences Bitcoin and altcoin prices, and vice versa. If the US Dollar index declines, risk assets and associated leverage for trading gets cheaper, in turn driving crypto prices higher.
Halvings are typically considered bullish events as they slash the block reward in half for miners, constricting the supply of the asset. At consistent demand if the supply reduces, the asset’s price climbs.

Lebih sejuta pengguna bergantung pada FXStreet untuk data pasaran masa nyata, alat carta, pandangan pakar dan berita Forex. Kalendar ekonomi yang komprehensif dan webinar pendidikan mereka membantu pedagang kekal bermaklumat dan membuat keputusan yang dikira. FXStreet disokong oleh pasukan kira-kira 60 profesional di ibu pejabat Barcelona dan pelbagai wilayah global.
Baca Lagi


