
Top 3 Price Prediction: Bitcoin, Ethereum, Ripple – BTC holds gains, ETH eyes breakout, XRP extends recovery
Oleh Manish Chhetri
Dikemas kini: 6 Apr 2026


ARTIKEL POPULAR

Bitcoin (BTC) and Ethereum (ETH) trade in green on Monday after recovering nearly 5% and 6.5%, respectively, while Ripple (XRP) consolidates above key support.
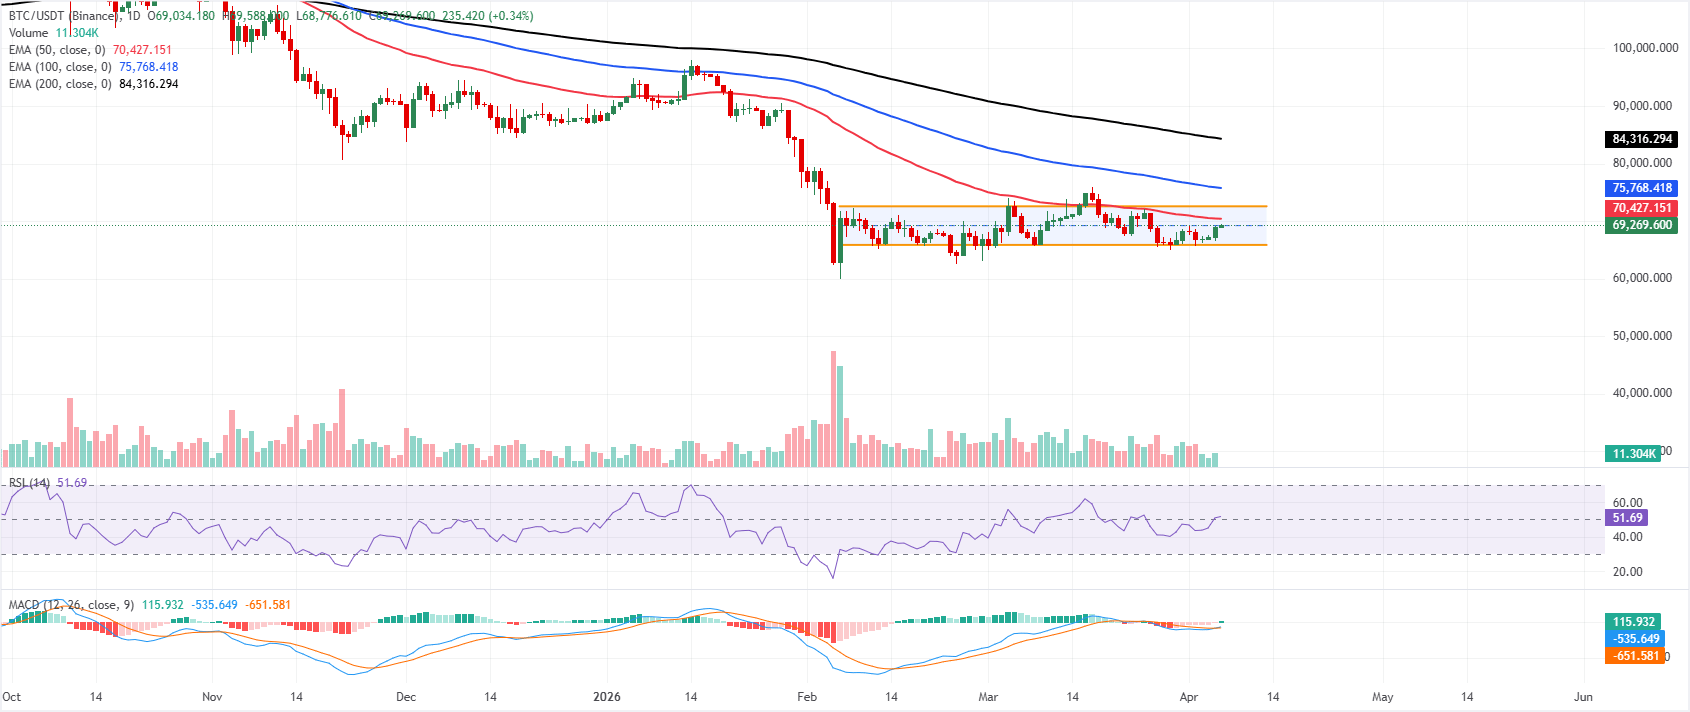
- Bitcoin price trades in green on Monday after recovering nearly 5% in the previous week.
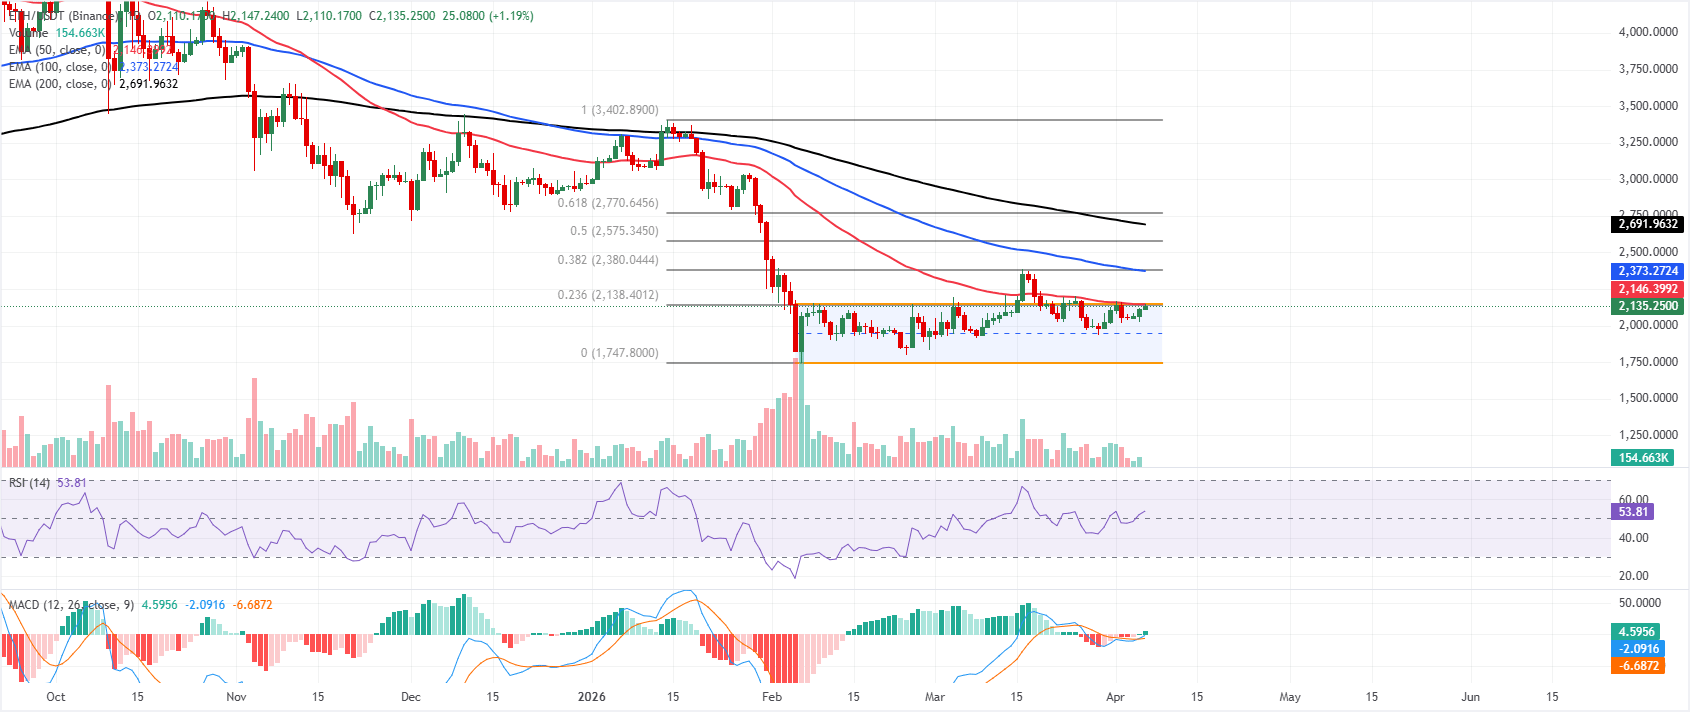
- Ethereum nears the 50-day EMA at $2,146, a breakout suggests an upward move.
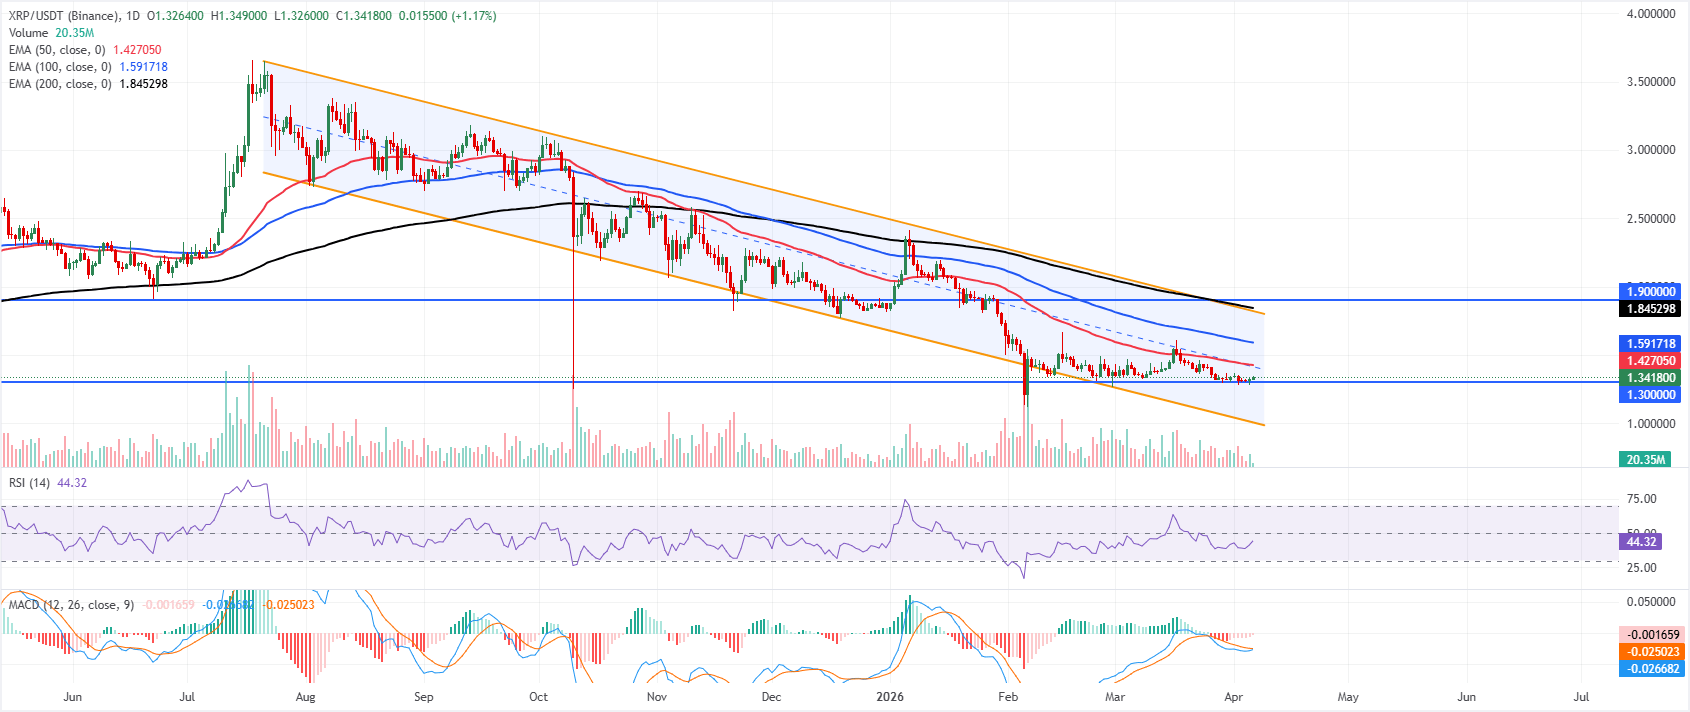
- XRP extends its recovery after finding support at the horizontal level of $1.30.
Bitcoin (BTC) and Ethereum (ETH) trade in green on Monday after recovering nearly 5% and 6.5%, respectively, while Ripple (XRP) consolidates above key support. The price action across these top three cryptocurrencies points to a potential upside ahead, supported by improving momentum indicators that signal improving bullish sentiment.
Bitcoin nears the midpoint of the channel
Bitcoin price is trading above $69,000 on Monday after recovering over 4% in the previous week. The near-term bias turns mildly bullish as price rebounds from the lower boundary of the channel, with spot now pivoting back toward the channel midpoint after holding just above support near $66,000.
The cluster of Exponential Moving Averages (EMAs) remains overhead, with the 50-day EMA around $70,400 capping the immediate recovery attempt. Yet, the Moving Average Convergence Divergence (MACD) indicator has crossed back into positive territory and turned higher, hinting at improving upside momentum. The Relative Strength Index (RSI) on the daily chart at 52 reinforces a shift toward buyer control after oscillating around the midline, suggesting that recent dips attracted demand rather than accelerating selling.
Initial resistance stands at the channel top near $72,600, followed by a higher barrier around $75,000 if buyers extend the current bounce above the 50-day EMA. A daily close beyond the channel resistance would expose the $78,000 region as the next notable upside target.
On the downside, immediate support lies near $68,000, ahead of a more important floor at $66,400, aligned with the recent swing low and the lower channel boundary around $65,900. A break below this support area would negate the nascent bullish tone and reopen the path toward $64,000, while sustained trade above $68,000 keeps the focus on further recovery within or above the channel.
Ethereum nears the descending channel’s upper boundary
Ethereum trades above $2,100 on Monday after recovering 6.2% in the previous week. The near-term bias suggests a potential breakout, with price nearing the descending channel’s upper boundary near $2,148 and the 23.6% Fibonacci retracement at $2,138, measured from the $1,747.80 low to the $3,402.89 high. A breakout signals a bullish move ahead.
Daily closes remain well under the 50-day, 100-day and 200-day EMAs, which slope lower and reinforce overhead supply. Momentum is stabilizing rather than trending, as the RSI on the daily chart at 53 drifts just above the midline. At the same time, the MACD line has turned higher above its signal line but still hovers close to the zero area, suggesting only modest recovery pressure within a broader corrective structure.
Initial resistance emerges at the channel top near $2,148, followed by the $2,138 23.6% Fibonacci retracement acting as a nearby cap, with stronger resistance aligning around the 38.2% retracement at $2,380.
On the downside, immediate support sits near the recent swing area around $2,060, ahead of the channel floor and Fibonacci base at $1,747. A daily close above $2,148 would signal a break of the channel and open the way toward $2,380, whereas a failure to hold above $2,060 would expose a deeper slide toward the channel’s lower boundary, closer to $1,750.
XRP holds above key support at $1.30
XRP price trades at $1.34 after finding support around the horizontal support at $1.0 the previous week. XRP trades within a descending parallel channel that began near $2.83, keeping the broader structure bearish despite the latest bounce from the channel's lower half. Price remains capped beneath the 50-day, 100-day and 200-day EMAs, which cluster well above spot and reinforce the prevailing downside bias.
The RSI on the daily chart at 44 stays below the 50 line, suggesting only modest recovery momentum after recent weakness, while the MACD indicator edges higher but still prints below the zero line, hinting at fading bearish pressure rather than a confirmed shift to an uptrend.
Initial support is seen around $1.30, where a horizontal level aligns with the recent reaction low inside the channel. A daily close below this area would expose the channel floor near $1.01 and reopen a deeper decline within the broader downtrend.
On the upside, the first resistance to watch sits near the mid-channel region around $1.45, with stronger resistance at $1.90, where a prior horizontal cap converges with the descending channel’s upper boundary. A sustained break above that higher band would be required to neutralize the current bearish daily bias and signal a more durable recovery phase.
(The technical analysis of this story was written with the help of an AI tool.)
Cryptocurrency prices FAQs
Token launches influence demand and adoption among market participants. Listings on crypto exchanges deepen the liquidity for an asset and add new participants to an asset’s network. This is typically bullish for a digital asset.
A hack is an event in which an attacker captures a large volume of the asset from a DeFi bridge or hot wallet of an exchange or any other crypto platform via exploits, bugs or other methods. The exploiter then transfers these tokens out of the exchange platforms to ultimately sell or swap the assets for other cryptocurrencies or stablecoins. Such events often involve an en masse panic triggering a sell-off in the affected assets.
Macroeconomic events like the US Federal Reserve’s decision on interest rates influence crypto assets mainly through the direct impact they have on the US Dollar. An increase in interest rate typically negatively influences Bitcoin and altcoin prices, and vice versa. If the US Dollar index declines, risk assets and associated leverage for trading gets cheaper, in turn driving crypto prices higher.
Halvings are typically considered bullish events as they slash the block reward in half for miners, constricting the supply of the asset. At consistent demand if the supply reduces, the asset’s price climbs.

Lebih sejuta pengguna bergantung pada FXStreet untuk data pasaran masa nyata, alat carta, pandangan pakar dan berita Forex. Kalendar ekonomi yang komprehensif dan webinar pendidikan mereka membantu pedagang kekal bermaklumat dan membuat keputusan yang dikira. FXStreet disokong oleh pasukan kira-kira 60 profesional di ibu pejabat Barcelona dan pelbagai wilayah global.
Baca Lagi


