
Top 3 Price Prediction: Bitcoin, Ethereum, Ripple – BTC shows mild signs of recovery, ETH and XRP remain under pressure
Oleh Manish Chhetri
Tarikh Diterbitkan: 23 Jan 2026 | Tarikh Diubah: 23 Jan 2026


ARTIKEL POPULAR

Bitcoin (BTC), Ethereum (ETH) and Ripple (XRP) show mixed signals at the time of writing on Friday as the broader crypto market attempts to stabilize after this week’s sell-off. BTC extends its recovery after finding support around a key level.
- Bitcoin extends recovery on Friday after finding support at the midpoint of a horizontal parallel channel.
- Ethereum price steadies around $2,960 after closing below the daily support earlier this week.
- XRP edges below $1.91 after failing to close above the key resistance.
Bitcoin (BTC), Ethereum (ETH) and Ripple (XRP) show mixed signals at the time of writing on Friday as the broader crypto market attempts to stabilize after this week’s sell-off. BTC extends its recovery after finding support around a key level. Meanwhile, ETH and XRP remain under pressure after closing below their critical support zone, keeping the downside risk intact.
Bitcoin rebounds after retesting key support
Bitcoin price started the week on a negative note, closing below key support levels: the 50-day Exponential Moving Average (EMA) at $91,942 and the previously broken upper consolidation boundary at $90,000. On Wednesday, BTC rebounded slightly after retesting the midpoint of a horizontal parallel channel at $87,787 and continued its recovery the next day. At the time of writing on Friday, BTC is trading at around $89,900.
If BTC continues its ongoing recovery, it could extend the advance toward the 50-day EMA at $91,942.
The Relative Strength Index (RSI) on the daily chart is 44, pointing upward toward the neutral 50 level, indicating fading bearish momentum. For the bullish momentum to be sustained, the RSI must move above the neutral level. However, traders should be cautious, as the Moving Average Convergence Divergence (MACD) indicator showed a bearish crossover on Tuesday, suggesting a mild downward pressure.
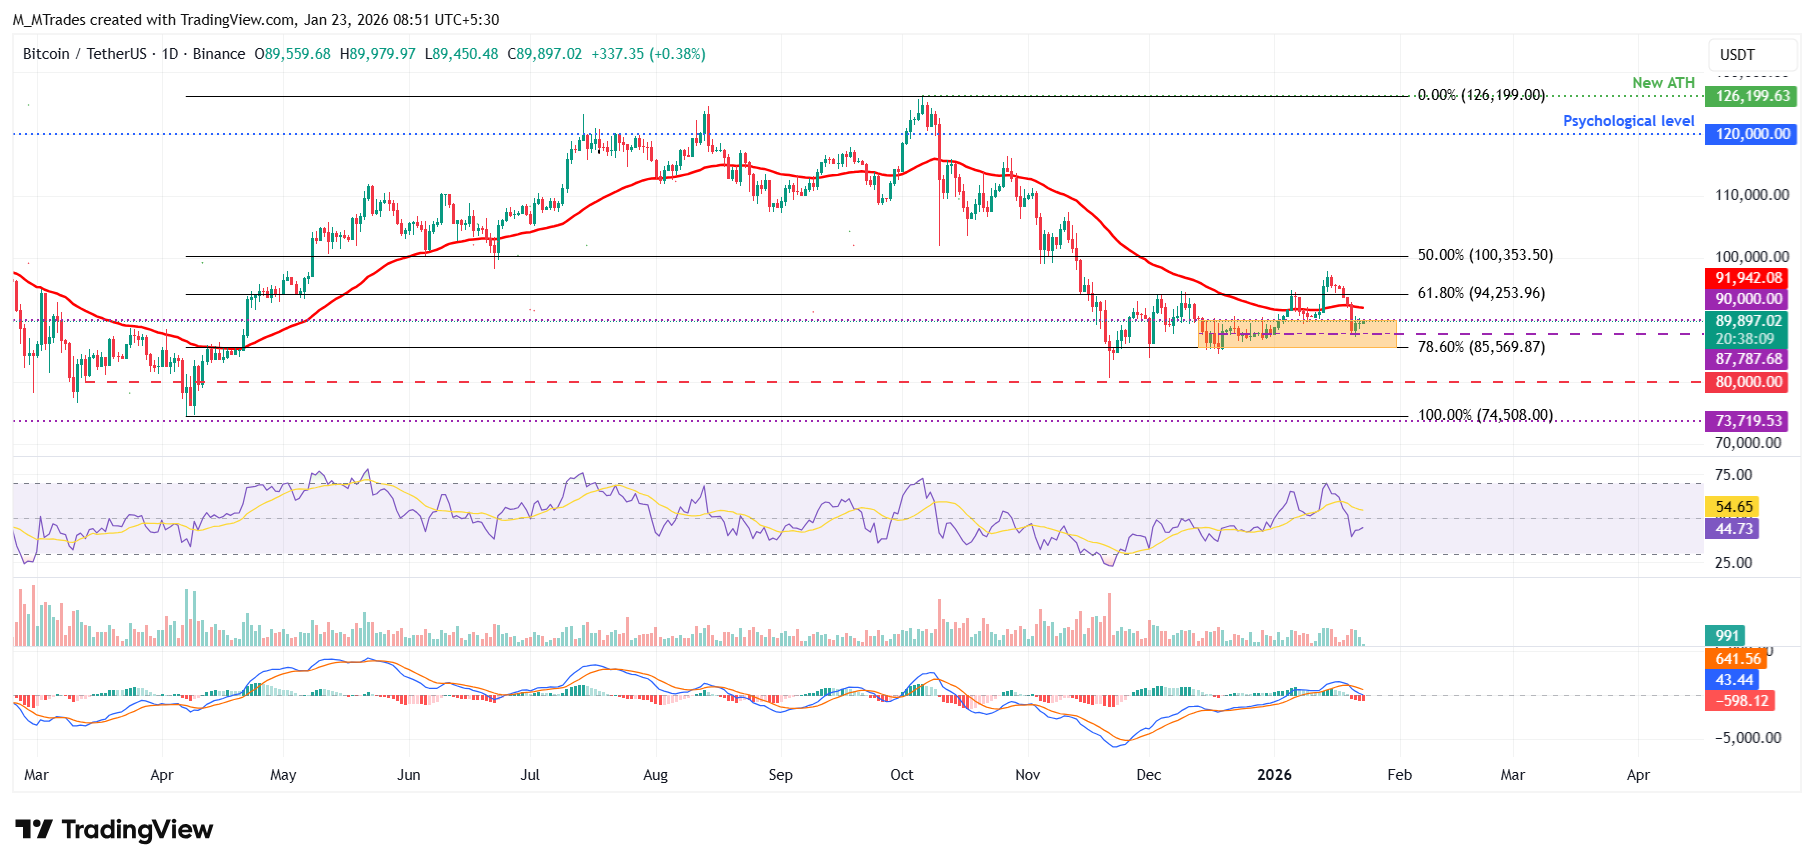
On the other hand, if BTC closes below the $87,787 support on a daily basis, it could extend the fall toward the lower consolidation boundary at $85,569, which coincides with the 78.6% Fibonacci retracement level.
Ethereum fails to close above the daily resistance at $3,017
Ethereum price extended its correction by more than 10% through Tuesday and closed below key support levels: the 50-day EMA at $3,135 and the daily support at $3,017. On Wednesday, ETH recovered slightly but failed to close above the daily level at $3,017 and declined slightly the next day. As of Friday, ETH hovers at $2,964.
If the daily level at $3,017 continues to hold as resistance, ETH could extend the decline toward the 61.8% Fibonacci retracement level (drawn from the April low of $1,385 to the August all-time high of $4,956) at $2,749.45.
The RSI on the daily chart reads 40, below the neutral level of 50, indicating bearish momentum gaining traction. The Moving Average Convergence Divergence (MACD) indicator also showed a bearish crossover on Tuesday, further supporting the downward view.
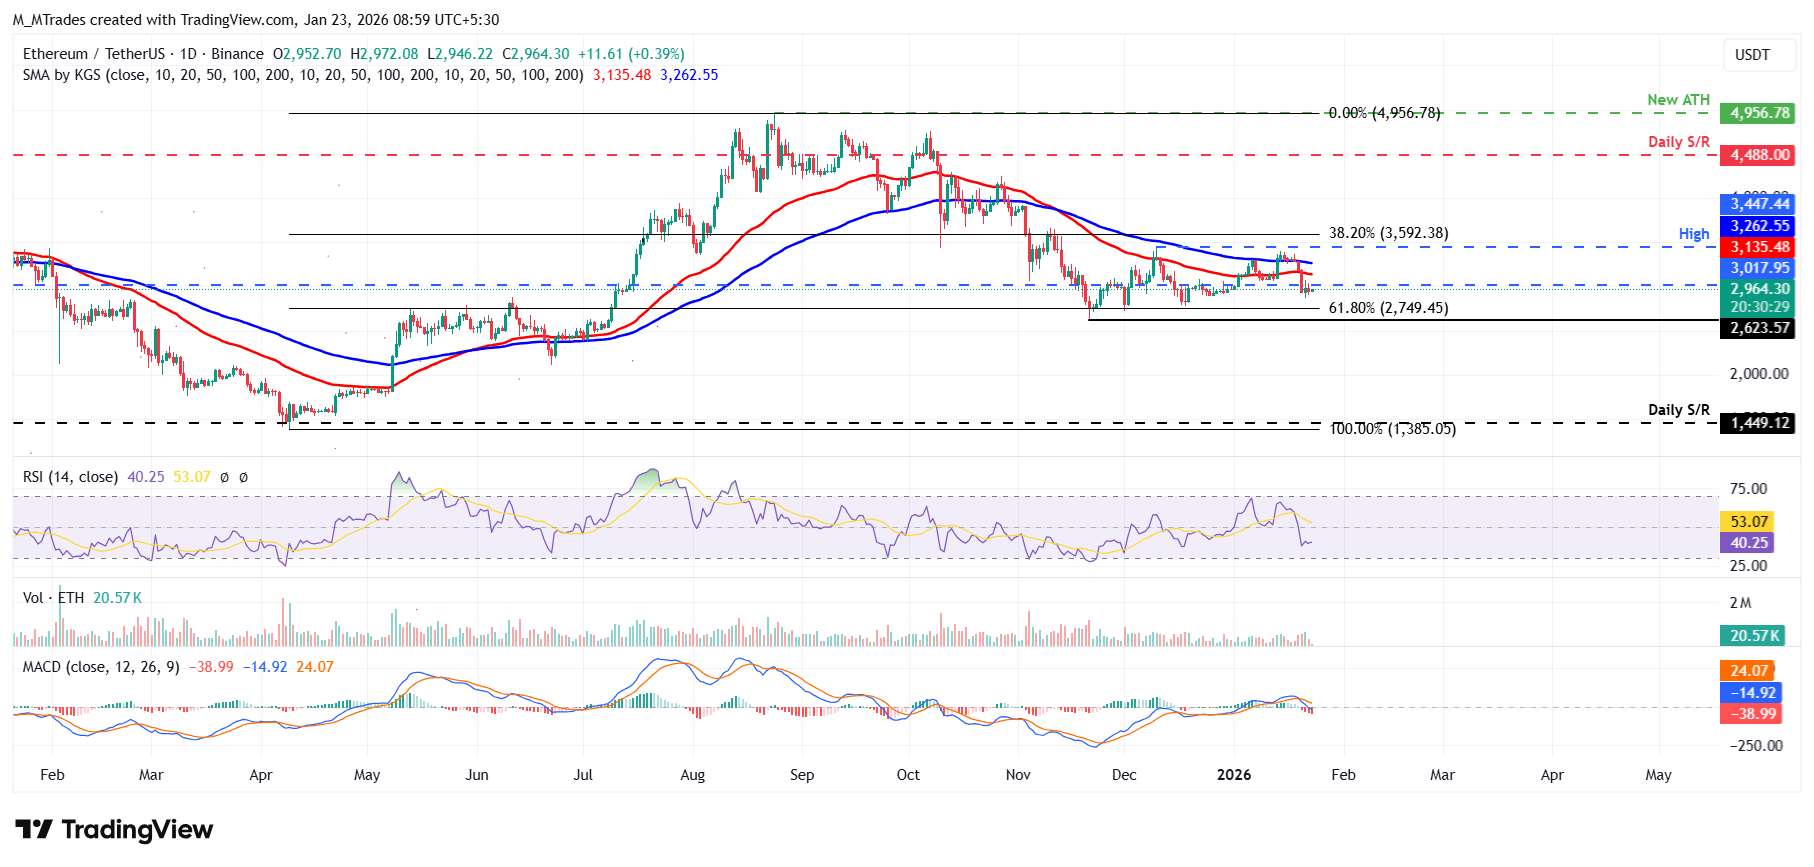
However, if ETH recovers and closes above the daily resistance at $3,017, it could extend the advance toward the 50-day EMA at $3,135.
XRP bears are aiming for the $1.77 mark
XRP price faced rejection from the 50-day EMA at $2.04 last week and has since lost more than 8% since the weekend, closing below the daily support at $1.96 on Tuesday. XRP recovered slightly on Wednesday but failed to close above the daily level at $1.96, declining slightly the next day. As of Friday, XRP is trading down at $1.91.
If XRP continues its correction, it could extend the decline toward the December 19 low of $1.77.
Like Ethereum, XRP's momentum indicators (RSI and MACD) also support a bearish view.
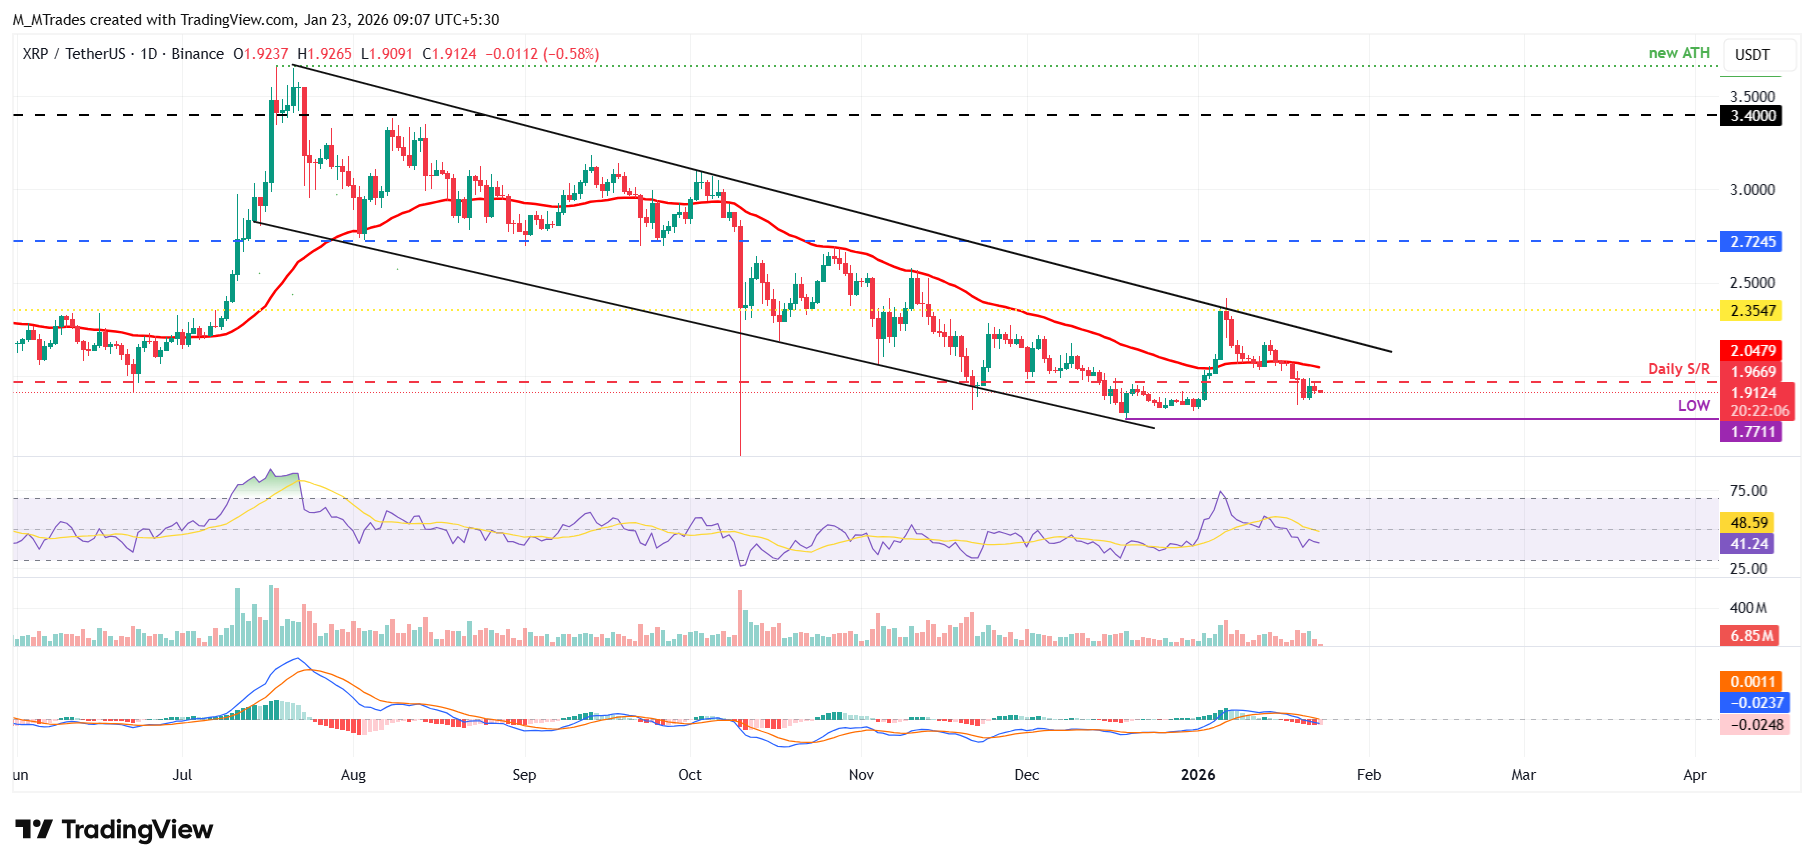
On the other hand, if XRP recovers and closes above the daily resistance at $1.966, it could extend the recovery toward the 50-day EMA at $2.04.
Cryptocurrency metrics FAQs
The developer or creator of each cryptocurrency decides on the total number of tokens that can be minted or issued. Only a certain number of these assets can be minted by mining, staking or other mechanisms. This is defined by the algorithm of the underlying blockchain technology. On the other hand, circulating supply can also be decreased via actions such as burning tokens, or mistakenly sending assets to addresses of other incompatible blockchains.
Market capitalization is the result of multiplying the circulating supply of a certain asset by the asset’s current market value.
Trading volume refers to the total number of tokens for a specific asset that has been transacted or exchanged between buyers and sellers within set trading hours, for example, 24 hours. It is used to gauge market sentiment, this metric combines all volumes on centralized exchanges and decentralized exchanges. Increasing trading volume often denotes the demand for a certain asset as more people are buying and selling the cryptocurrency.
Funding rates are a concept designed to encourage traders to take positions and ensure perpetual contract prices match spot markets. It defines a mechanism by exchanges to ensure that future prices and index prices periodic payments regularly converge. When the funding rate is positive, the price of the perpetual contract is higher than the mark price. This means traders who are bullish and have opened long positions pay traders who are in short positions. On the other hand, a negative funding rate means perpetual prices are below the mark price, and hence traders with short positions pay traders who have opened long positions.

Lebih sejuta pengguna bergantung pada FXStreet untuk data pasaran masa nyata, alat carta, pandangan pakar dan berita Forex. Kalendar ekonomi yang komprehensif dan webinar pendidikan mereka membantu pedagang kekal bermaklumat dan membuat keputusan yang dikira. FXStreet disokong oleh pasukan kira-kira 60 profesional di ibu pejabat Barcelona dan pelbagai wilayah global.
Baca Lagi


