
Top Crypto Gainers: Near Protocol, Virtuals Protocol, and Morpho lead market recovery
Oleh Vishal Dixit
Tarikh Diterbitkan: 3 Mar 2026 | Tarikh Diubah: 3 Mar 2026


ARTIKEL POPULAR

Near Protocol (NEAR), Virtuals Protocol (VIRTUAL), and Morpho (MORPHO) are leading the market recovery with double-digit gains over the last 24 hours. Technically, NEAR extends the breakout of the falling channel pattern, VIRTUAL holds above the 50-day EMA, while MORPHO tests a crucial resistance.
- Near Protocol is up over 2% on Tuesday, extending Monday's 18% gains.
- Virtuals Protocol holds steady above the 50-day EMA after an 11% jump on Monday.
- Morpho tests a crucial resistance level on Tuesday following a 10% rise the previous day.
Near Protocol (NEAR), Virtuals Protocol (VIRTUAL), and Morpho (MORPHO) are leading the market recovery with double-digit gains over the last 24 hours. Technically, NEAR extends the breakout of the falling channel pattern, VIRTUAL holds above the 50-day EMA, while MORPHO tests a crucial resistance.
The broader market recovery aligns with Bitcoin (BTC) staging a more than 4% rise over the last 24 hours, trading above $69,000 amid ongoing US-Israel attacks on Iran.
Near Protocol breakout rally targets a higher leg
Near Protocol rises more than 2% at press time on Tuesday, extending the 18% gains from the previous day. The near-term bias is mildly bullish after NEAR broke above a falling channel pattern on the daily logarithmic chart, signaling a shift away from the broader downtrend. The Layer-1 token price exceeds the 50-day Exponential Moving Average (EMA) at $1.2519 but remains below the 200-day EMA at $1.8023, suggesting a short-term bullish bias.
The Moving Average Convergence Divergence (MACD) histogram expands into positive territory as the MACD and signal lines rise above zero, suggesting improving bullish momentum. The Relative Strength Index (RSI) at 66 reflects an intense bullish pressure, but is approaching overbought territory.
The breakout rally targets the R2 Pivot Point at $1.5100 as the initial resistance. If NEAR clears this level, it would open the door to the R3 Pivot Point at $1.7600, near the 200-day EMA.
On the flip side, the 50-day EMA is at $1.2519, near the broken descending trendline, which remains a crucial support zone, followed by the $1.00 psychological level.
Virtuals Protocol recovery gradually gains traction
Virtuals Protocol crossed above the 50-day EMA at $0.7107 with an 11% jump on Monday. At the time of writing, VIRTUAL hovers above $0.7500 on Tuesday, targeting the $0.8795 level, last tested on January 28. A daily close above this level could test the 200-day EMA at $0.9790, near the $1.00 psychological level.
The MACD and signal line move into positive territory with a modestly expanding positive histogram, while the RSI at 61 remains below overbought thresholds, reinforcing a buy-side dominance.
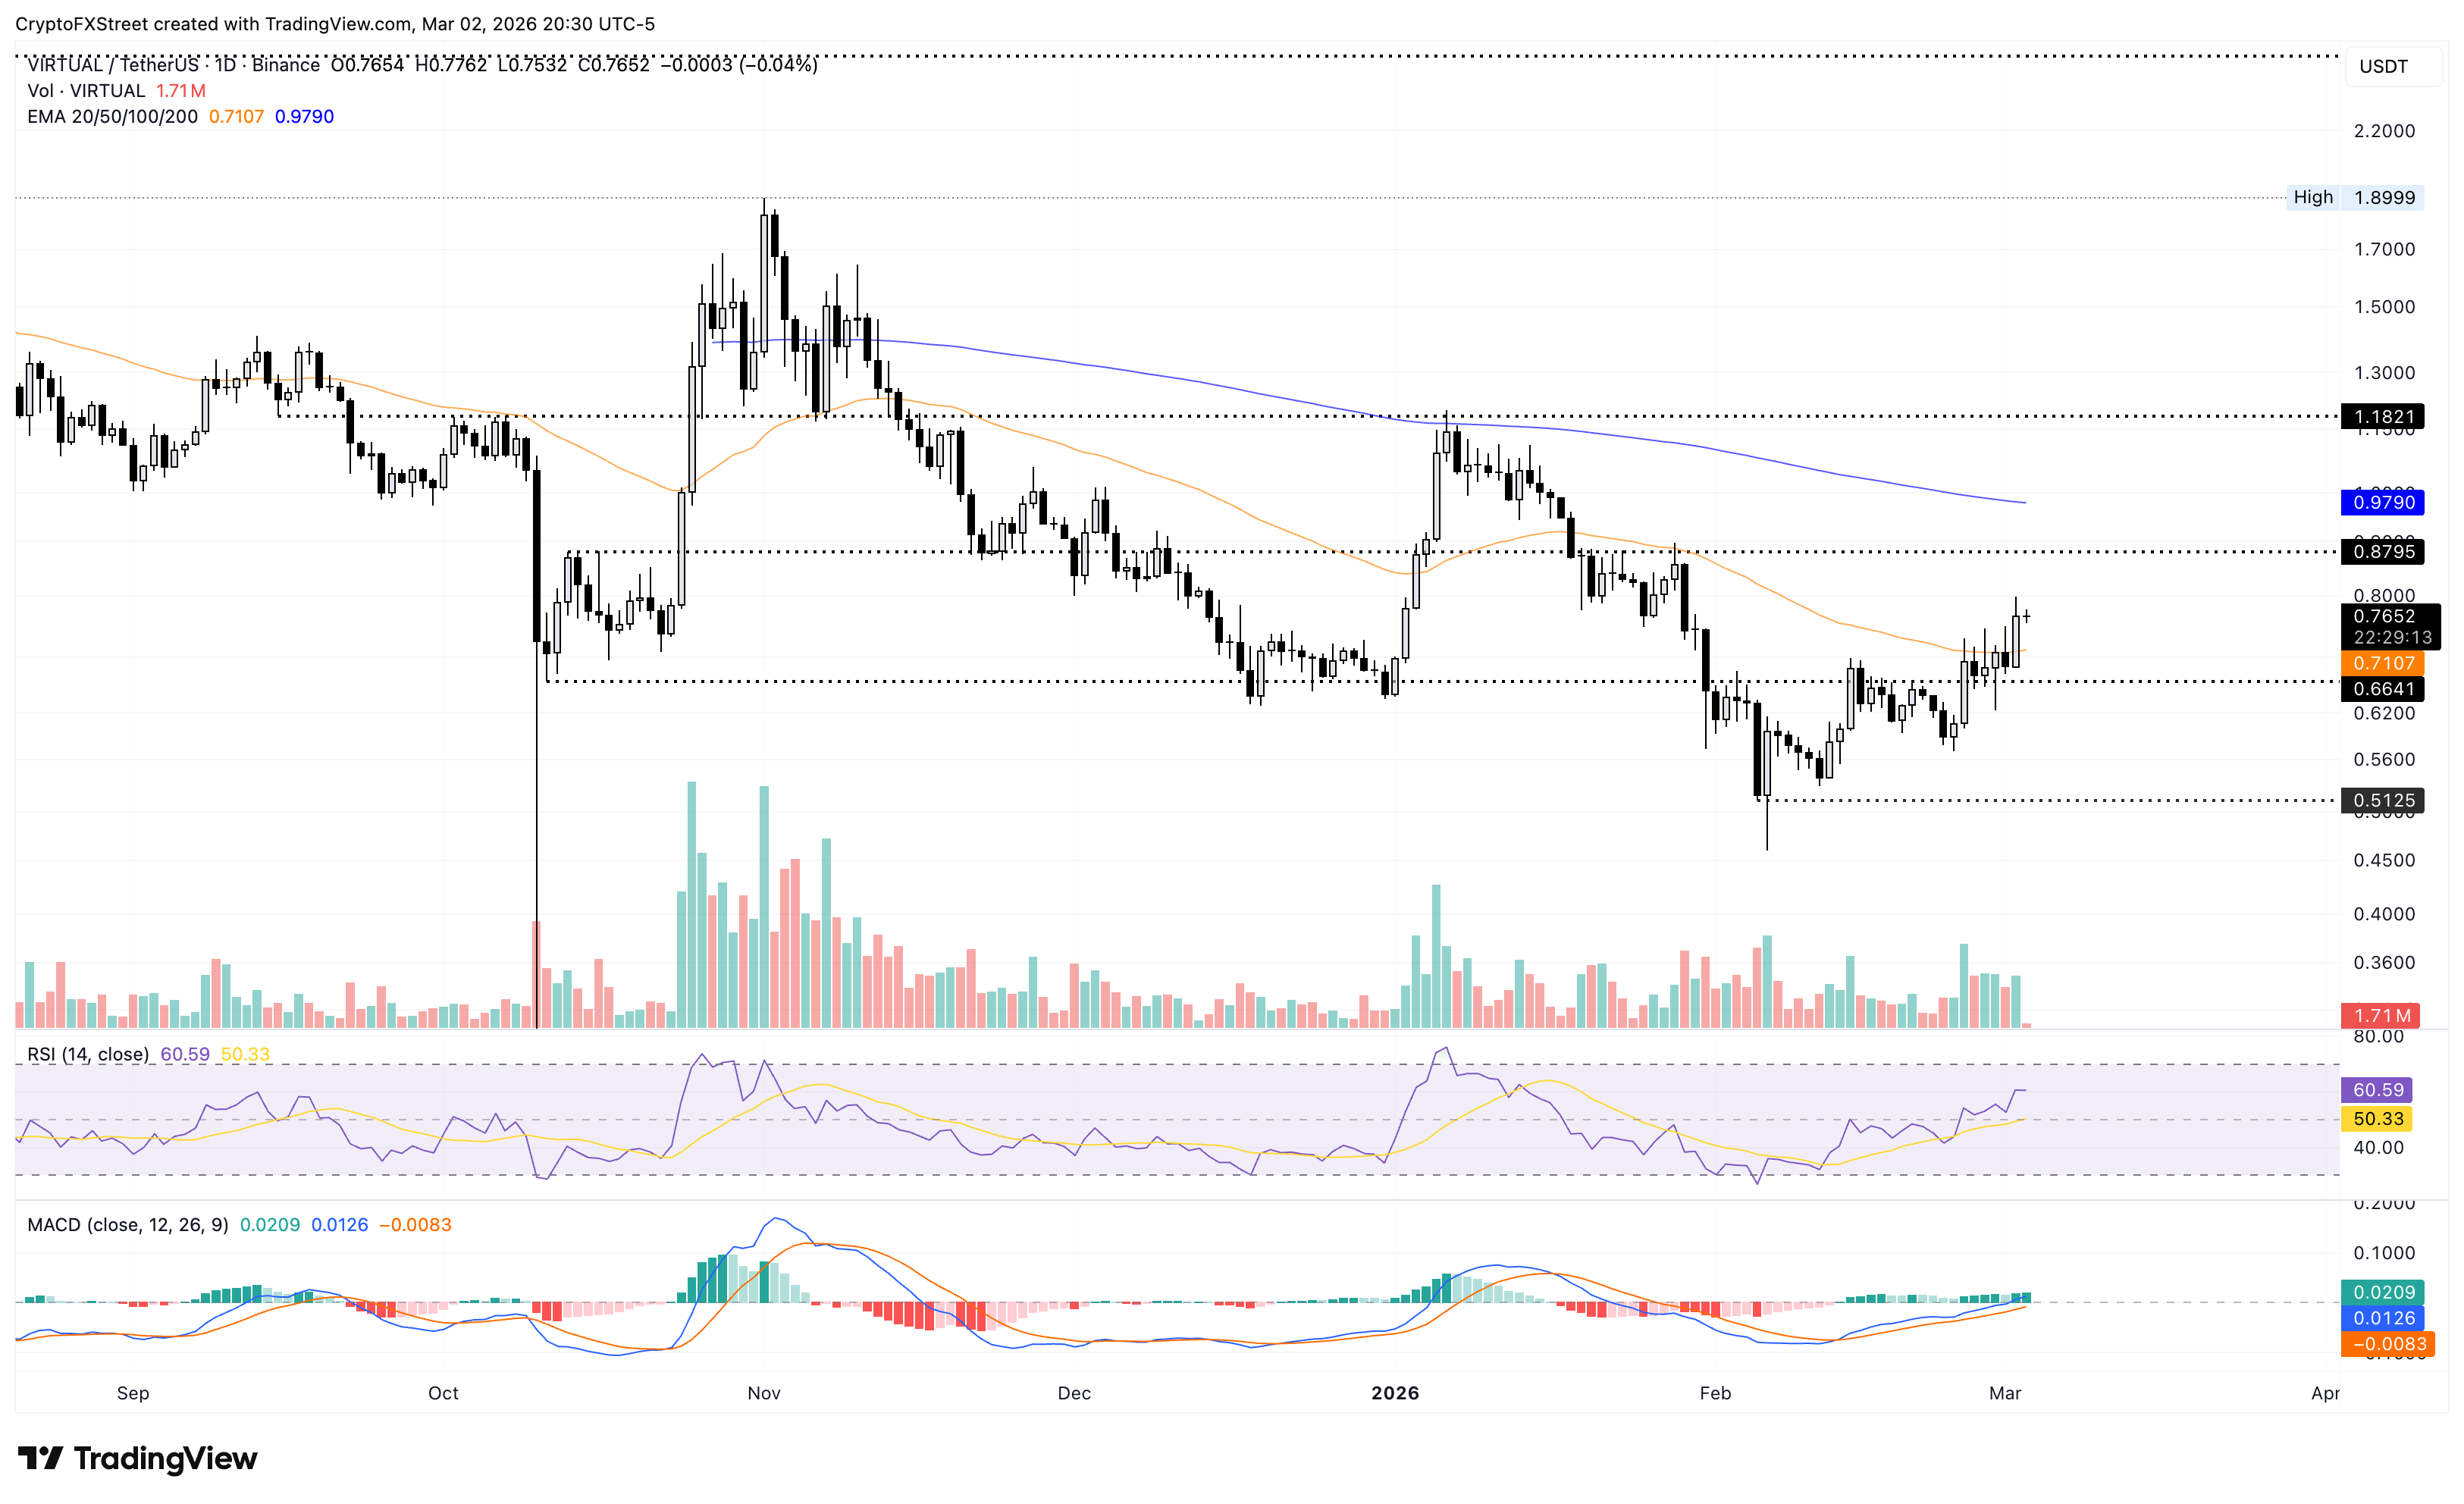
Looking down, the 50-day EMA at $0.7107 could cap the downside risk if VIRTUAL flips from a key resistance.
Morpho risks capped recovery at key resistance
Morpho hovers above $1.90 at the time of writing on Tuesday, following a 10% jump the previous day. The near-term bias is bullish as price extends above the rising 50- and 200-day EMAs, suggesting a possible Golden Cross pattern.
The MACD and signal line remain in the positive territory, though the histogram has flattened, suggesting upside momentum persists. The RSI at 71 is in the overbought territory, indicating strong buying pressure that leaves the pair vulnerable to intermittent pullbacks.
Morpho tests the $1.9250 resistance level marked by the November 18 high. A decisive close above this level would strengthen the upside bias, targeting the R1 Pivot Point at $2.1647.
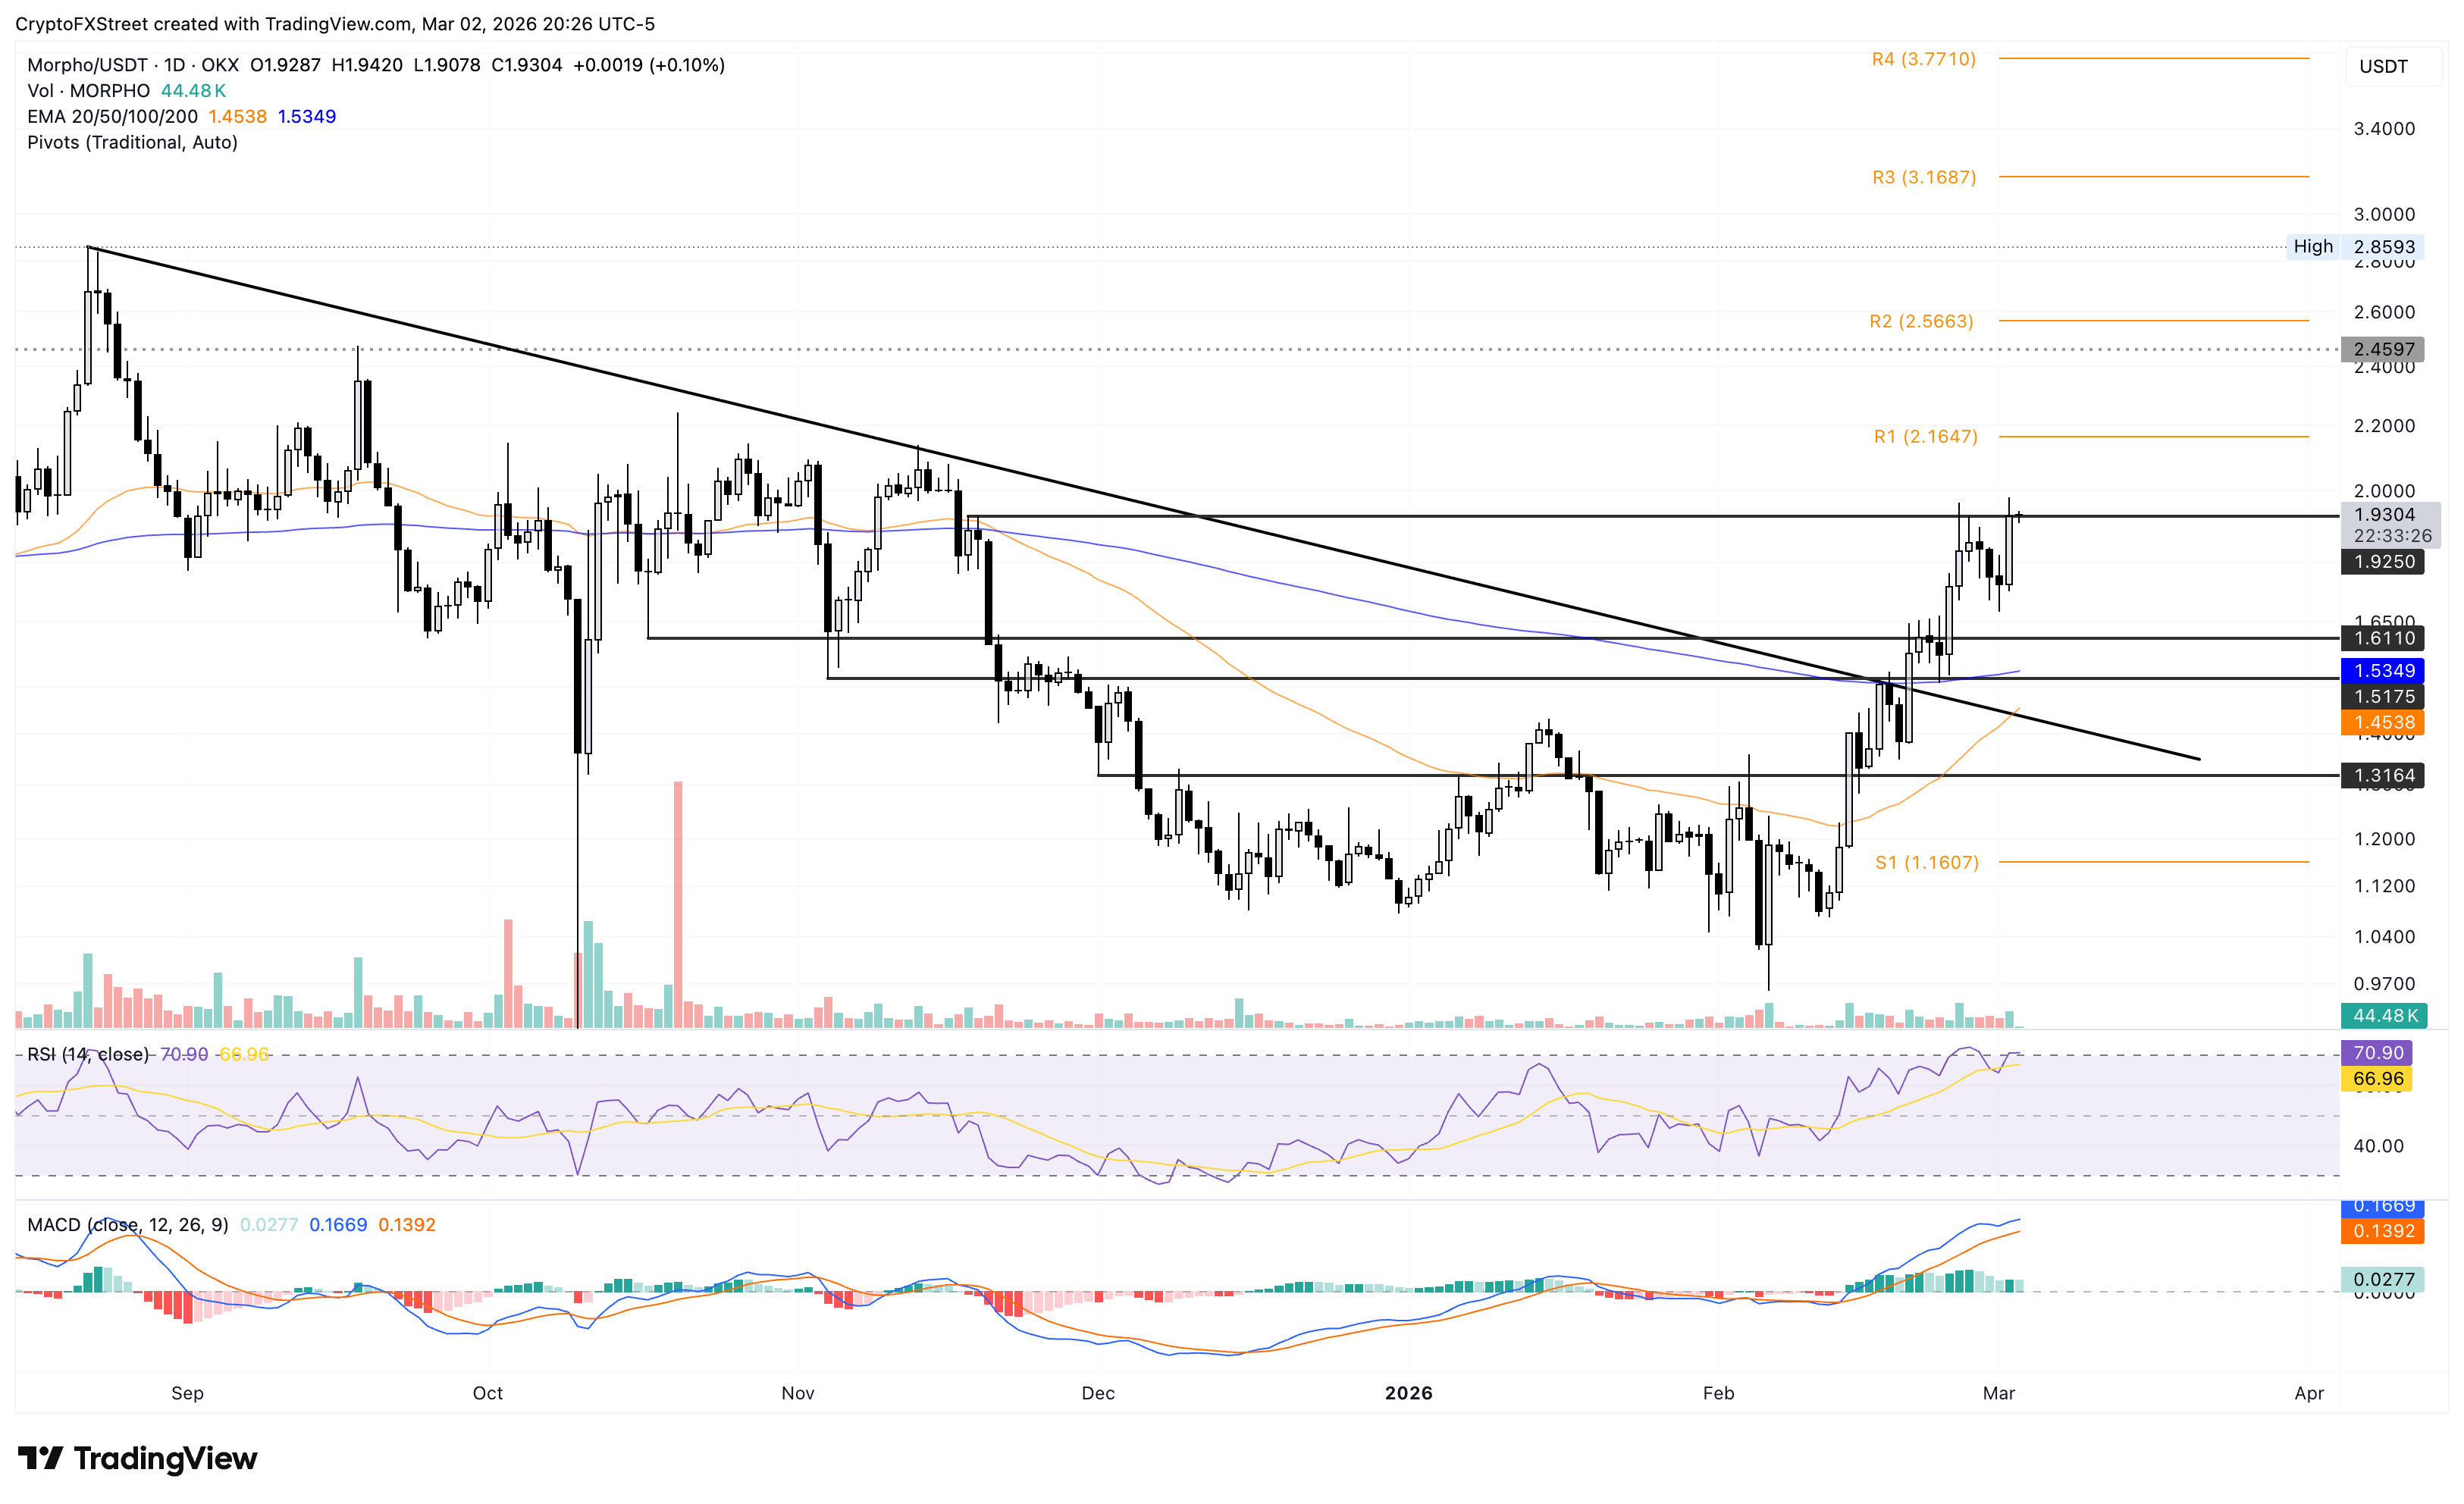
The immediate support emerges at the recent breakout area near $1.6110, with the 200-day EMA around $1.5349 providing a deeper line of defense.
(The technical analysis of this story was written with the help of an AI tool.)

Lebih sejuta pengguna bergantung pada FXStreet untuk data pasaran masa nyata, alat carta, pandangan pakar dan berita Forex. Kalendar ekonomi yang komprehensif dan webinar pendidikan mereka membantu pedagang kekal bermaklumat dan membuat keputusan yang dikira. FXStreet disokong oleh pasukan kira-kira 60 profesional di ibu pejabat Barcelona dan pelbagai wilayah global.
Baca Lagi


