
Top Crypto Gainers: Polkadot, Near Protocol, Uniswap lead market rebound
Oleh Vishal Dixit
Tarikh Diterbitkan: 26 Feb 2026 | Tarikh Diubah: 26 Feb 2026


ARTIKEL POPULAR

Altcoins, such as Polkadot (DOT), Near Protocol (NEAR), and Uniswap (UNI), are leading gains over the last 24 hours as Bitcoin (BTC) jumped 6% on Wednesday.
- Polkadot holds above its 50-day EMA on Thursday after a 34% rally on the previous day.
- Near Protocol holds steady as the 50-day EMA caps the rebound to 21% on the previous day.
- Uniswap approaches $4 on Thursday following a 21% rebound the previous day.
Altcoins, such as Polkadot (DOT), Near Protocol (NEAR), and Uniswap (UNI), are leading gains over the last 24 hours as Bitcoin (BTC) jumped 6% on Wednesday. The altcoins are holding steady at press time on Thursday following a rebound the previous day, testing the waters around their 50-day Exponential Moving Average (EMA).
Polkadot rally tests the limits of a falling channel pattern
Polkadot is trading above $1.60 at the time of writing on Thursday, following a 34% rally the previous day. The near-term bias turns cautiously bullish as DOT tests a long-running descending trendline at $1.75, which capped gains on Wednesday and is part of a falling channel pattern.
A decisive close above $1.75 could extend the rally toward the R1 Pivot Point at $2.12.
Still, a daily close has reclaimed the 50-day Exponential Moving Average (EMA) near $1.60, while remaining well below the 200-day EMA, suggesting the current move is an early recovery within a broader downtrend.
The Moving Average Convergence Divergence (MACD) line is above its signal line, with an expanding positive histogram suggesting improving bullish momentum, while the Relative Strength Index (RSI) at 61 indicates a surge in buying pressure with further upside room before reaching overbought conditions.
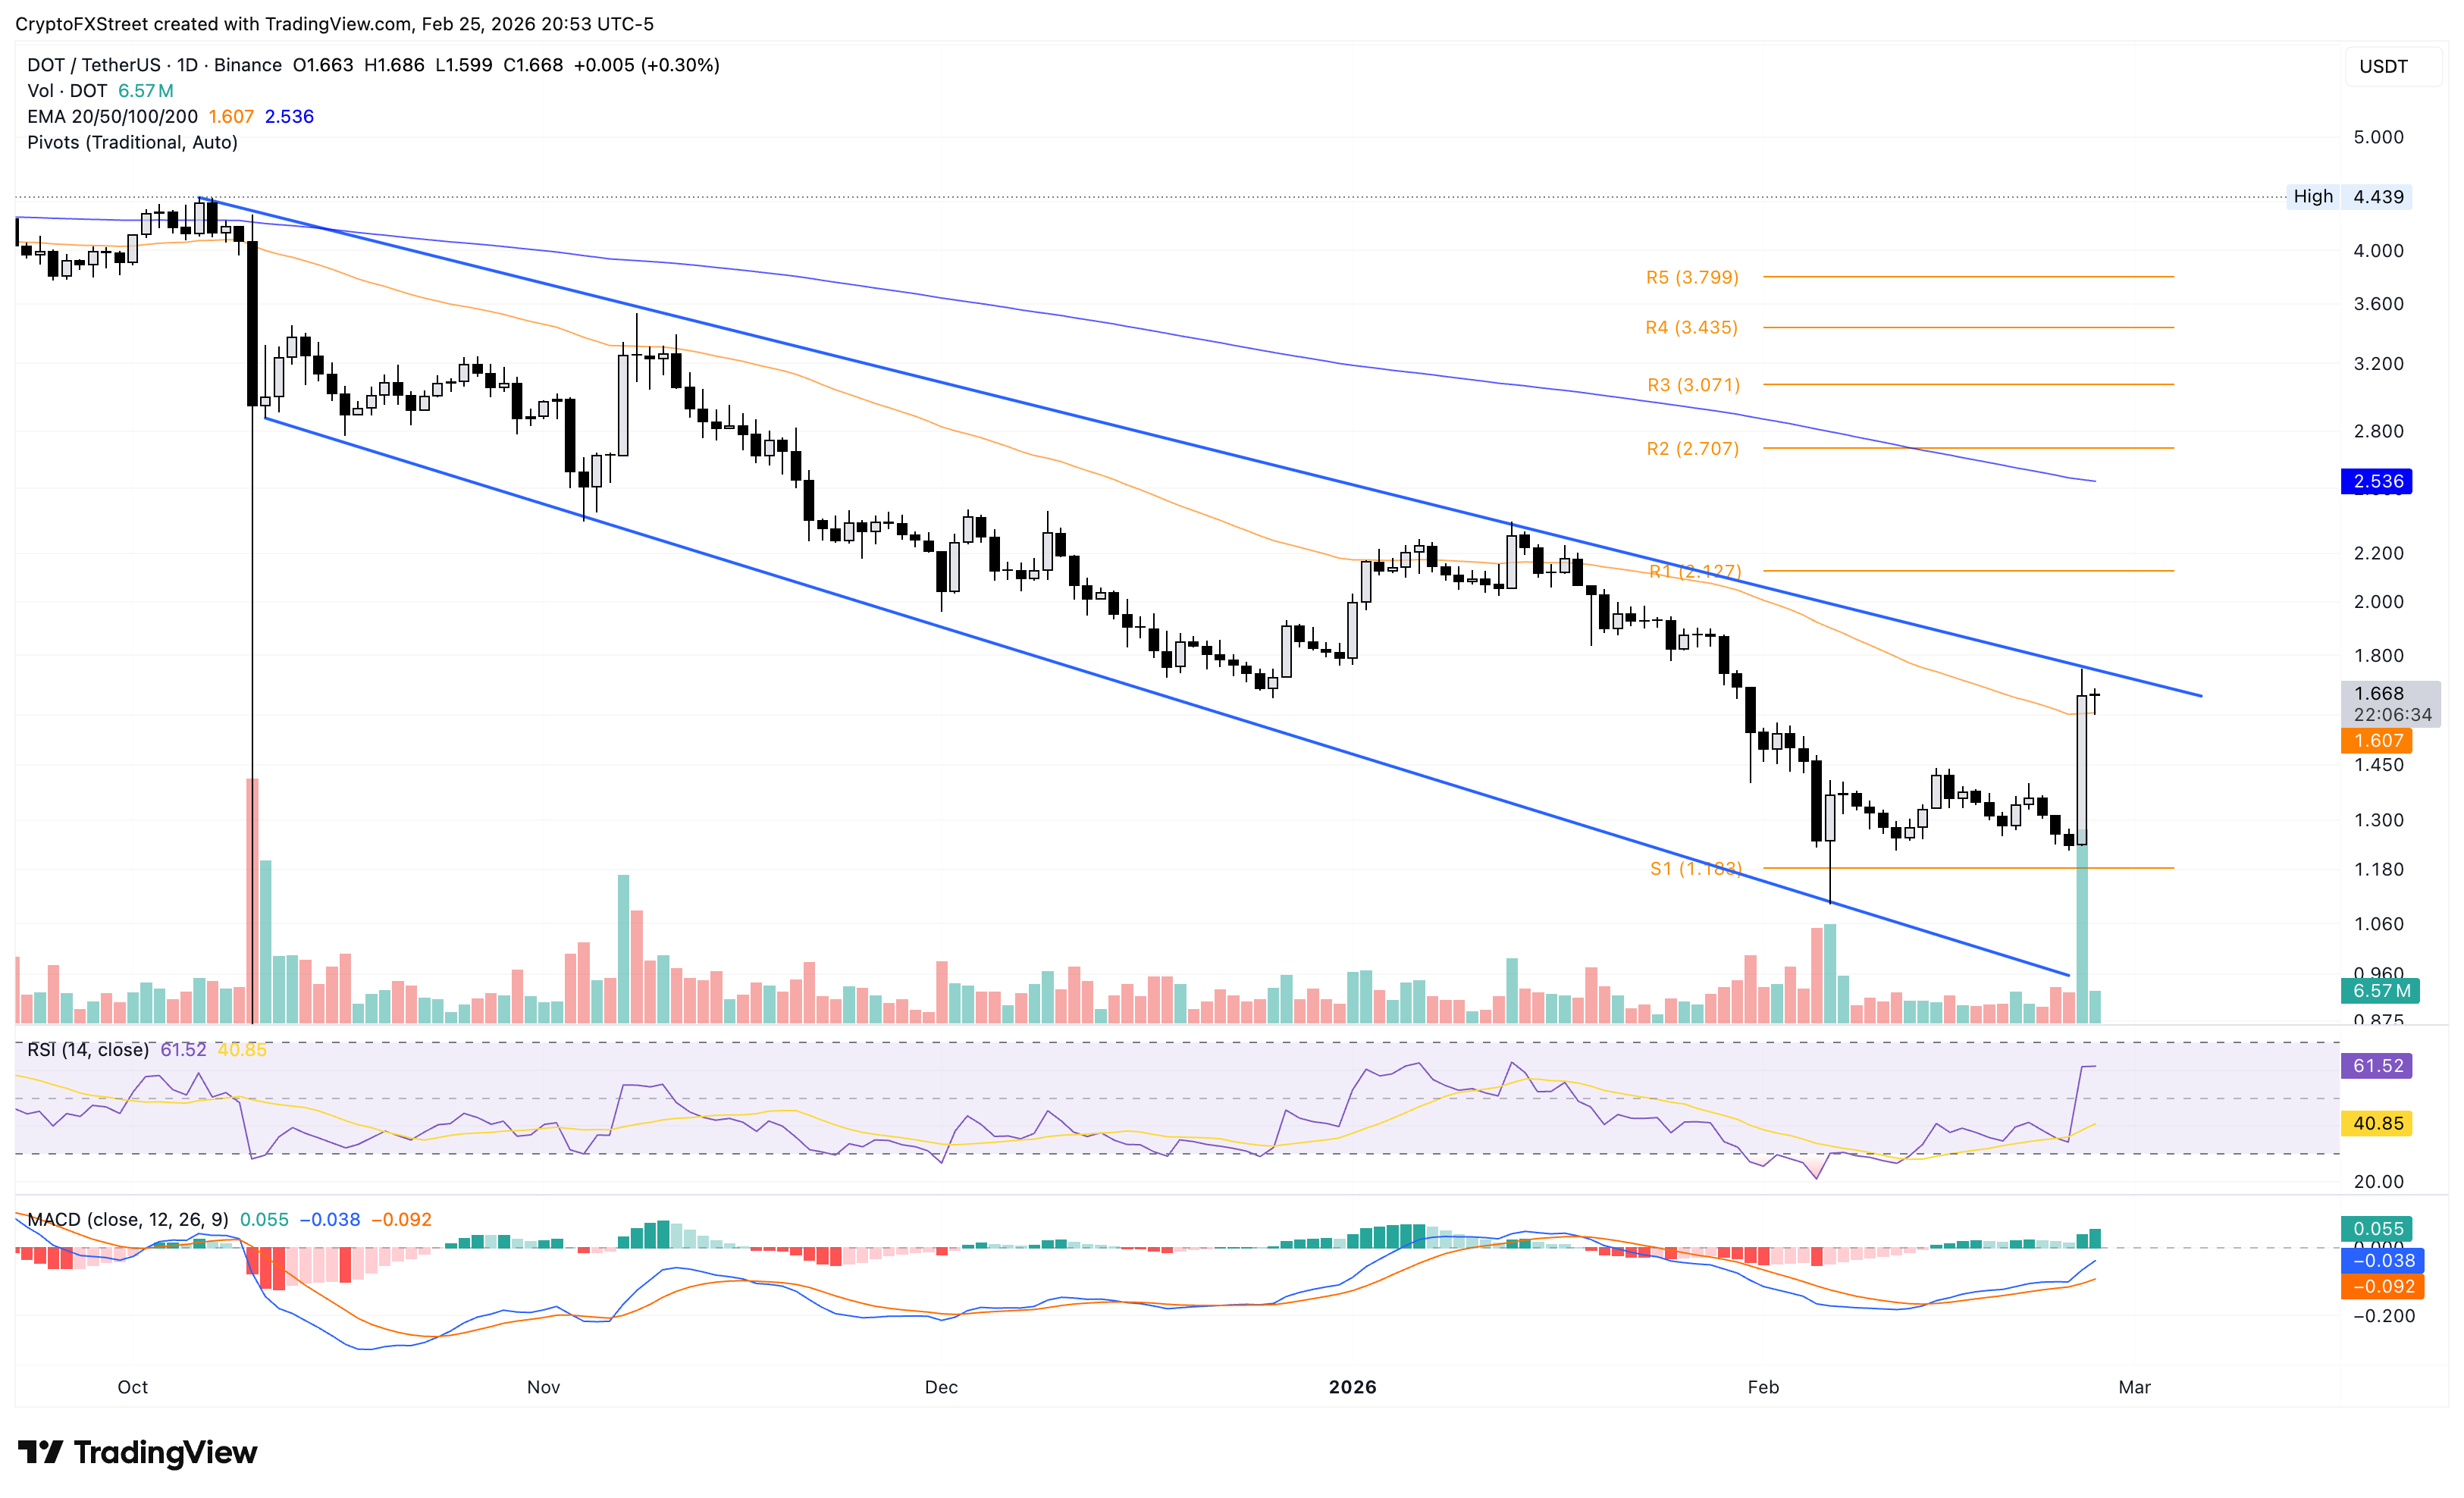
On the downside, immediate support is seen at the 50-day EMA at $1.60, with additional protection at the S1 Pivot Point at $1.18, a recent consolidation floor.
Near Protocol faces opposition at the 50-day EMA
Near Protocol reclaimed the $1.00 mark with a 21% rally on Wednesday. At the time of writing, NEAR is down 1% on Thursday, as the 50-day EMA at $1.25 capped the upcycle within a larger falling channel pattern.
The pair remains capped by a long-running descending resistance line that was last broken near 1.4580 but has since reasserted control, keeping price well below its prior swing area.
The 50-day and 200-day EMAs slope lower, framing an established bearish context. Still, a decisive close above the 50-day EMA at $1.25 could increase the chances of an upside breakout, targeting the R1 Pivot Point at $1.70.
The technical indicators on the daily suggest that momentum has improved but not inverted to bullish, as the MACD line remains above its signal line while both remain below the zero line, suggesting a rebound within a broader downtrend. The RSI at 53 remains neutral, but the recovery from oversold territory suggests reduced selling pressure.
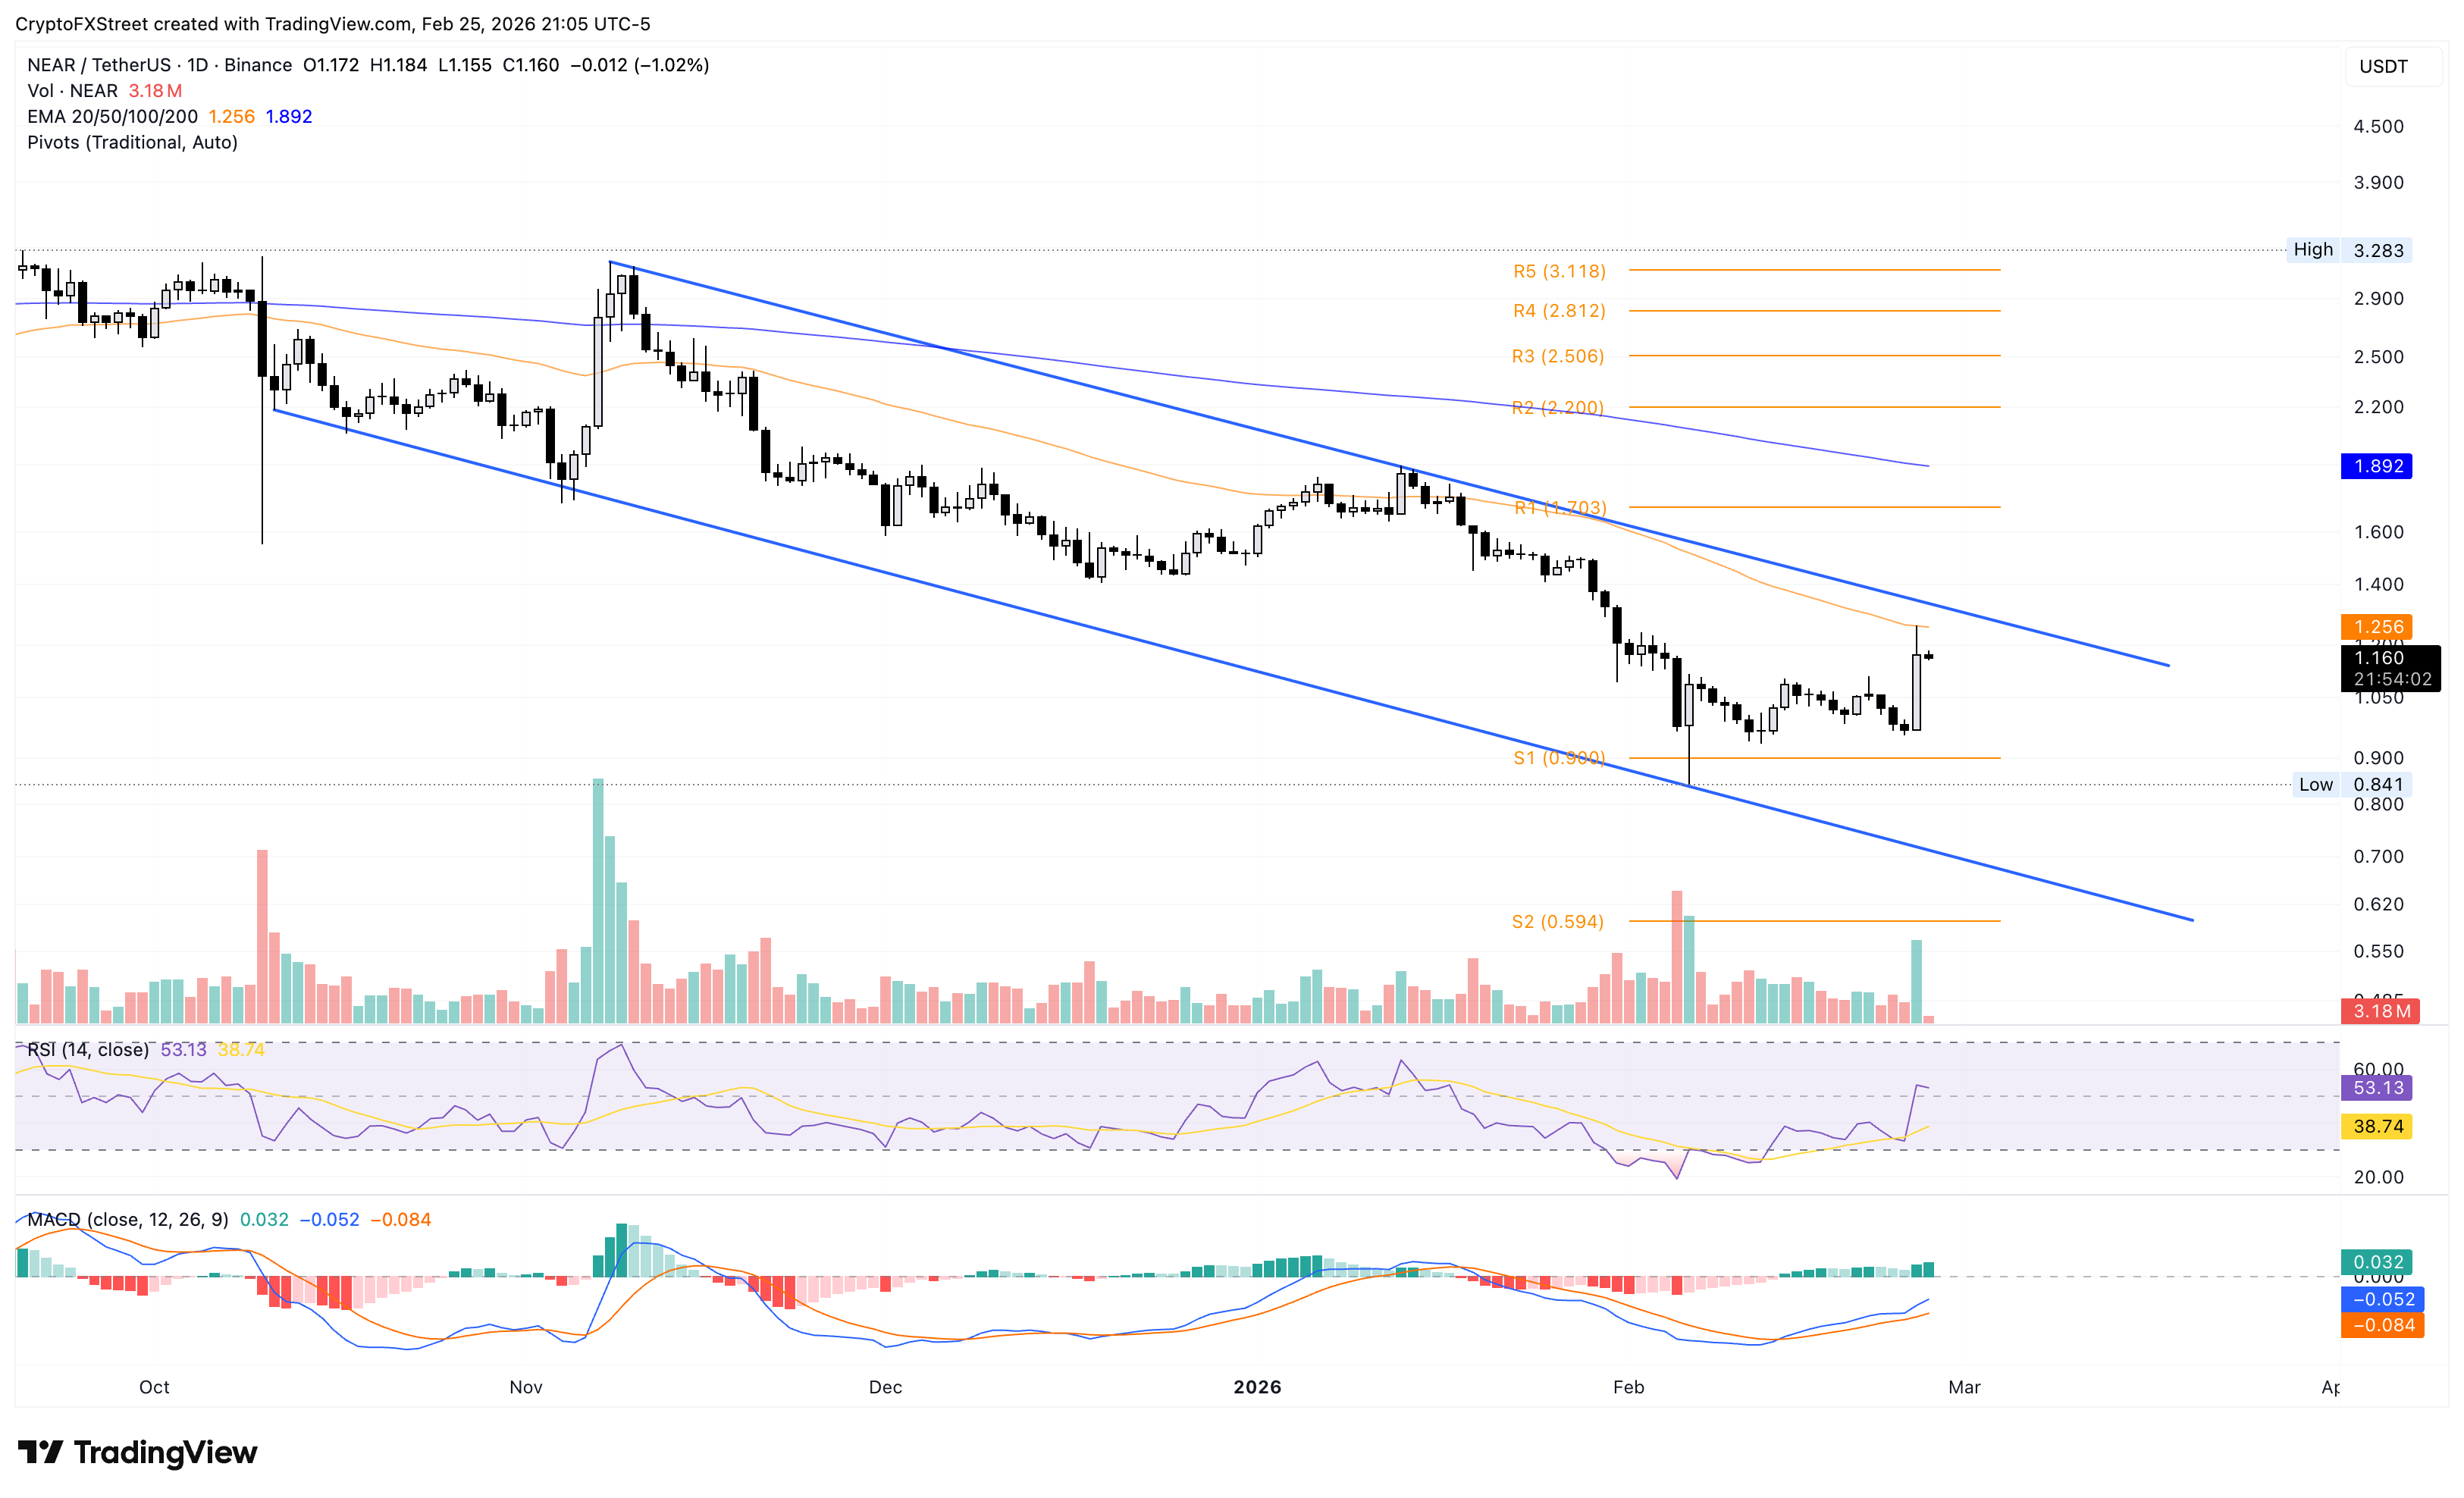
Looking down, immediate support stands at the $1.00 psychological support, followed by the S1 Pivot Point at $0.90.
Uniswap struggles to extend above $4
Uniswap hovers above $4.00 at press time on Thursday, sustaining the 21% rebound from Wednesday. The near-term bias turns mildly bullish after the rebound, but the declining 50-day exponential moving average at $4.18 caps the recovery.
The MACD and signal line are approaching positive territory, with a still-expanding positive histogram, suggesting increased bullish momentum. The RSI is at 57, holding above its midline with further upside before flashing overbought conditions.
If UNI secures a daily close above $4.18, it could target the $4.84 resistance level marked by the December 18 low.
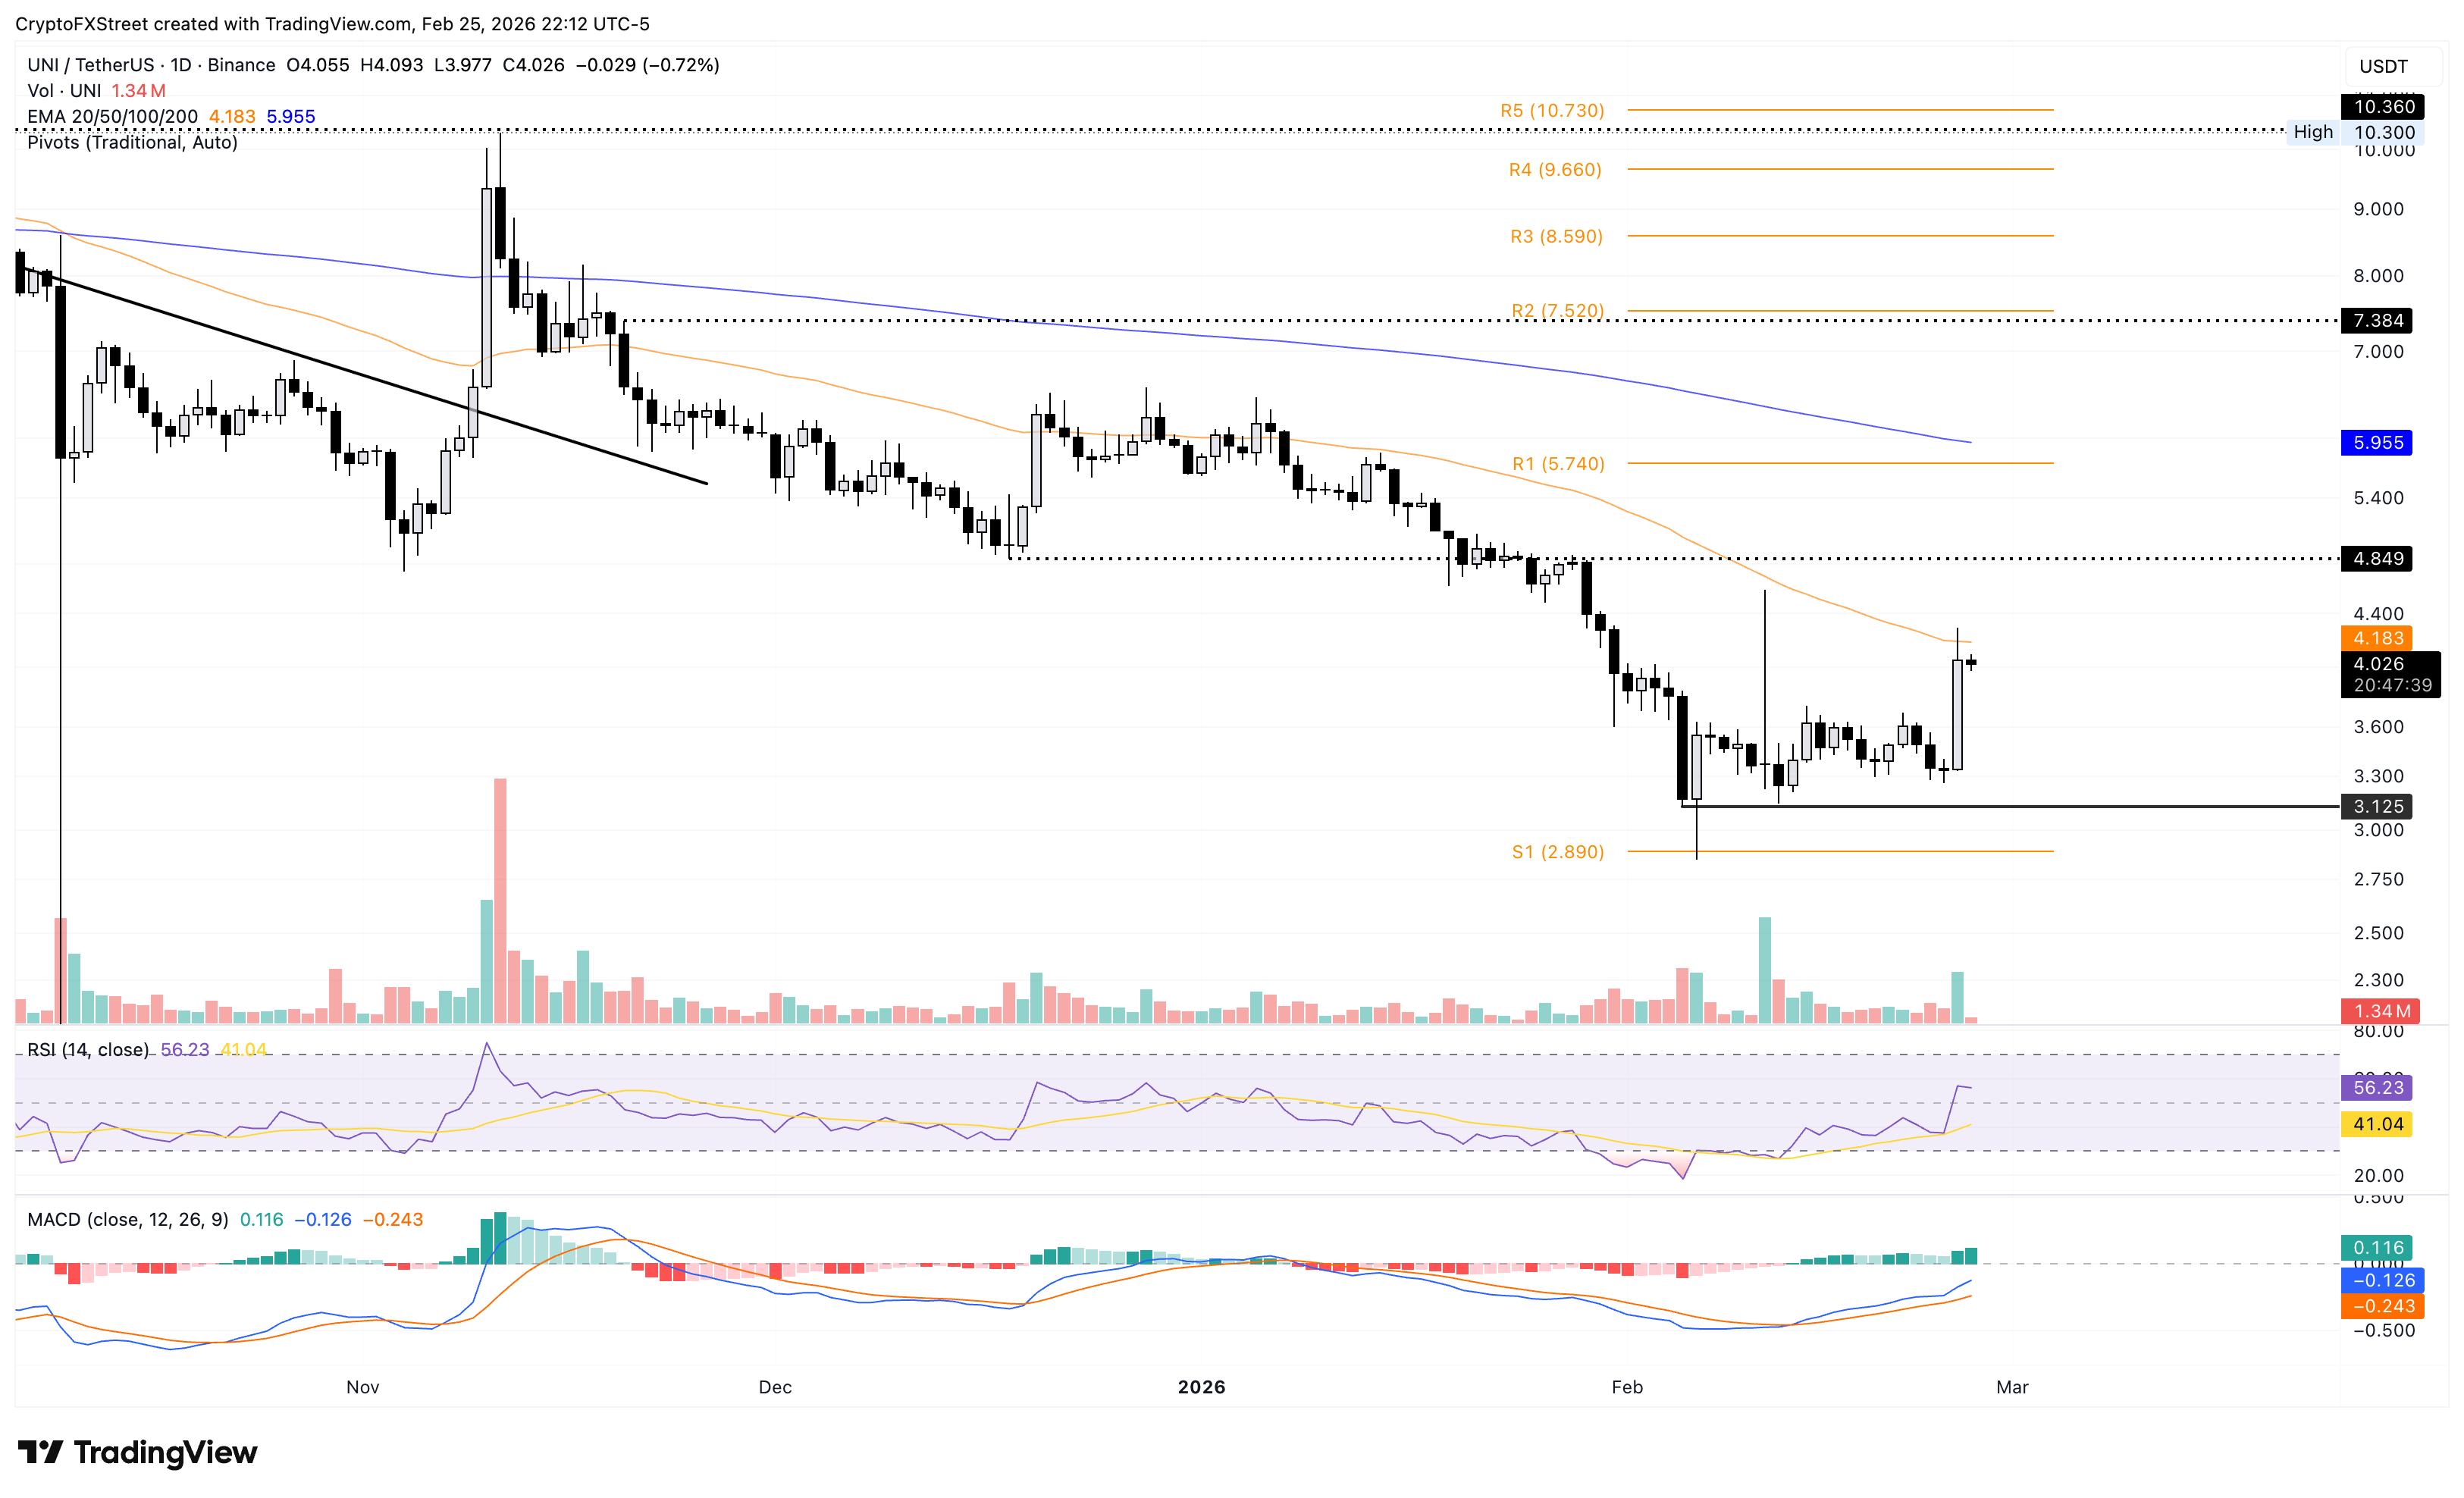
On the flip side, a reversal below $4.00 could expand the downside risk toward the February 5 low at $2.12.
(The technical analysis of this story was written with the help of an AI tool.)

Lebih sejuta pengguna bergantung pada FXStreet untuk data pasaran masa nyata, alat carta, pandangan pakar dan berita Forex. Kalendar ekonomi yang komprehensif dan webinar pendidikan mereka membantu pedagang kekal bermaklumat dan membuat keputusan yang dikira. FXStreet disokong oleh pasukan kira-kira 60 profesional di ibu pejabat Barcelona dan pelbagai wilayah global.
Baca Lagi


