
USD/CHF Price Forecast: Rally clears 200-day SMA, targets 0.8000
Oleh Christian Borjon Valencia
Dikemas kini: 30 Mar 2026


ARTIKEL POPULAR

The USD/CHF rallies for the fifth straight trading day, up by more than 0.14%, as buyers push the pair towards 0.8000 for the first time since late January 2026.
- USD/CHF extends rally, breaking above 200-day SMA resistance level.
- RSI approaches overbought territory, signaling strong bullish momentum persists.
- Break above 0.8000 opens path toward 0.8045 and 0.8124 levels.
The USD/CHF rallies for the fifth straight trading day, up by more than 0.14%, as buyers push the pair towards 0.8000 for the first time since late January 2026.
USD/CHF Price Forecast: Technical Outlook
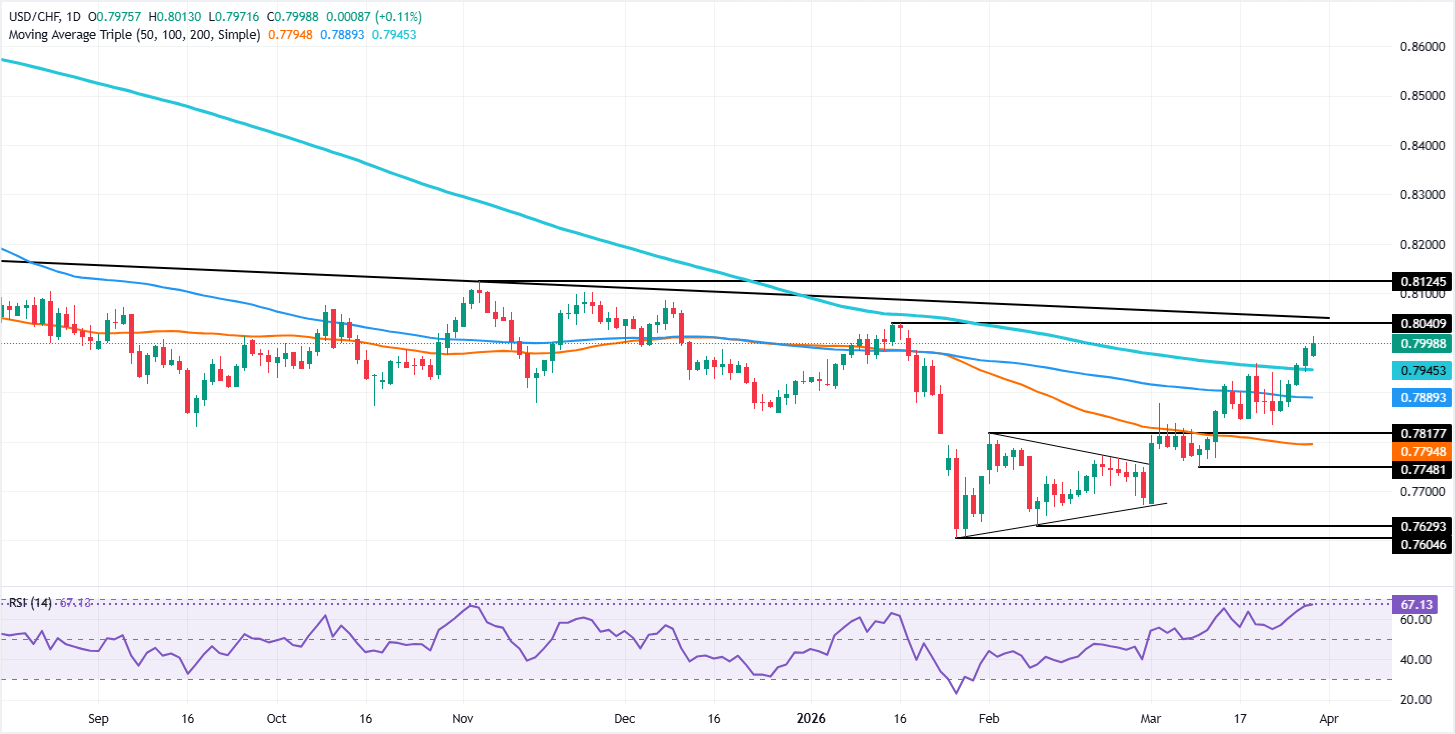
The technical picture turned constructive as USD/CHF cleared the 200-day SMA at 0.7945, opening the door to a test of the 0.80 figure. A clear break of the latter will put to the test a downslope resistance trendline drawn from around August’s 2025 highs that passes at around 0.8040-55.
If buyers clear that area, they could challenge the next area of interest past the 0.8100 mark at 0.8124, the November 5 swing high.
On the other hand, sellers must drag the USD/CHF spot price below 0.8000, so they can test the 200-day SMA at 0.0.7945. On further weakness, the next demand zone would be the 100-day SMA at 0.7889.
Momentum suggests that buyers are in charge, as depicted by the Relative Strength Index (RSI). Although approaching overbought territory, the index remains below the most extreme level at 80.
USD/CHF Price Chart – Daily
Swiss Franc Price This week
The table below shows the percentage change of Swiss Franc (CHF) against listed major currencies this week. Swiss Franc was the strongest against the New Zealand Dollar.
| USD | EUR | GBP | JPY | CAD | AUD | NZD | CHF | |
|---|---|---|---|---|---|---|---|---|
| USD | 0.38% | 0.58% | -0.30% | 0.31% | 0.29% | 0.62% | 0.42% | |
| EUR | -0.38% | 0.20% | -0.75% | -0.08% | -0.10% | 0.23% | 0.03% | |
| GBP | -0.58% | -0.20% | -0.88% | -0.28% | -0.30% | 0.03% | -0.21% | |
| JPY | 0.30% | 0.75% | 0.88% | 0.63% | 0.62% | 0.94% | 0.64% | |
| CAD | -0.31% | 0.08% | 0.28% | -0.63% | -0.06% | 0.30% | 0.07% | |
| AUD | -0.29% | 0.10% | 0.30% | -0.62% | 0.06% | 0.33% | 0.10% | |
| NZD | -0.62% | -0.23% | -0.03% | -0.94% | -0.30% | -0.33% | -0.24% | |
| CHF | -0.42% | -0.03% | 0.21% | -0.64% | -0.07% | -0.10% | 0.24% |
The heat map shows percentage changes of major currencies against each other. The base currency is picked from the left column, while the quote currency is picked from the top row. For example, if you pick the Swiss Franc from the left column and move along the horizontal line to the US Dollar, the percentage change displayed in the box will represent CHF (base)/USD (quote).

Lebih sejuta pengguna bergantung pada FXStreet untuk data pasaran masa nyata, alat carta, pandangan pakar dan berita Forex. Kalendar ekonomi yang komprehensif dan webinar pendidikan mereka membantu pedagang kekal bermaklumat dan membuat keputusan yang dikira. FXStreet disokong oleh pasukan kira-kira 60 profesional di ibu pejabat Barcelona dan pelbagai wilayah global.
Baca Lagi


