
Worldcoin Price Forecast: Soft recovery targets 50-day EMA amid global adoption
Oleh Vishal Dixit
Dikemas kini: 21 May 2026


ARTIKEL POPULAR

Worldcoin (WLD) edges above $0.2500 on Thursday, extending the 4% gains from the previous day amid World Network’s collaboration with Tinder, Zoom, and its Concert Kit tool in a European concert tour.
- Worldcoin is up 3% so far on Thursday, extending the rebound from a key support trendline.
- World’s collaboration with Tinder and Zoom, alongside the introduction of the Concert Kit tool in Europe, reflects demand for its proof-of-human network.
- The technical outlook is mildly bullish as WLD approaches the bearish confluence of the 50-day EMA at $0.2713 and a descending trendline.
Worldcoin (WLD) edges above $0.2500 on Thursday, extending the 4% gains from the previous day amid World Network’s collaboration with Tinder, Zoom, and its Concert Kit tool in a European concert tour. Still, the technical outlook is cautiously optimistic as the 50-day Exponential Moving Average (EMA) at $0.2713 threatens to cap the recovery.
Human-only demand for Tinder, Zoom, and European concerts
World Network, in collaboration with Tinder, has launched a Human Badge early experience in Shibuya, Japan. The event will serve as a testing ground with plans to scale globally. For a Human Badge on Tinder, users will require a verified World ID, potentially limiting non-human activity on the platform. Zoom has also partnered to reduce the spread of Deepfakes by verifying identities.
On the other hand, the Concert Kit tool by World enters the European market after a pilot phase in Latin America and a private venue in San Francisco, US. THIRTY SECONDS TO MARS will use the kit for selected shows in the United Kingdom and Germany during their 2027 tour so that only verified fans can reserve their tickets.

Technical outlook: Will WLD's recovery signal a broader trend reversal?
Worldcoin extends gains for the second straight day, extending a rebound from a declining support trendline. The WLD token is capped by a descending trendline at $0.2802, which completes a falling wedge pattern on the daily chart.
Meanwhile, the price remains under the 50-day and 200-day EMAs at $0.2713 and $0.4689, respectively, keeping a bearish near-term tone.
The Relative Strength Index (RSI) around 49 on the daily chart hints at merely stabilizing momentum rather than a bullish shift. However, the steady upward trend in RSI indicates a positive divergence, with the declining trendline supporting the price, typically signaling an upside move. At the same time, the Moving Average Convergence Divergence (MACD) hovers closer to its signal line for a potential bullish crossover, suggesting selling pressure is waning.
On the topside, initial resistance is located at the 50-day EMA near $0.2713, followed by the downtrend-line break area around $0.2802. A daily close above this band would be needed to ease the prevailing downside bias, with the 200-day EMA at $0.4689 marking a far more distant structural barrier.
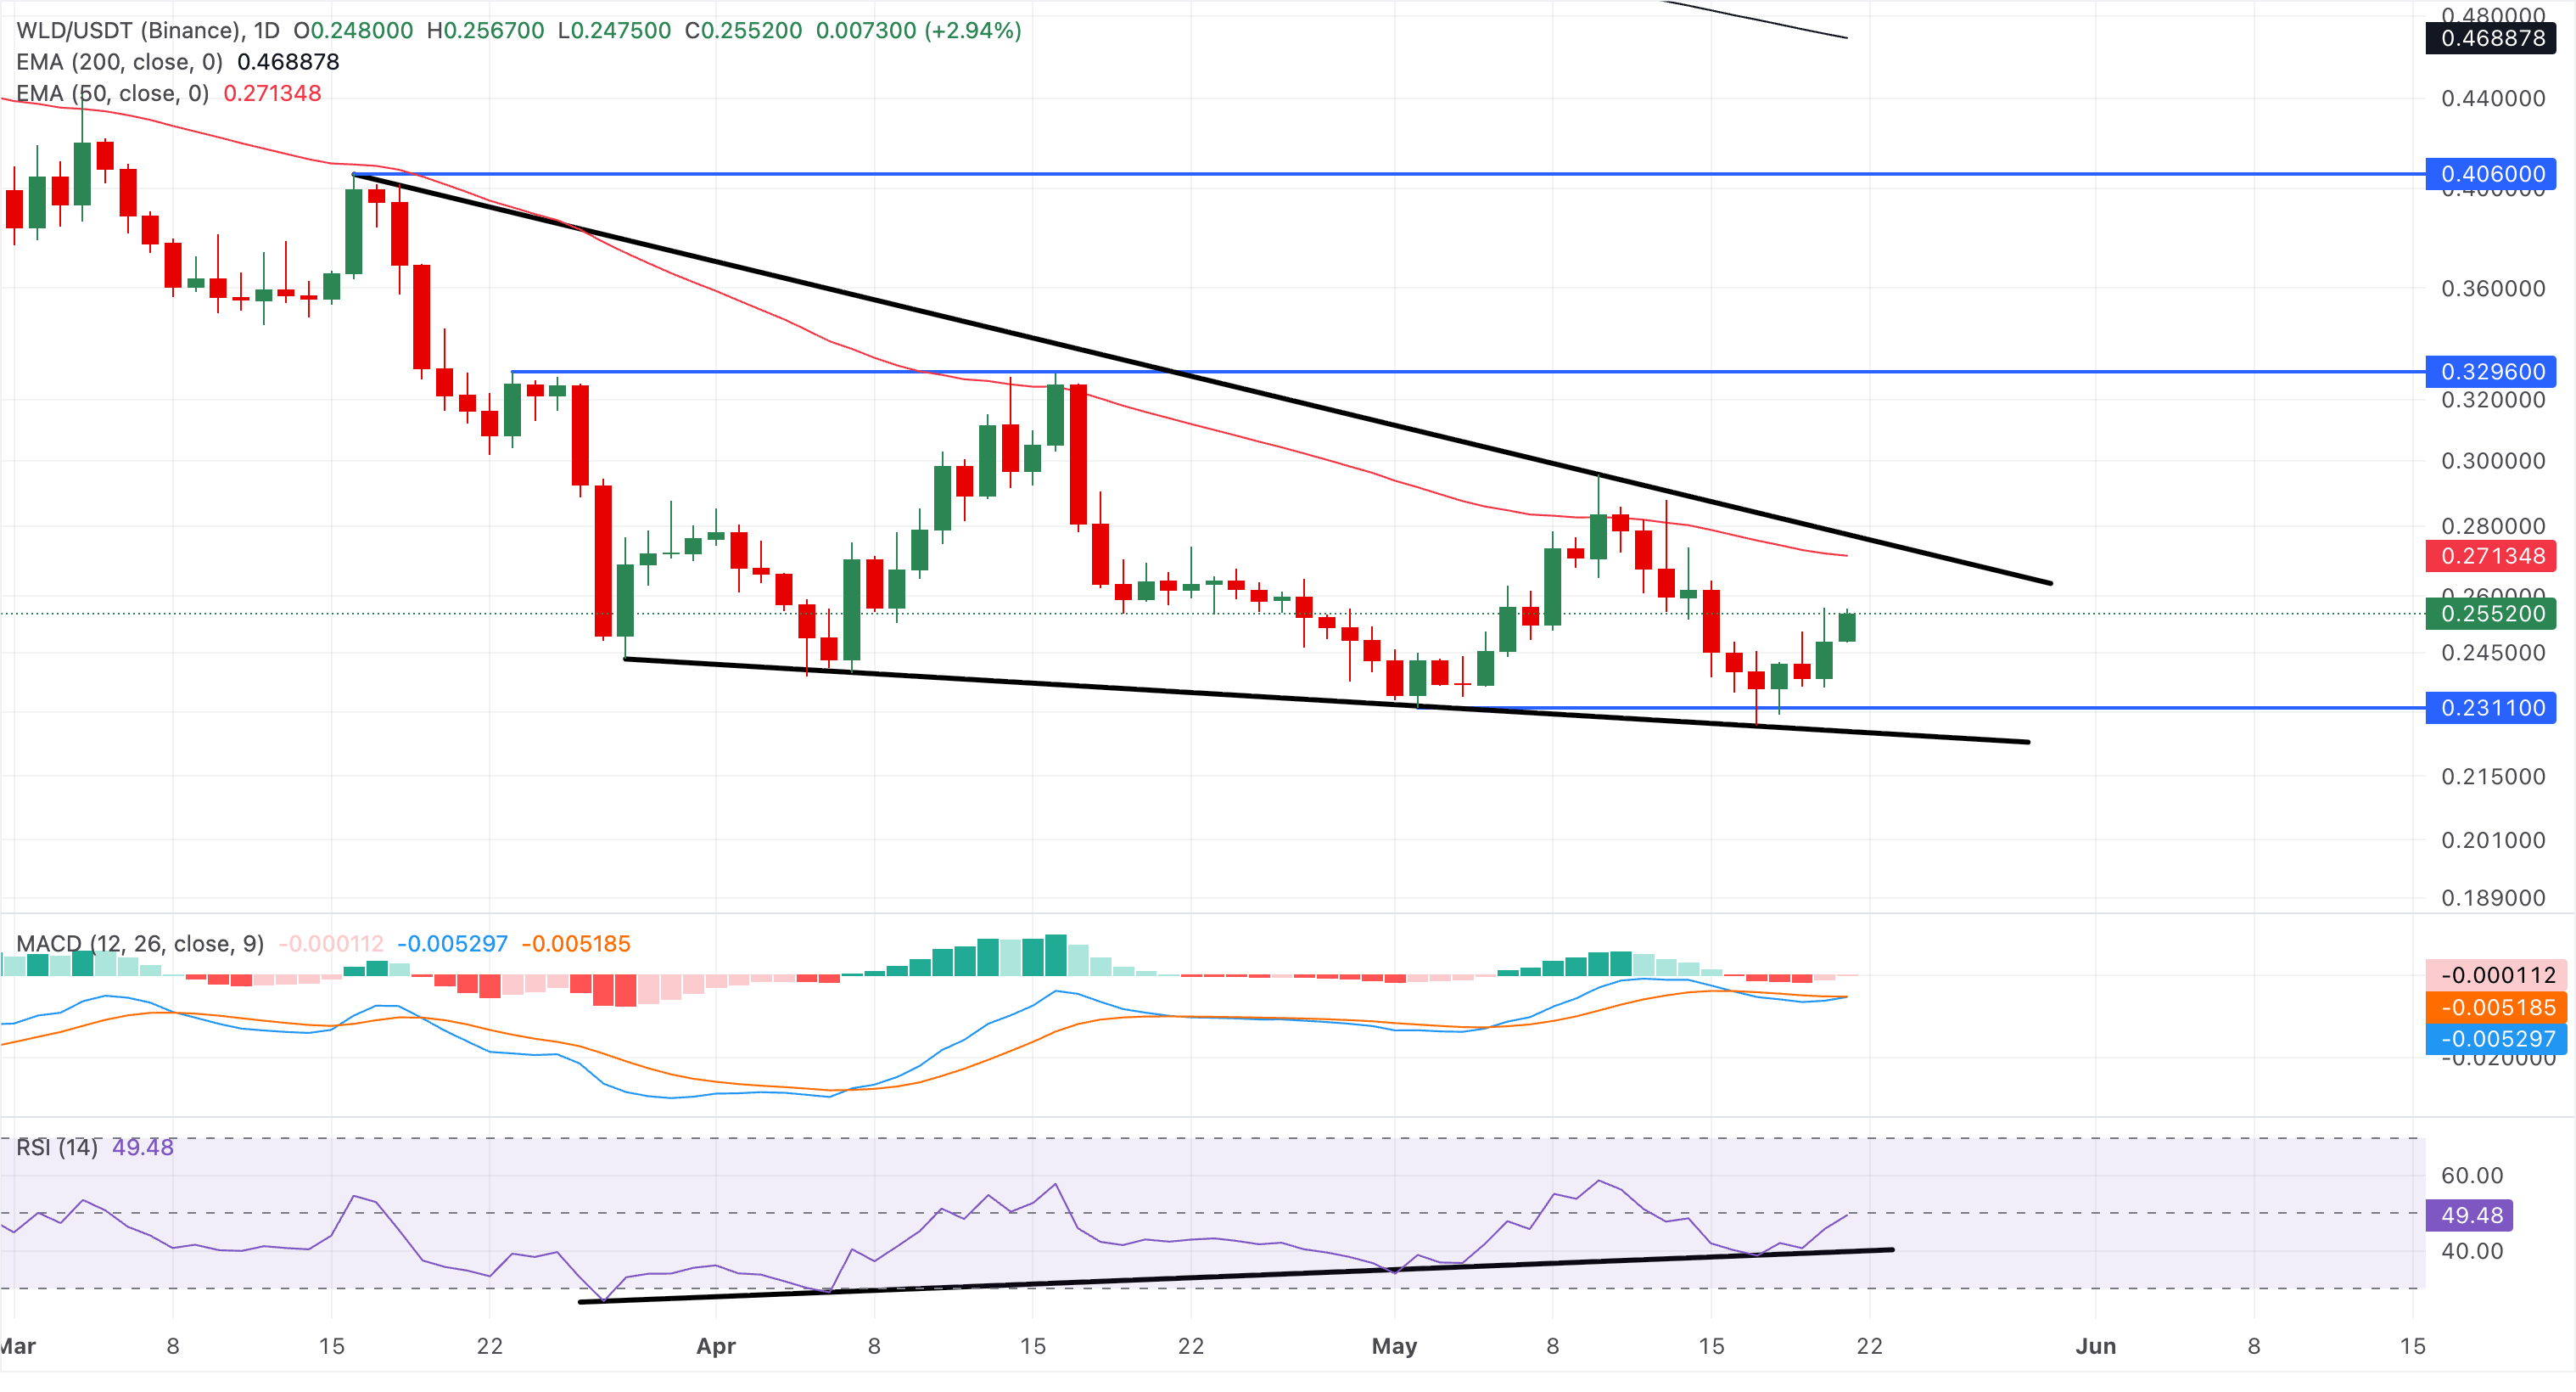
On the downside, the support trendline near $0.2246 remains a key support guarding against a bearish price discovery mode.
(The technical analysis of this story was written with the help of an AI tool.)

Lebih sejuta pengguna bergantung pada FXStreet untuk data pasaran masa nyata, alat carta, pandangan pakar dan berita Forex. Kalendar ekonomi yang komprehensif dan webinar pendidikan mereka membantu pedagang kekal bermaklumat dan membuat keputusan yang dikira. FXStreet disokong oleh pasukan kira-kira 60 profesional di ibu pejabat Barcelona dan pelbagai wilayah global.
Baca Lagi


