
XRP and XLM outlook: Mixed sentiment with a slight bullish tilt as key resistance levels come into focus
Oleh Manish Chhetri
Dikemas kini: 14 Apr 2026


ARTIKEL POPULAR

Ripple (XRP) and Stellar (XLM) are approaching key technical levels on Tuesday after a slight rebound the previous day. On-chain and derivatives metrics for XRP and XLM reflect mixed market sentiment with a slight bullish tilt.
- XRP price near the 50-day EMA at $1.40, a firm close above suggests a recovery move ahead.
- XLM price approaches the descending trendline on Tuesday, where a breakout suggests an upside move on the horizon.
- On-chain and derivatives data show mixed sentiment, though with a slight bullish bias.
Ripple (XRP) and Stellar (XLM) are approaching key technical levels on Tuesday after a slight rebound the previous day. On-chain and derivatives metrics for XRP and XLM reflect mixed market sentiment with a slight bullish tilt. Meanwhile, a firm close above these key technical resistances could set the stage for a potential breakout in these altcoins if buying momentum strengthens.
Mixed sentiment with a slight bullish bias
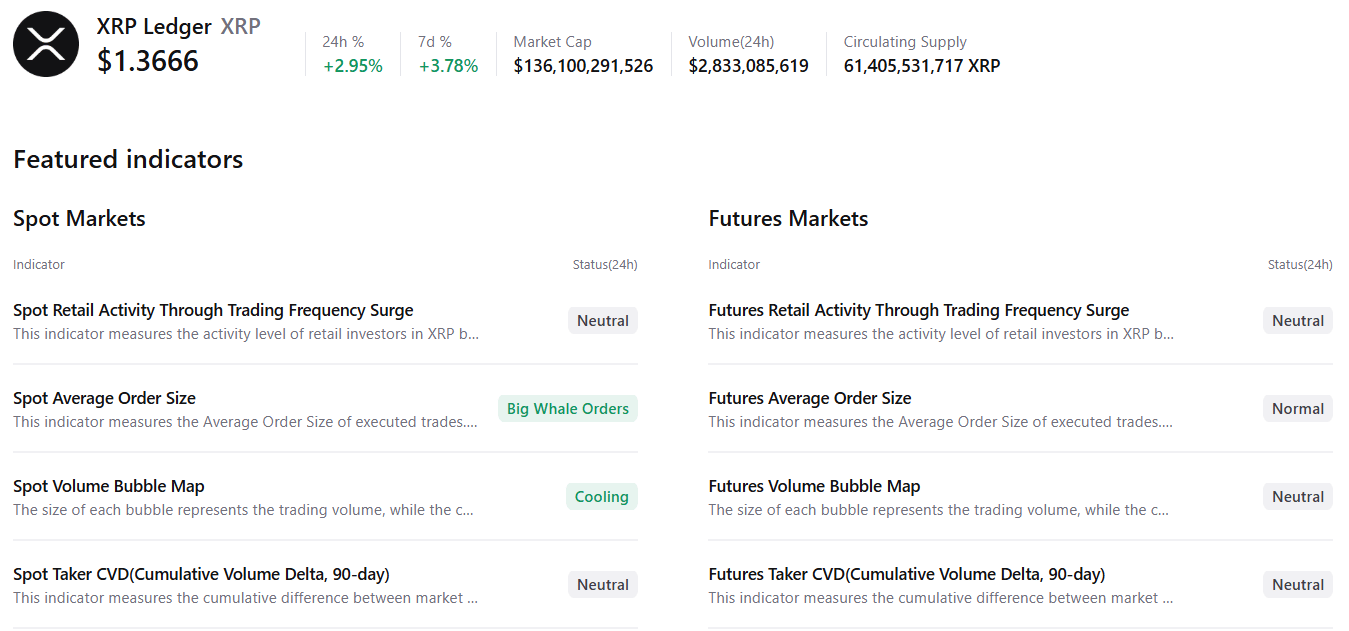
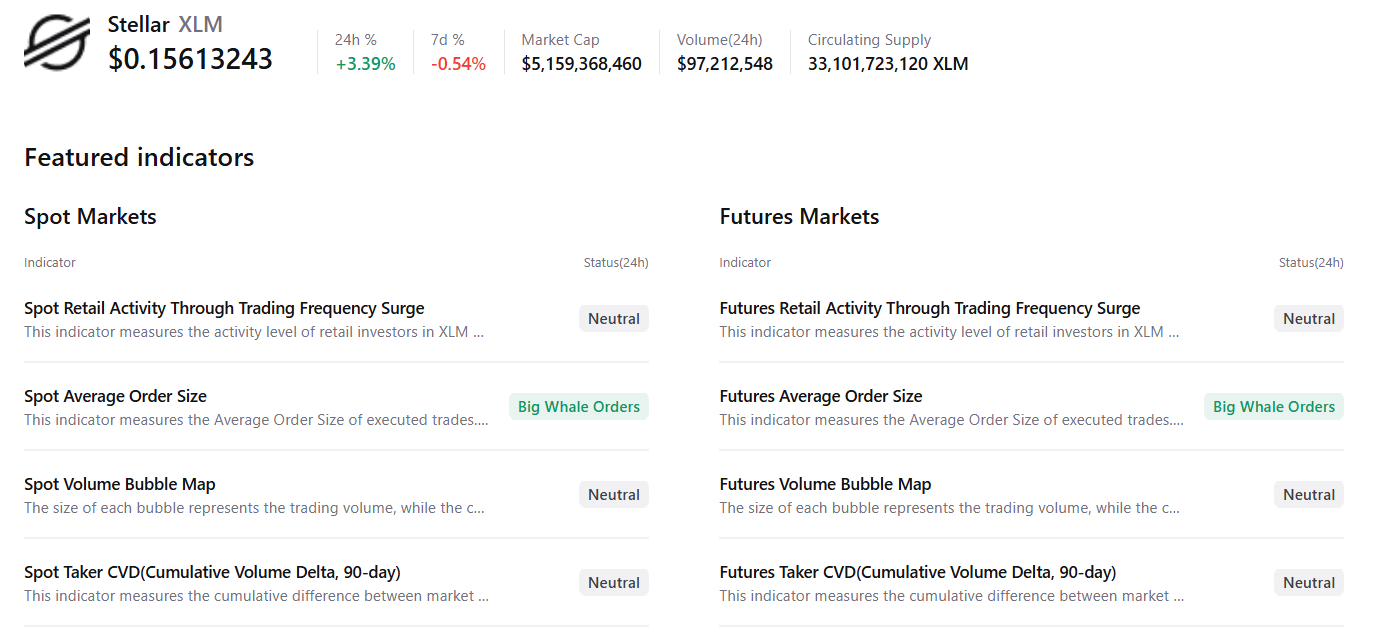
CryptoQuant summary data suggests a slight bullish outlook for XRP and XLM.
XRP’s spot markets show large whale orders and cooling conditions, with mostly neutral conditions across other metrics, suggesting a potential upside move.
Similarly, for XLM, spot and futures markets show large whale orders under mostly neutral conditions across other metrics, suggesting a bullish outlook.
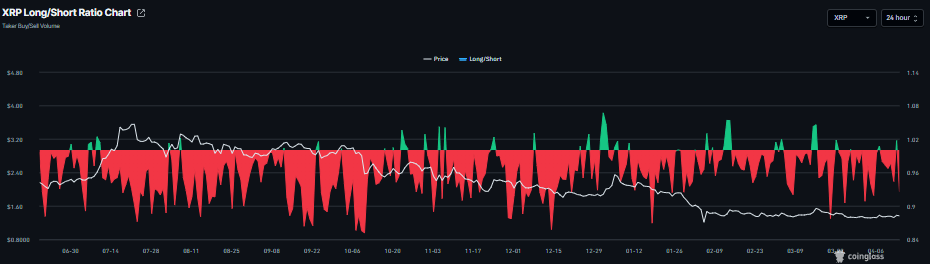
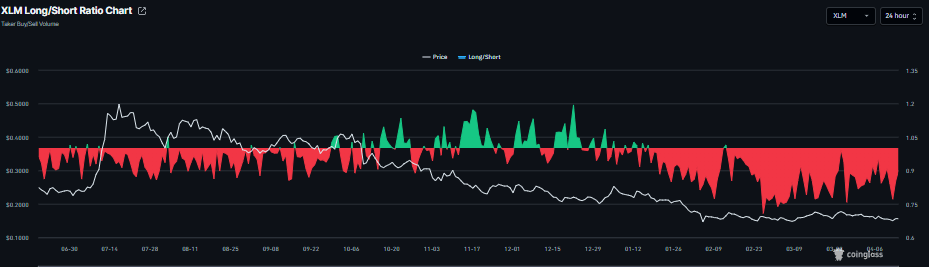
On the derivatives side, Ripple and Stellar data show mixed sentiment. CoinGlass’ long-to-short ratio for XRP and XLM reads 0.92 and 0.89, respectively. This ratio, being below one, reflects bearish sentiment in the market, as more traders are betting on the asset’s price to fall.
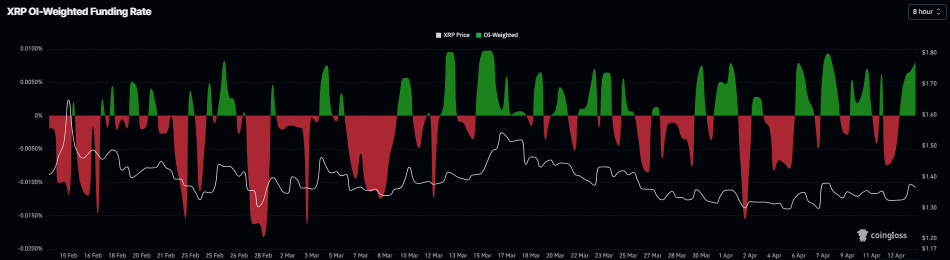
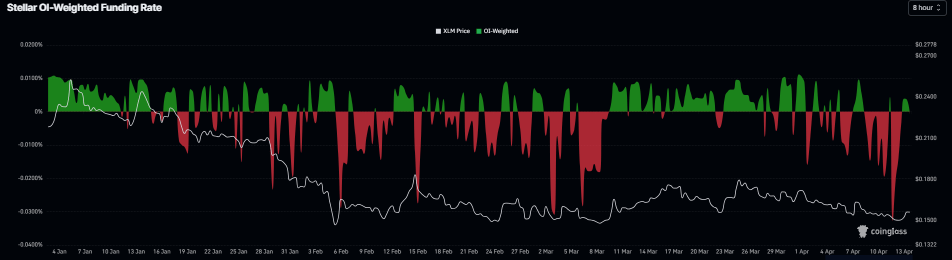
Meanwhile, the funding rates support improving sentiment. CoinGlass’ OI-Weighted Funding Rate data for XRP and Stellar flipped positive on Monday, reading 0.0081% and 0.0035% on Tuesday, respectively. This positive rate indicates that longs are paying shorts and projecting a bullish sentiment.
This combination suggests indecision among XRP and Stellar investors with a mid-bullish bias, which limits the chances of a sustained recovery.
XRP technical outlook: Near key 50-day EMA resistance
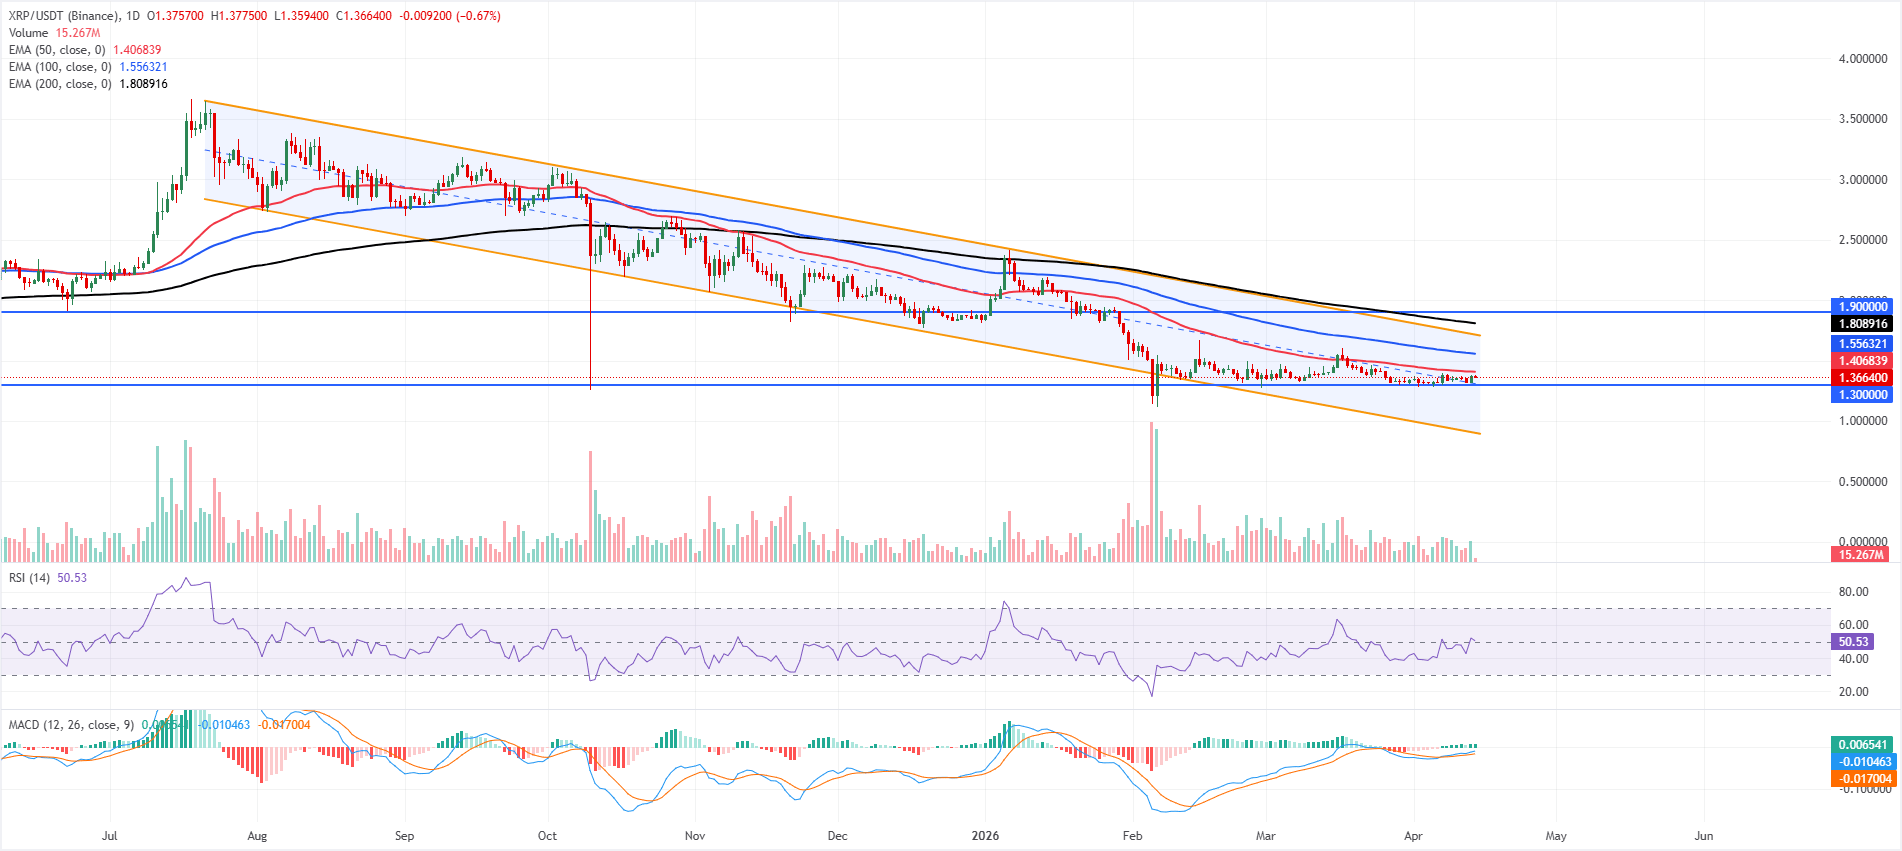
XRP price trades at $1.36 on Tuesday after rebounding nearly 4% in the previous day. XRP is maintaining a capped tone as it holds within a broader downward parallel channel and below the 50-day, 100-day and 200-day Exponential Moving Averages (EMAs).
XRP has bounced off recent lows but still trades under the nearby 50-day EMA at $1.40, keeping recovery attempts corrective for now. Momentum is mixed but slightly constructive, with the Relative Strength Index (RSI) on the daily chart hovering just above the 50 line and the Moving Average Convergence Divergence (MACD) turning positive above the zero line, which hints at easing downside pressure rather than a clear bullish reversal while price remains trapped beneath these EMAs.
On the topside, immediate resistance emerges at the 50-day EMA near $1.40; a decisive daily close above this level would open the way toward the 100-day EMA around $1.55, ahead of the channel’s upper boundary near $1.71 and the more distant 200-day EMA at $1.80, with horizontal resistance higher up at $1.90.
On the downside, initial support is seen at the horizontal floor around $1.30, and a break below that level would expose the lower boundary of the descending channel near $0.89, where medium-term buyers could attempt to rebuild a base.
XLM technical outlook: Approaching descending trendline
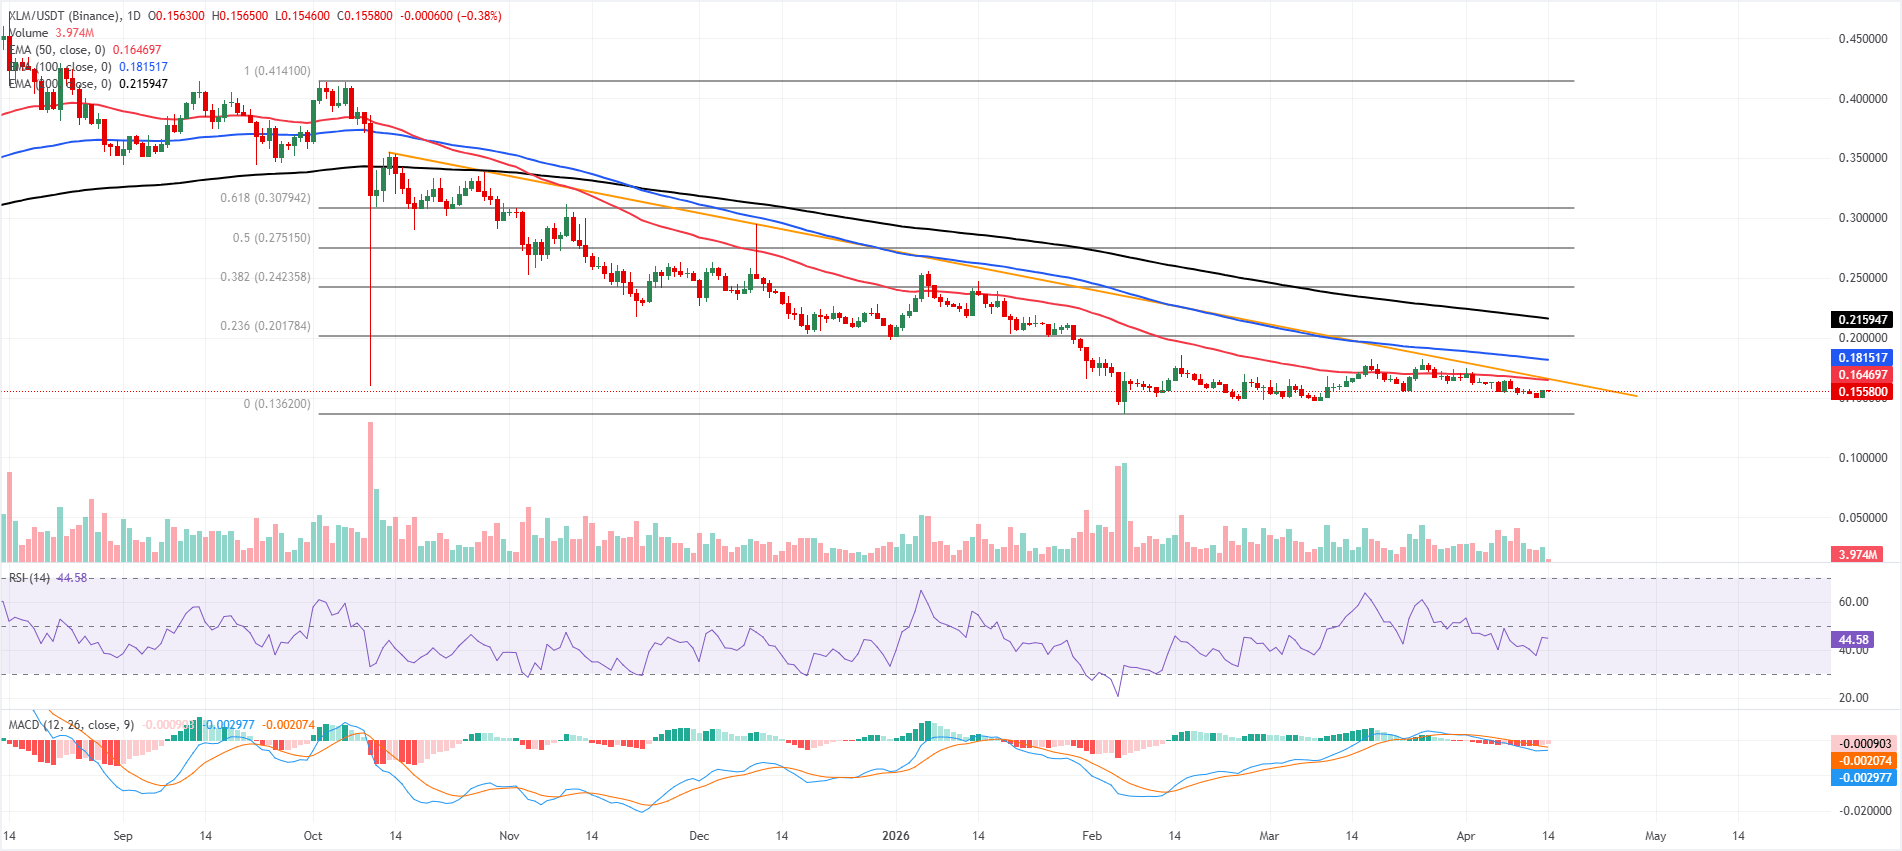
XLM price is trading at $0.156 on Tuesday, after rebounding by over 4% the previous day. XLM is holding in a bearish configuration below the 50-day, 100-day and 200-day EMAs at $0.164, $0.181 and $0.215, respectively. The failed break of the descending trendline, with its break level now at $0.165, reinforces overhead pressure, while a subdued RSI on the daily chart around 45 and a slightly negative MACD histogram hint that downside momentum is still present but not aggressive.
On the upside, initial resistance is clustered around the 50-day EMA at $0.164 and the former descending trendline break level at $0.165; a daily close above this band would be needed to ease immediate pressure. Further hurdles are seen at the 100-day EMA near $0.181, followed by the 23.6% Fibonacci retracement of the broader downswing at $0.201 and the 200-day EMA at $0.215.
On the downside, the key structural support sits near the Fibonacci anchor around $0.136, where buyers would be expected to defend the broader base if selling resumes.
(The technical analysis of this story was written with the help of an AI tool.)

Lebih sejuta pengguna bergantung pada FXStreet untuk data pasaran masa nyata, alat carta, pandangan pakar dan berita Forex. Kalendar ekonomi yang komprehensif dan webinar pendidikan mereka membantu pedagang kekal bermaklumat dan membuat keputusan yang dikira. FXStreet disokong oleh pasukan kira-kira 60 profesional di ibu pejabat Barcelona dan pelbagai wilayah global.
Baca Lagi


