
Zcash price extends correction as derivatives turn bearish and profit‑taking weighs
Oleh Manish Chhetri
Dikemas kini: 17 Apr 2026


ARTIKEL POPULAR

Zcash (ZEC) is extending its pullback, trading below $335 on Friday after losing over 8% so far this week. Weakening derivatives metrics support a bearish bias for the privacy-focused coin.
- Zcash price extends its correction, trading below $335 on Friday after losing over 8% so far this week.
- Derivatives data support a bearish outlook, with declining retail interest and rising short positions among traders.
- Traders should remain cautious, as the risk of an extended pullback persists following last week’s 47% rally, with profit-taking likely underway.
Zcash (ZEC) is extending its pullback, trading below $335 on Friday after losing over 8% so far this week. Weakening derivatives metrics support a bearish bias for the privacy-focused coin. Traders should remain cautious as correction risks persist after last week’s sharp rally, with rising profit-taking potentially triggering a short-term sell-off.
Derivatives data show a bearish bias
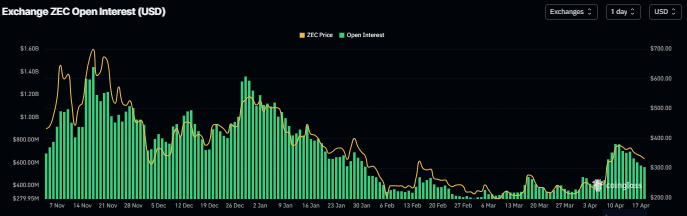
Zcash’s Open Interest (OI) has been continuously declining over the past week, dropping to $560.82 million on Friday from $763.86 million on April 10. This steadily decreasing OI amid a falling price suggests long positions are exiting the market (after a massive price rally last week), indicating a short-term bearish bias and weakening trader participation.
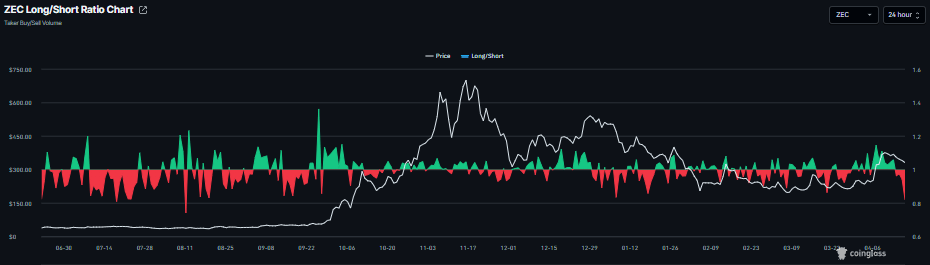
In addition, ZEC’s long-to-short ratio suggests a short-term bearish bias, currently standing at 0.82 on Friday, at levels not seen since January. The ratio below one indicates a bearish sentiment as more traders are betting on the ZEC price to fall.
Zcash Price Forecast: ZEC faces a correction
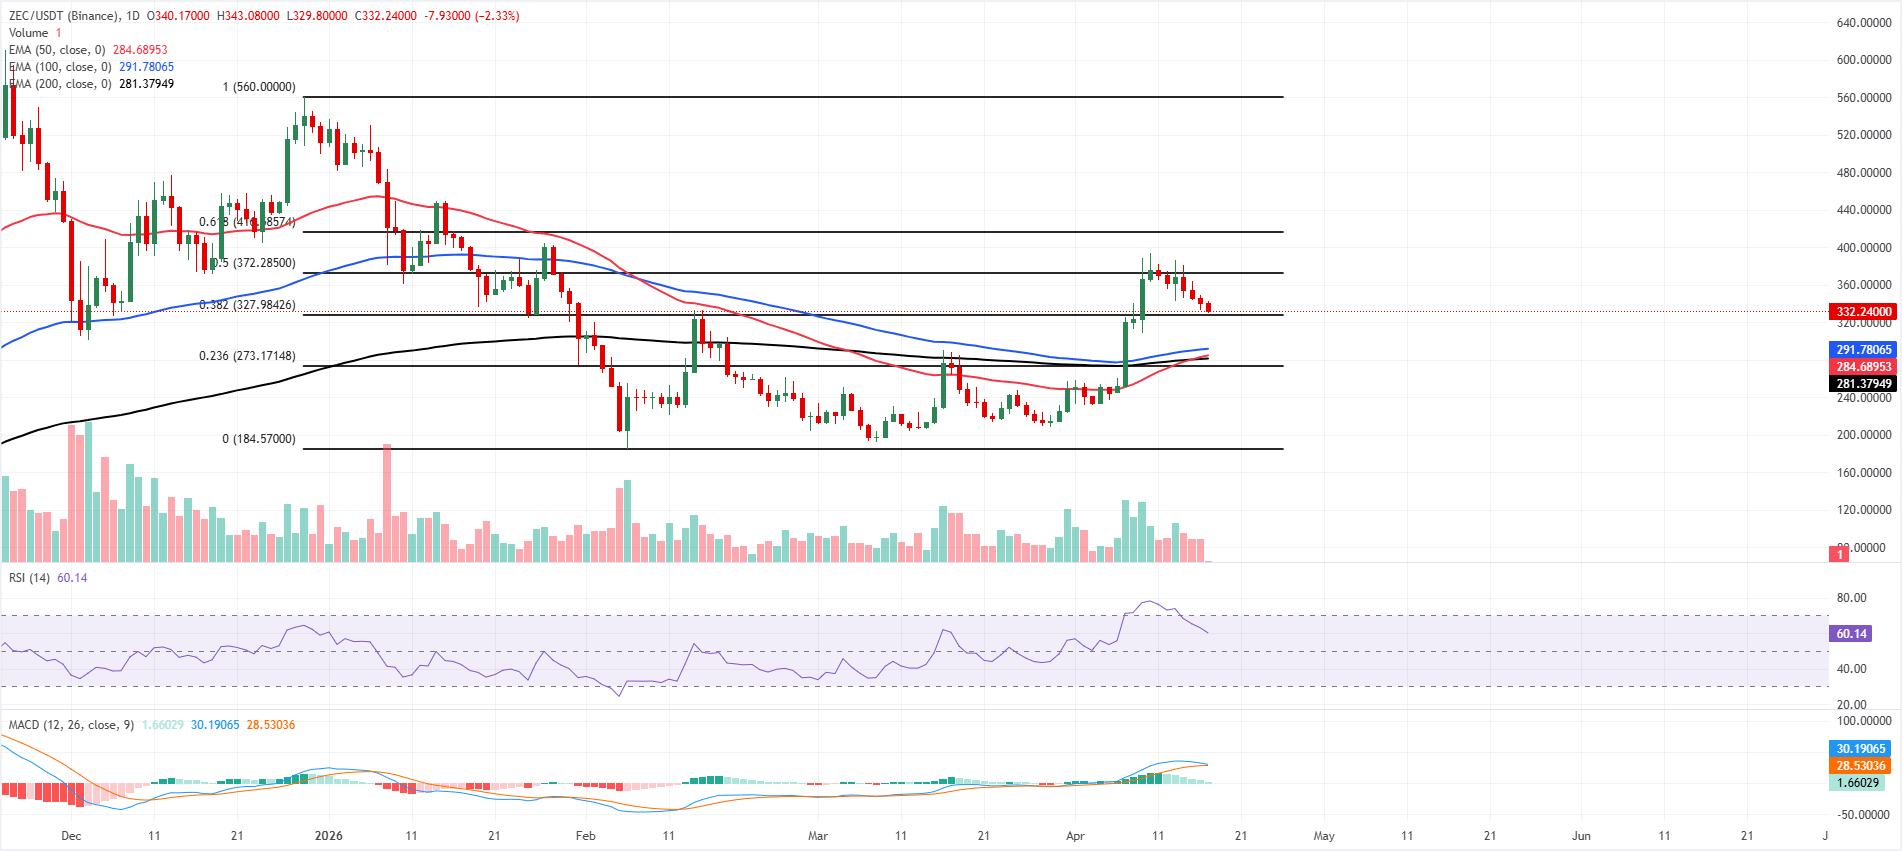
Zcash price extends its correction, trading below $333 on Friday, losing over 8% so far this week. The price action suggests ZEC is holding a constructive bullish bias as price extends above the 50-day, 100-day, and 200-day Exponential Moving Averages (EMAs), which are clustered between roughly $281 and $292. However, the massive rally last week suggests traders may be profit-taking, which could fuel a short-term price pullback.
The Fibonacci 38.2% Fibonacci retracement from the December 19 high to the February 6 low, at $327.98, now acts as immediate underlying support, while a still-elevated Relative Strength Index (RSI) in the daily chart near 60 and a positive but fading Moving Average Convergence Divergence (MACD) histogram hint that upside momentum is moderating rather than reversing.
On the downside, initial support is seen at the $327.98 Fibonacci 38.2% retracement, with the 100-day EMA at $291.78, the 50-day EMA at $284.69 and the 200-day EMA at $281.38 reinforcing a broader demand band ahead of deeper Fibonacci support at $273.17 and the cycle low around $184.57.
On the topside, the next resistance is at $372.29, the 50% retracement, followed by the 61.8% Fibonacci retracement at $416.59, the 78.6% Fibonacci retracement at $479.66, and the $500 psychological level, where profit-taking could intensify if the current advance extends.
(The technical analysis of this story was written with the help of an AI tool.)

Lebih sejuta pengguna bergantung pada FXStreet untuk data pasaran masa nyata, alat carta, pandangan pakar dan berita Forex. Kalendar ekonomi yang komprehensif dan webinar pendidikan mereka membantu pedagang kekal bermaklumat dan membuat keputusan yang dikira. FXStreet disokong oleh pasukan kira-kira 60 profesional di ibu pejabat Barcelona dan pelbagai wilayah global.
Baca Lagi


