
Trade The World
BNB Price Forecast: Bearish flag flashes downside risk as revenue, DEXs volume tumble
Oleh Vishal Dixit
Tarikh Diterbitkan: 29 Oct 2025 | Tarikh Diubah: 29 Oct 2025


POPULAR ARTICLES

BNB, previously known as Binance Coin, is trading near $1,100 at press time on Wednesday, following a 3% drop the previous day. The declining network activity on the BNB chain ecosystem and the nearly 5% drop in futures Open Interest indicate low demand.
- BNB tests the $1,100 mark after Tuesday's 3% decline, risking a potential downside breakout of a bearish flag pattern.
- A steady decrease in DEXs' volume and chain revenue indicates low on-chain demand.
- The retail sentiment surrounding BNB tilts bearish, betting on further losses.
BNB, previously known as Binance Coin, is trading near $1,100 at press time on Wednesday, following a 3% drop the previous day. The declining network activity on the BNB chain ecosystem and the nearly 5% drop in futures Open Interest indicate low demand.
From a technical perspective, BNB risks further losses if it breaks below the 200-period Exponential Moving Average (EMA) on the 4-hour chart, confirming a bearish flag breakout.
Retail, on-chain demand for BNB cools off
The BNB Chain is experiencing a network activity cooldown, denoting reduced on-chain demand. Typically, when a network fails to generate high volumes or revenue, it indicates low demand or outflows to other networks.
According to DeFiLlama, the Decentralized Exchanges' (DEXs) volume has dropped to $2.584 billion on Tuesday, from the October 8 high of $6.313 billion, indicating low on-chain liquidity.
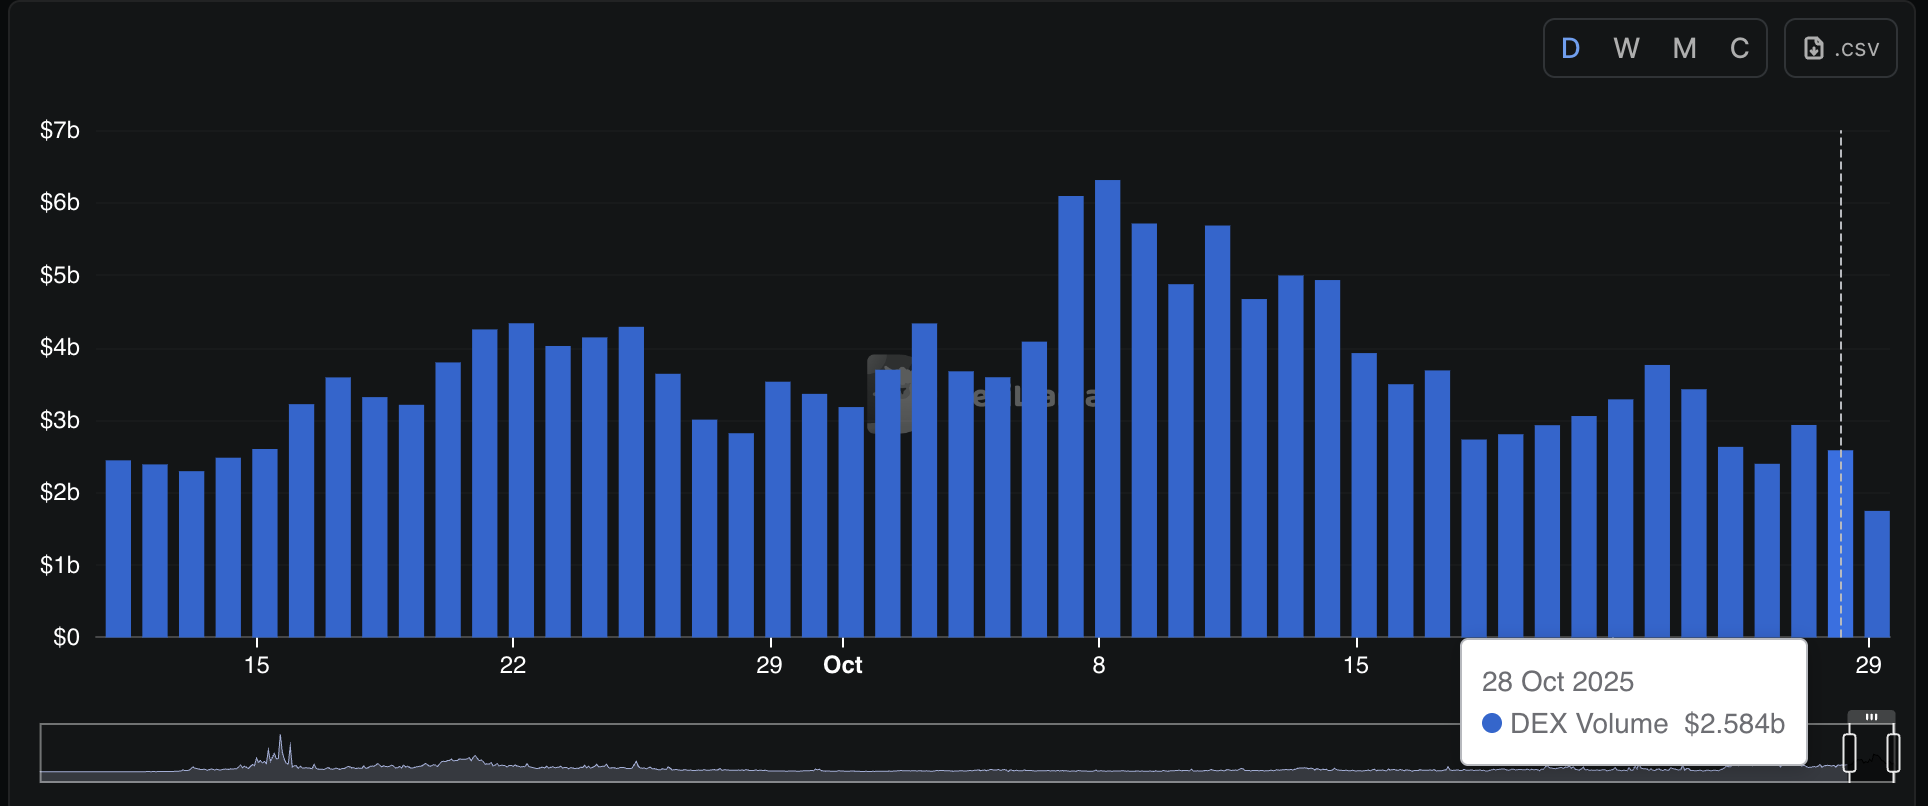
BNB Chain DEXs volume. Source: DeFiLlama
Additionally, the chain revenue plunged to $98,294 on Tuesday from $787,655 on October 8, corroborating the low demand or capital rotation possibility. If BNB Chain fails to regain user demand, its utility token could further decline in value.
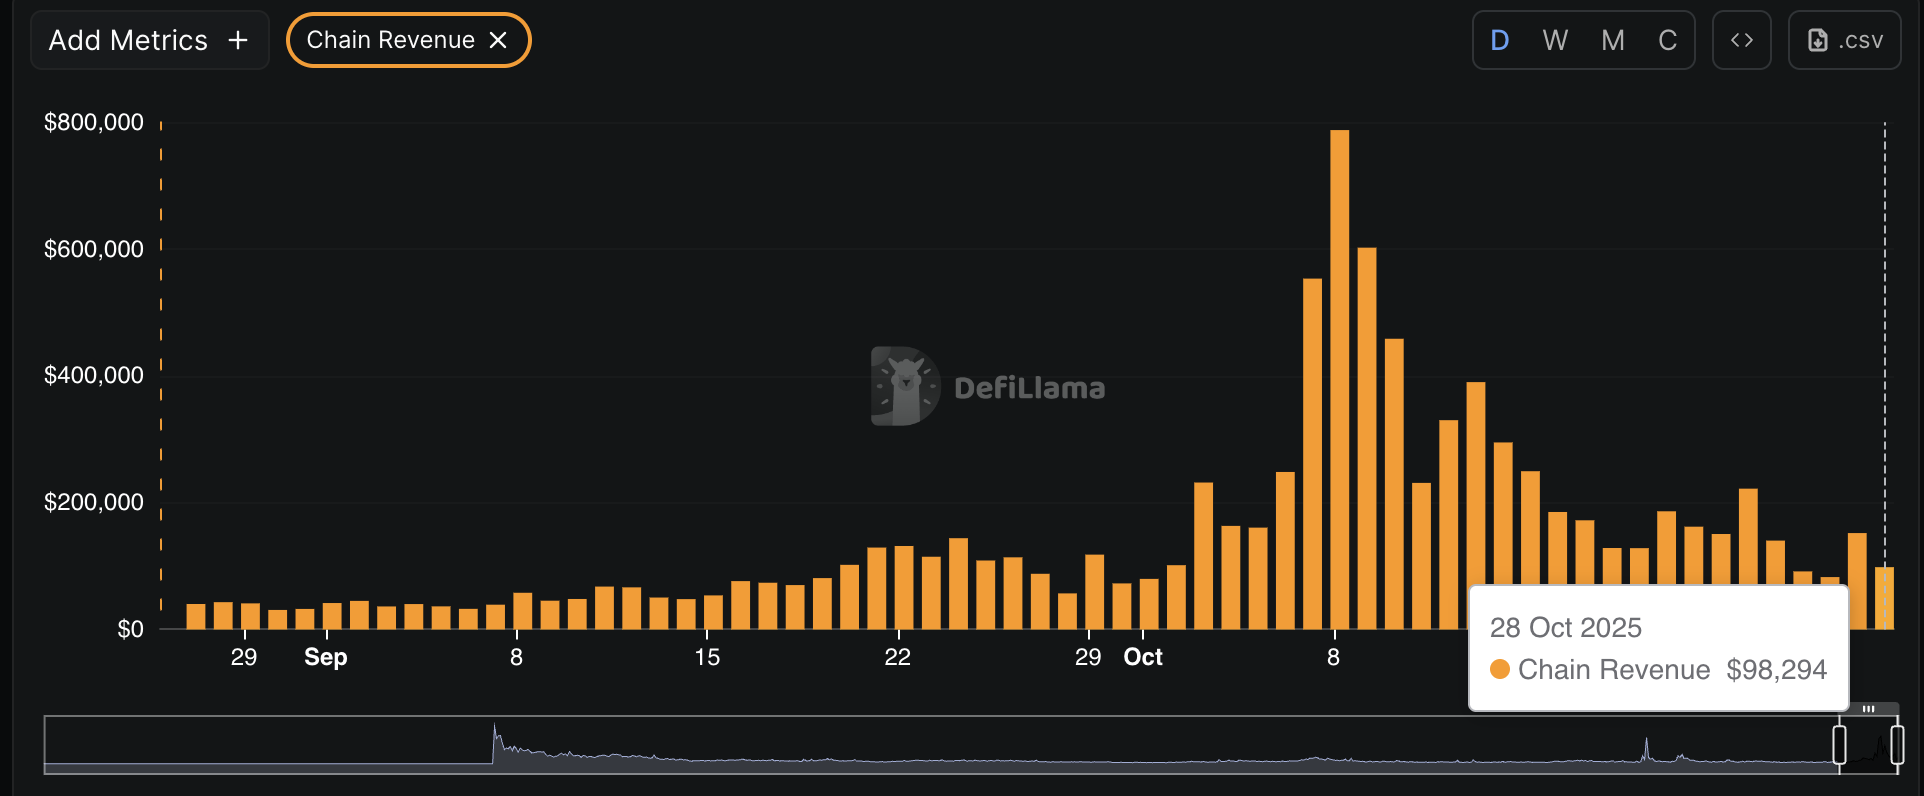
BNB Chain revenue. Source: DeFiLlama
BNB risks a bearish flag breakdown for a 25% drop
BNB holds above the 200-period EMA on the 4-hour chart at $1,107, and a local support trendline formed by connecting the October 17 and October 22 lows, part of the bearish flag pattern. The 25% pullback from October 13 to October 17 acts as the downward flagpole of this pattern near $820.
If BNB flips below $1,100, it would confirm the downside breakout of the bearish flag. In such a case, the key support levels are $1,021, $932, $860, and $819, marked by the October 17, September 26, October 10, and August 16 lows on the 4-hour chart. This last level roughly coincides with the bearish flag chart pattern target.
Additionally, the momentum indicators on the 4-hour chart suggest that bearish pressure is increasing, as the Relative Strength Index (RSI) at 42 is below the midline, indicating further room for correction before reaching the oversold zone.
At the same time, the Moving Average Convergence Divergence (MACD) indicator displays the average lines in a declining trend, indicating a surge in selling pressure.
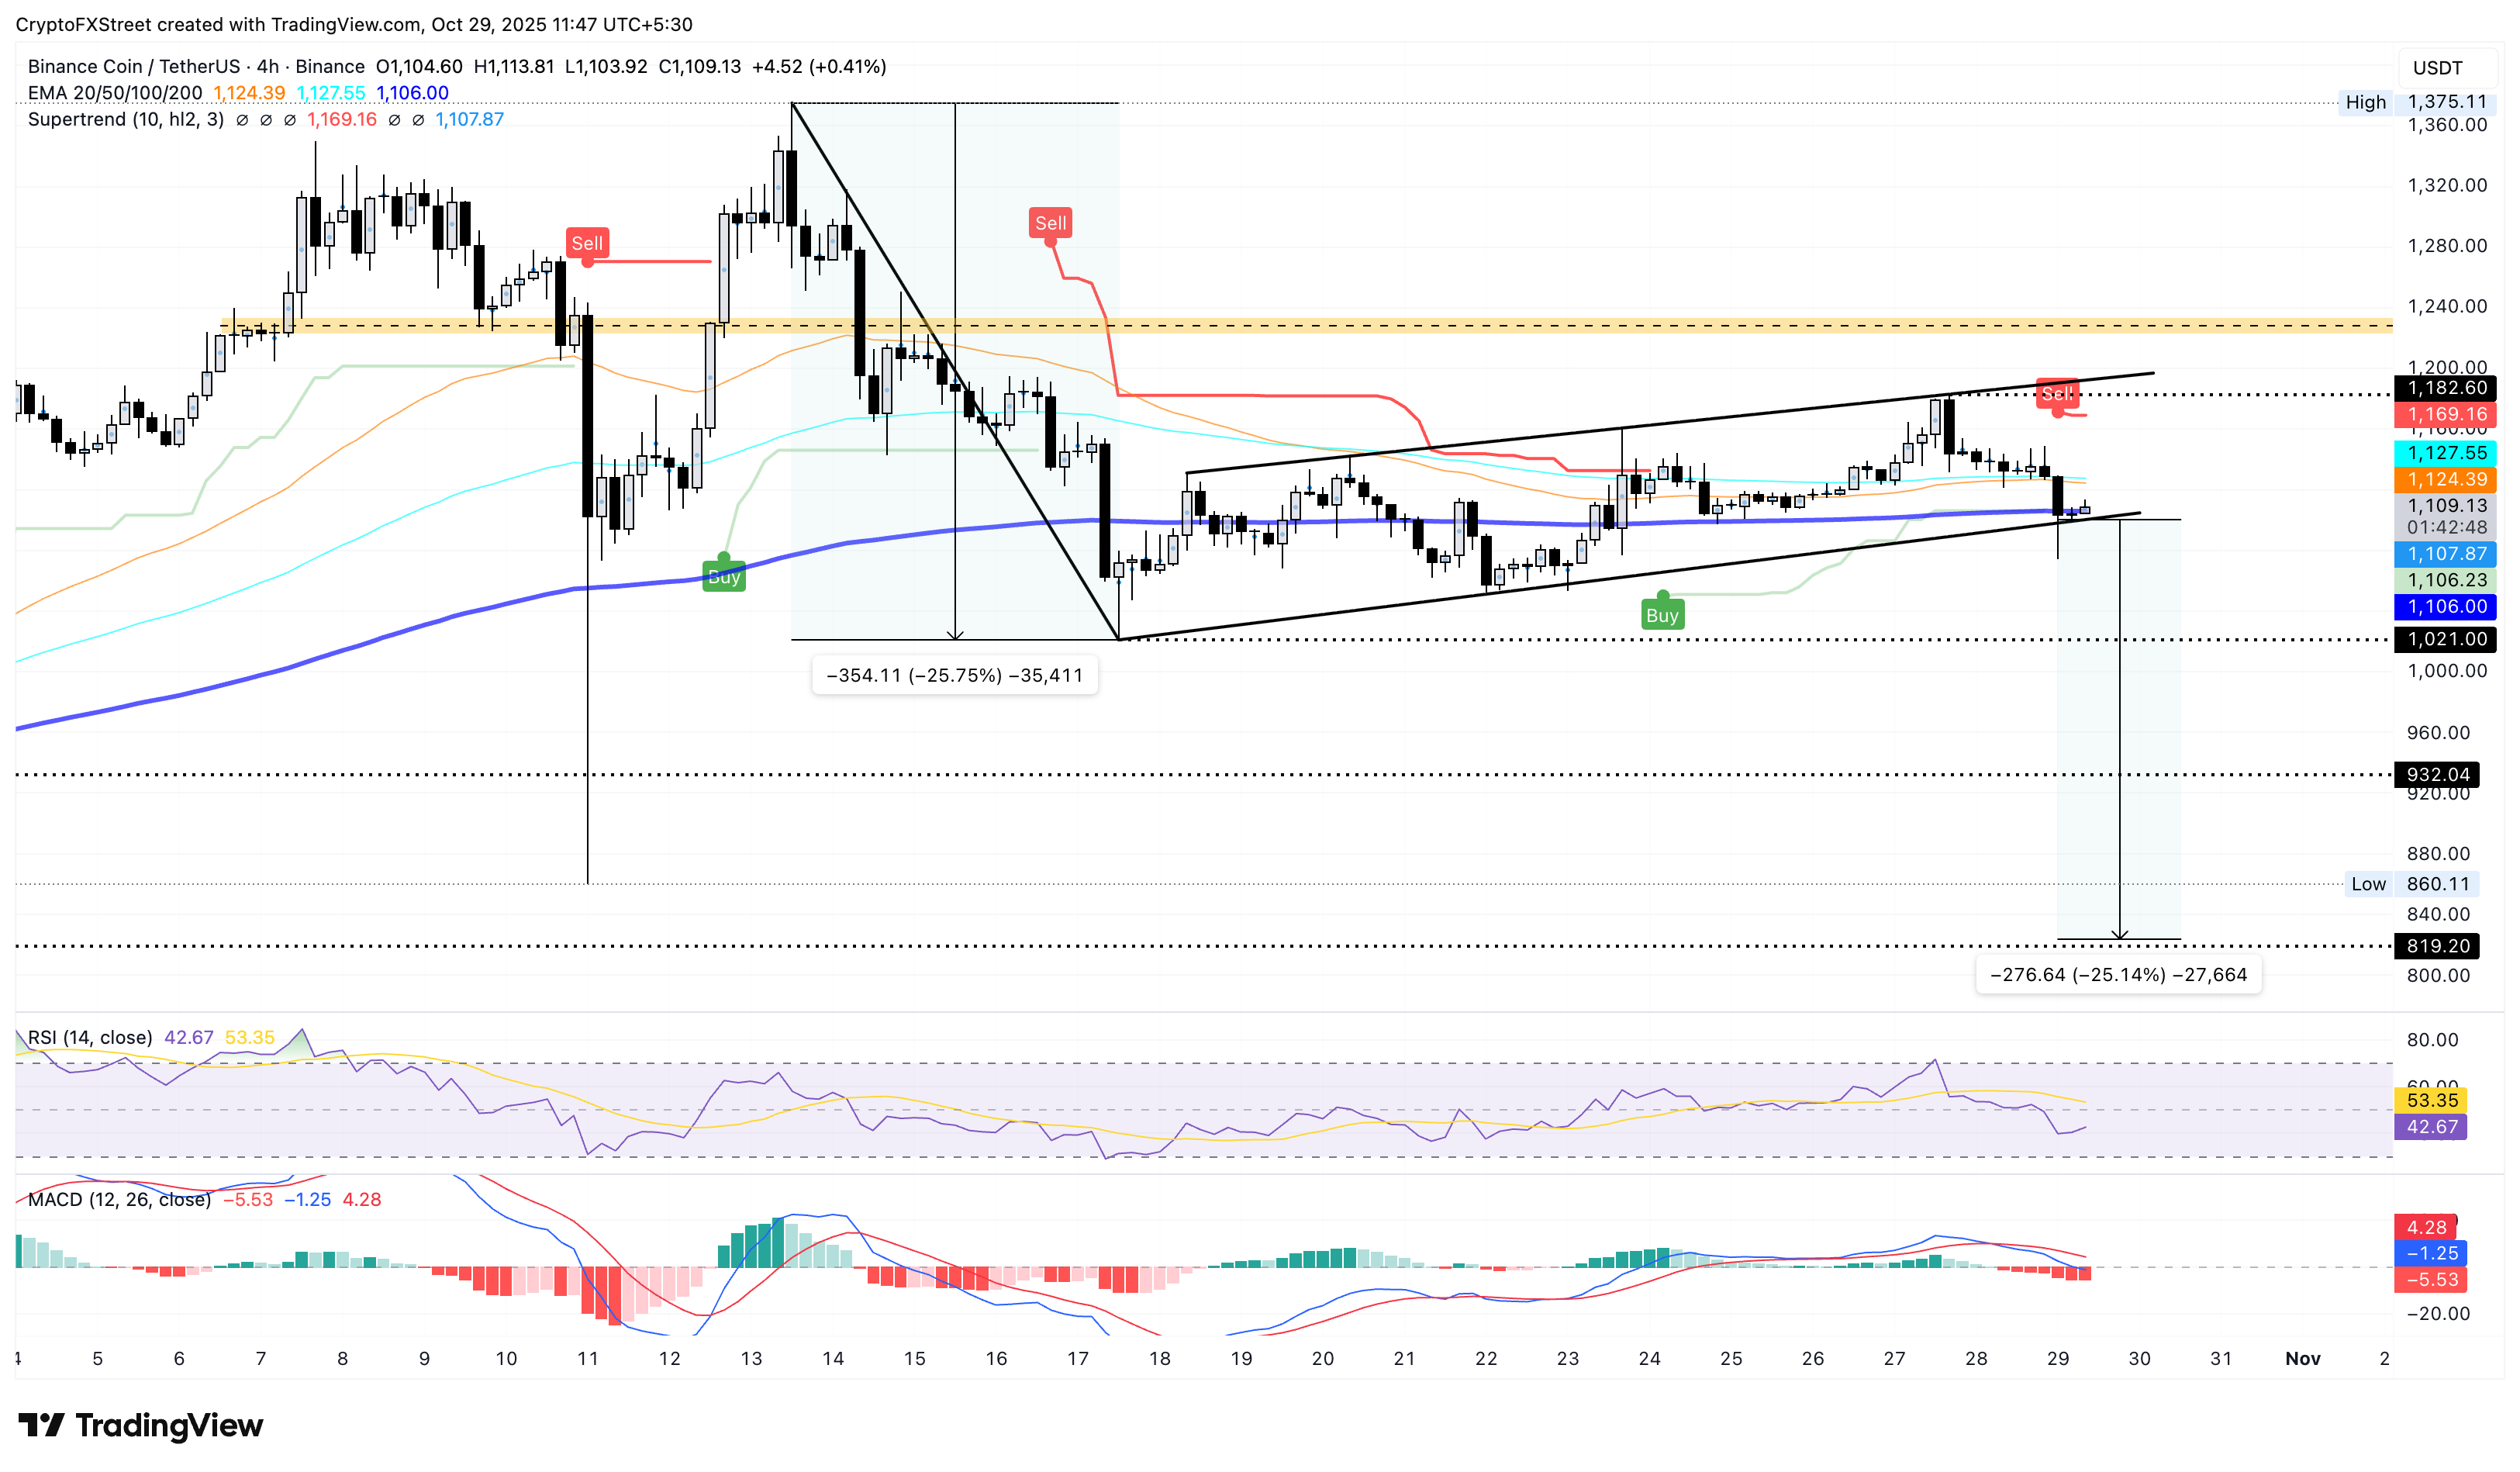
BNB/USDT 4-hour price chart.
On the upside, a bounce back in BNB from the 200-period EMA near the $1,100 mark could retest the $1,182 peak from Monday.
Anticipating further losses, the retail demand for BNB has significantly dropped in the derivatives market. CoinGlass data shows a 4.90% drop in BNB futures Open Interest (OI) over the last 24 hours to $1.70 billion, suggesting traders are either reducing their exposure or position leverage.
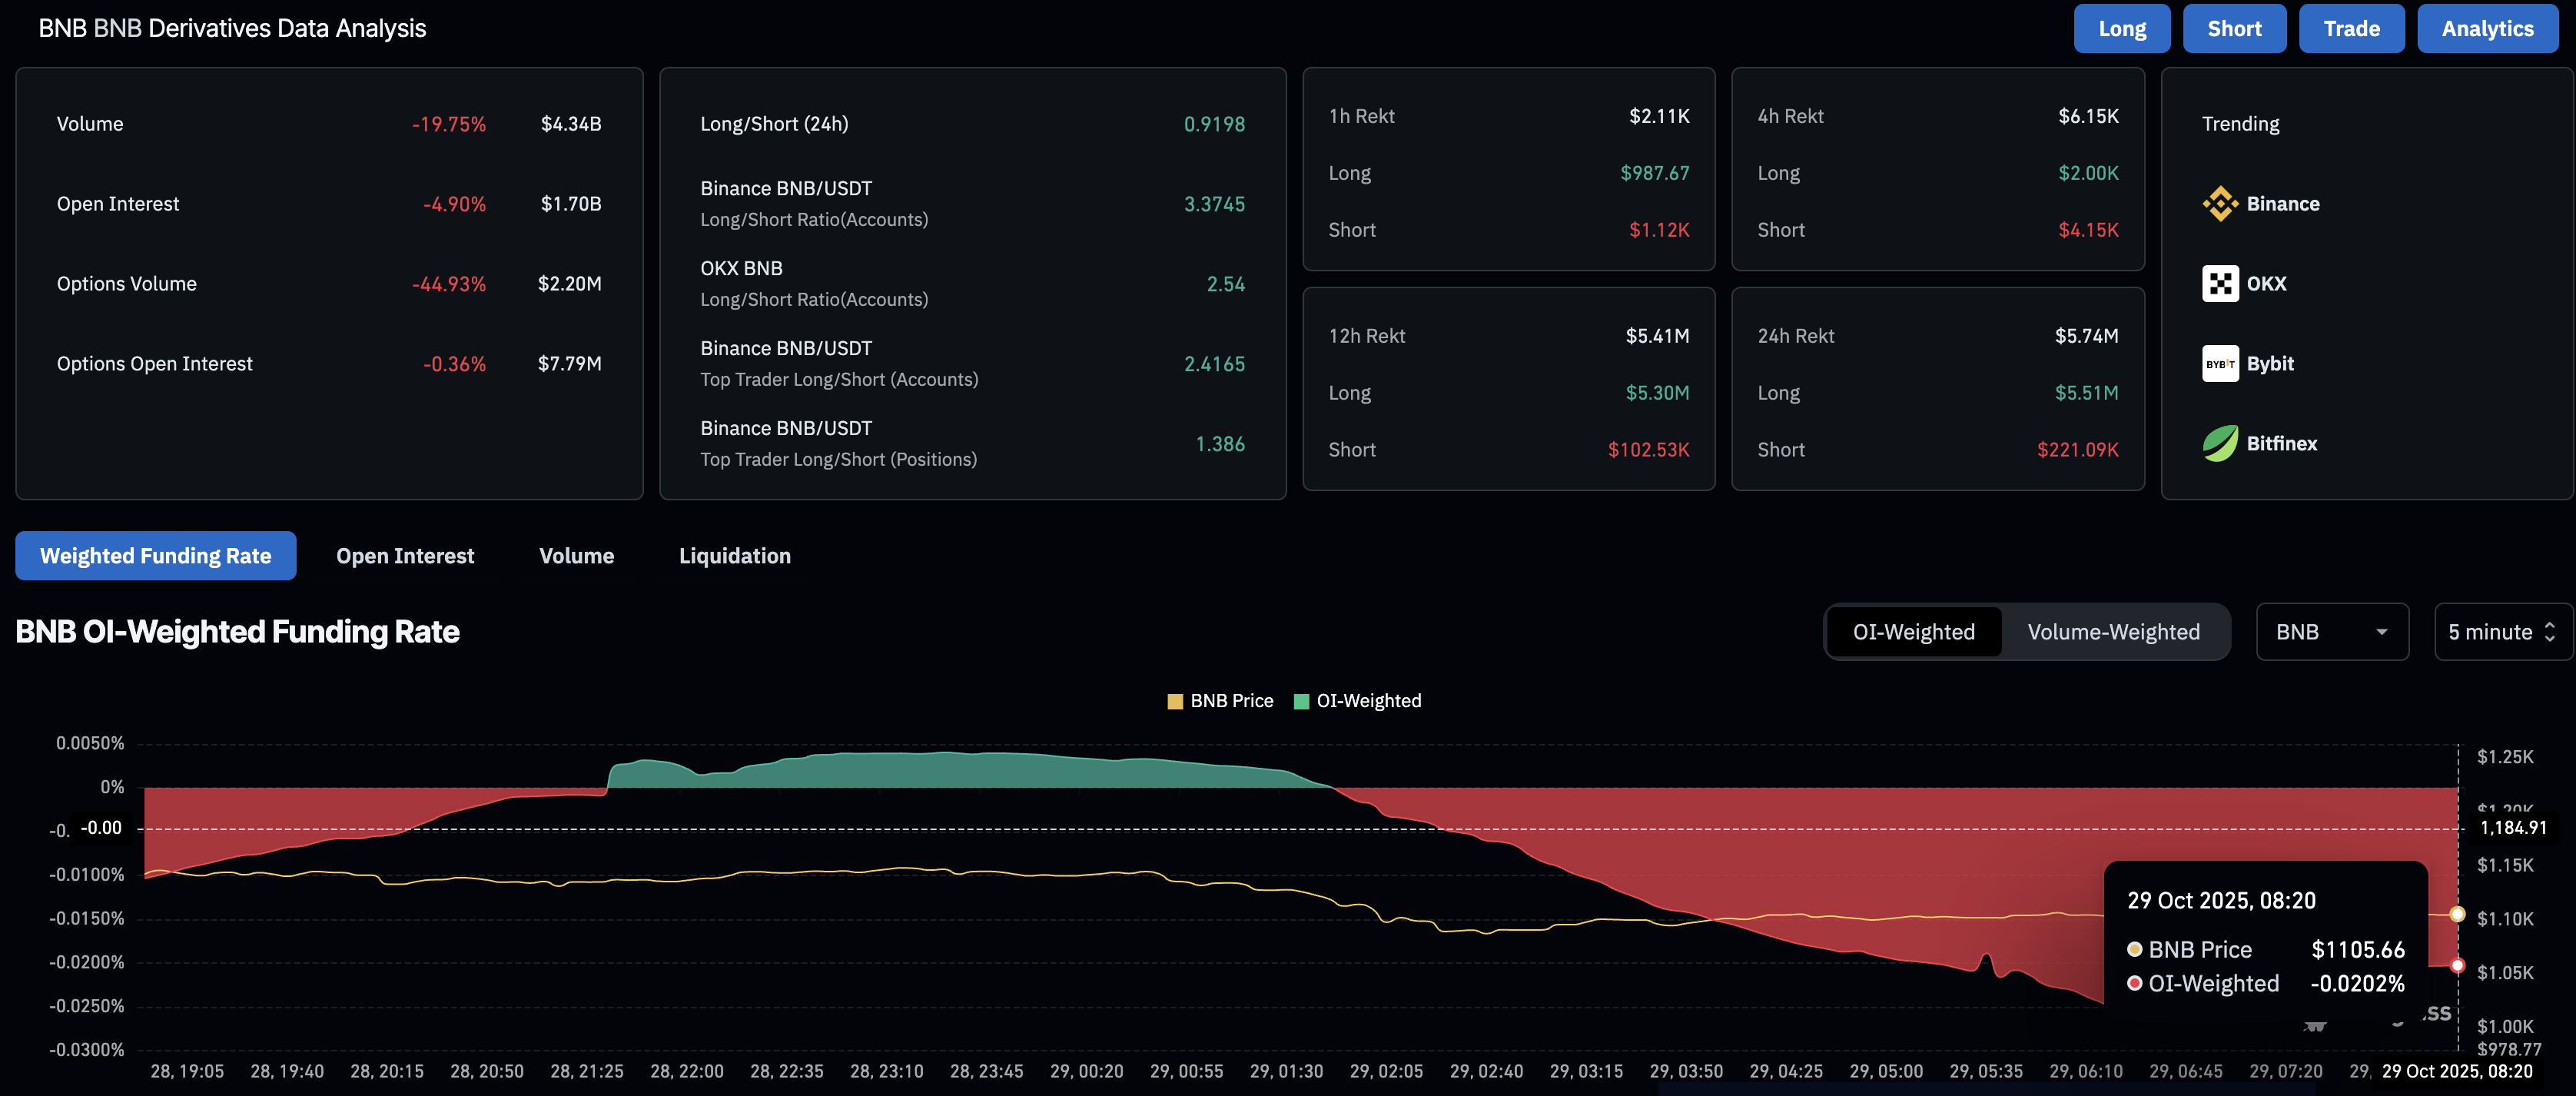
BNB derivatives data. Source: CoinGlass

FXStreet
Lebih sejuta pengguna bergantung pada FXStreet untuk data pasaran masa nyata, alat carta, pandangan pakar dan berita Forex. Kalendar ekonomi yang komprehensif dan webinar pendidikan mereka membantu pedagang kekal bermaklumat dan membuat keputusan yang dikira. FXStreet disokong oleh pasukan kira-kira 60 profesional di ibu pejabat Barcelona dan pelbagai wilayah global.
Read More


