
Trade The World
Cardano Price Forecast: ADA extends correction as bears tighten grip
Oleh Manish Chhetri
Tarikh Diterbitkan: 8 Oct 2025 | Tarikh Diubah: 8 Oct 2025


POPULAR ARTICLES

Cardano (ADA) is trading in the red, currently below $0.82 at the time of writing on Wednesday, following a nearly 6% correction on the previous day.
- Cardano price continues to trade in the red on Wednesday after falling nearly 6% the previous day.
- On-chain and derivatives data signal weakness as Spot Taker CVD stays negative and bearish bets increase.
- The technical outlook suggests a correction, with momentum indicators indicating early signs of weakening momentum.
Cardano (ADA) is trading in the red, currently below $0.82 at the time of writing on Wednesday, following a nearly 6% correction on the previous day. On-chain signals and rising bearish bets in derivatives markets point to sustained weakness, while technical indicators suggest ADA may face a deeper correction ahead.
Cardano’s on-chain and derivatives data hint at a correction
CryptoQuant’s Spot Taker CVD for Cardano is negative, and its value has been steadily rising since mid-July. This metric measures the cumulative difference between market buy and sell volumes over a three-month period. When the three-month CVD is positive, it suggests the Taker Buy Dominant Phase. A negative value, as it is currently happening, indicates the Taker Sell Dominant Phase.
 (2)-1759899301831-1759899301833.png)
Cardano Spot Taker CVD chart. Source: CryptoQuant
On the derivatives side, CoinGlass’s ADA long-to-short ratio, which stands at 0.89, is nearly its monthly high. This ratio, below one, reflects bearish sentiment in the markets, as more traders are betting on the asset price to fall.
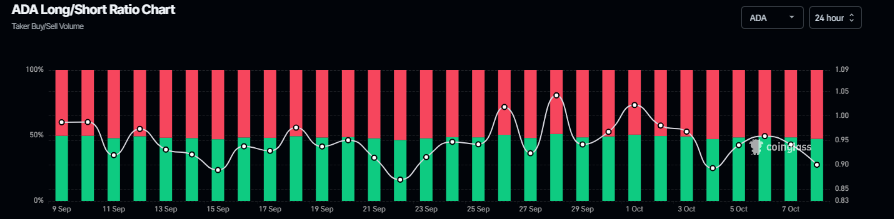
Cardano’s long-to-short ratio chart. Source: Coinglass
Cardano Price Forecast: ADA momentum indicators reflect early signs of weakness
Cardano price failed to find support around the daily support level at $0.84 on Tuesday and corrected nearly 6%, closing below the 61.8% Fibonacci retracement level at $0.82. At the time of writing on Wednesday, it continues to trade in red at around $0.81.
If ADA continues its pullback, it could extend the correction toward the 200-day Exponential Moving Average (EMA) at $0.76.
The Relative Strength Index (RSI) on the daily chart reads 45, which is below the neutral level of 50, indicating that bearish momentum is gaining traction. The Moving Average Convergence Divergence (MACD) lines are about to flip a bearish crossover. If MACD flips to a bearish crossover, it would further support the bearish view.
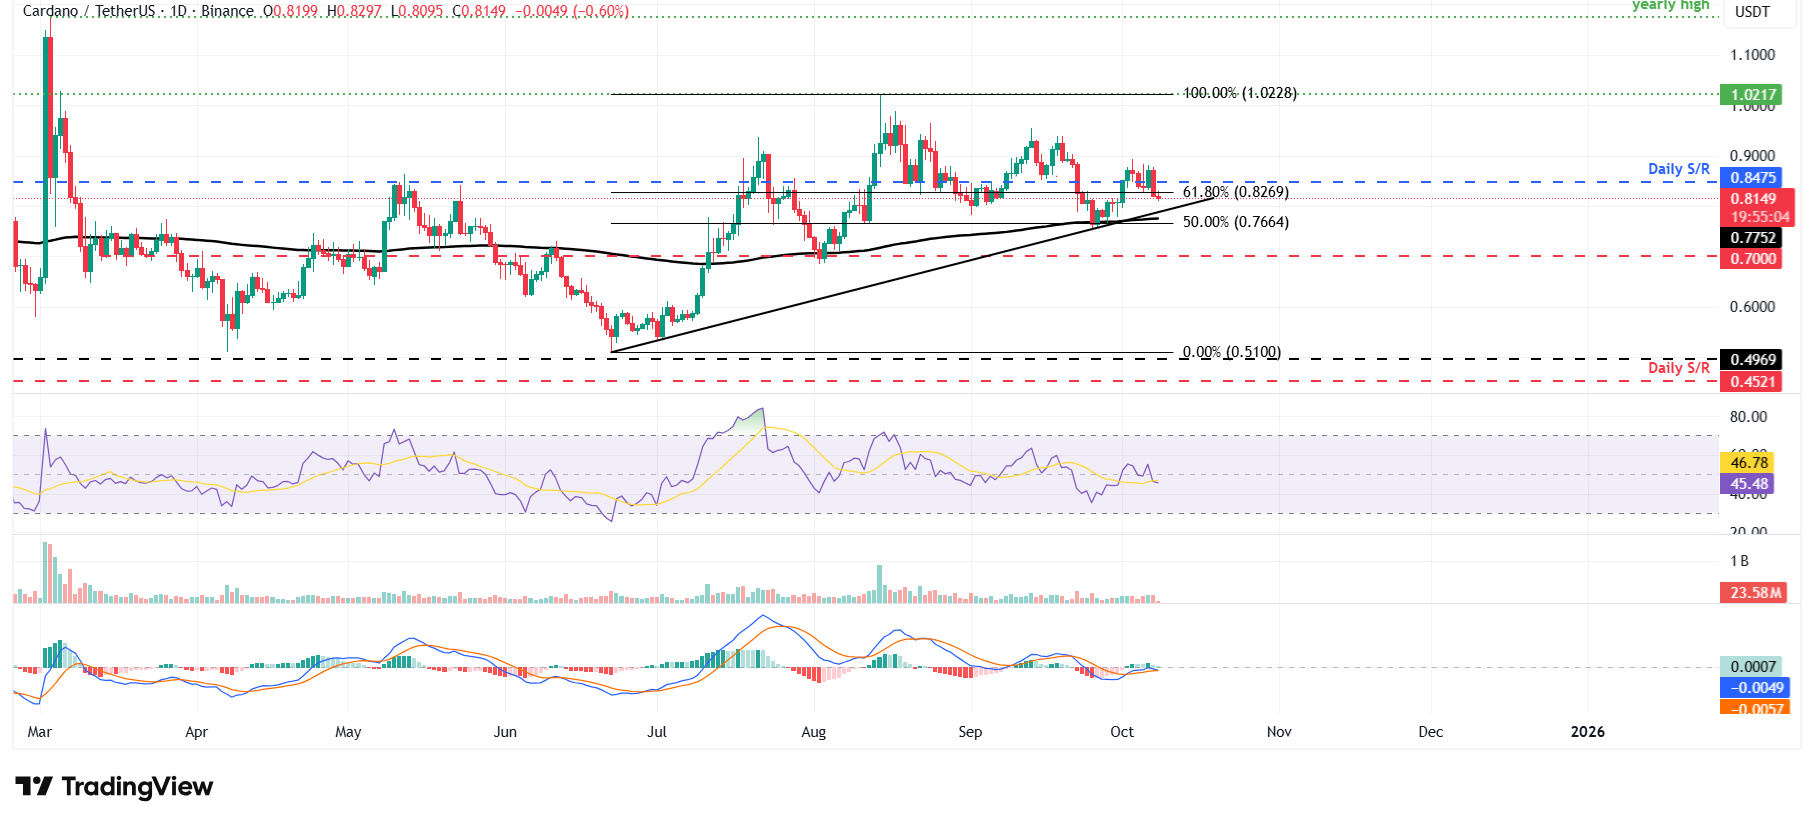
ADA/USDT daily chart
However, if ADA recovers, closes above the daily level at $0.84 and holds, it could extend the rally toward the psychological level at $1.

FXStreet
Lebih sejuta pengguna bergantung pada FXStreet untuk data pasaran masa nyata, alat carta, pandangan pakar dan berita Forex. Kalendar ekonomi yang komprehensif dan webinar pendidikan mereka membantu pedagang kekal bermaklumat dan membuat keputusan yang dikira. FXStreet disokong oleh pasukan kira-kira 60 profesional di ibu pejabat Barcelona dan pelbagai wilayah global.
Read More


