
Trade The World
Cardano Price Forecast: ADA eyes breakout as whale accumulation and on-chain data turn bullish
Oleh Manish Chhetri
Tarikh Diterbitkan: 28 Oct 2025 | Tarikh Diubah: 28 Oct 2025


POPULAR ARTICLES

Cardano (ADA) is trading around $0.66 at the time of writing on Tuesday, after being rejected from a key level the previous day. On-chain data shows whale accumulation rising, fueling optimism for a potential breakout.
- Cardano price faces rejection around $0.70, a firm close above could trigger a renewed rally.
- Santiment data shows that whale wallets are actively accumulating ADA, signaling growing confidence.
- The technical outlook supports a breakout, as momentum indicators signal fading bearish pressure.
Cardano (ADA) is trading around $0.66 at the time of writing on Tuesday, after being rejected from a key level the previous day. On-chain data shows whale accumulation rising, fueling optimism for a potential breakout. The technical outlook also supports a rally ahead, as momentum indicators signal a fading bearish trend.
Cardano’s whale wallets buy dips
Santiment’s Supply Distribution data supports a bullish outlook for Cardano, as certain whales are buying ADA at recent price dips.
The metric indicates that whales holding between 1 million and 10 million ADA tokens (yellow line) and 10 million and 100 million tokens (blue line) have accumulated a total of 100 million ADA tokens from October 15 to Tuesday. During the same period, wallets holding between 100,000 and 1 million ADA tokens (red line) have shed 30 million tokens.
This shows that the second cohort of whales could have fallen prey to the capitulation event. In contrast, the first set of wallets seized the opportunity and accumulated Cardano at a discount.
 [09-1761628619184-1761628619185.37.13, 28 Oct, 2025].png)
ADA supply distribution chart. Source: Santiment
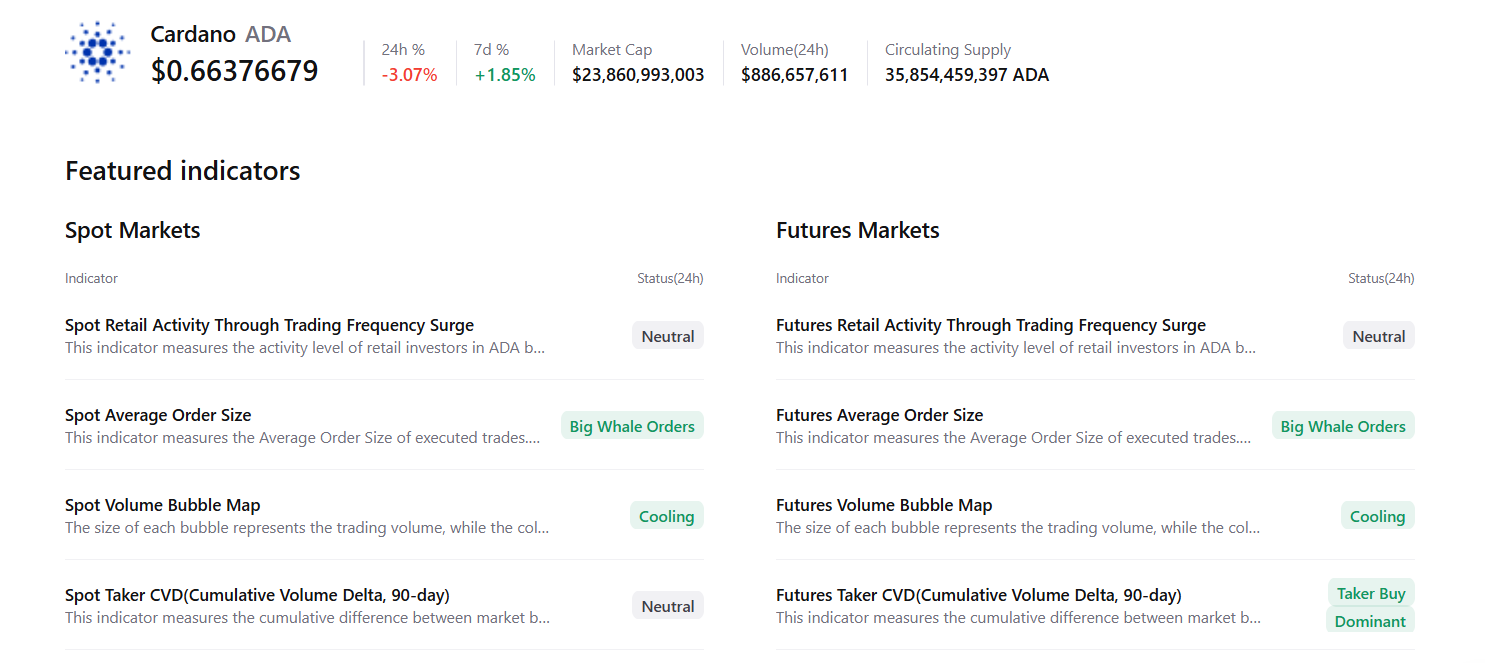
CryptoQuant’s summary data supports the bullish outlook, with both the spot and futures markets showing large whale orders and buy dominance, signaling a potential rally ahead.
Cardano Price Forecast: ADA shows signs of fading bearish momentum
Cardano price faced rejection from the 61.8% Fibonacci retracement at $0.69 on Monday. This level roughly coincides with the daily resistance at $0.70, making it a key zone of resistance. At the time of writing on Tuesday, ADA hovers at around $0.66.
If ADA breaks and closes above $0.70 on a daily basis, it could extend the rally toward the next daily resistance at $0.84.
The Relative Strength Index (RSI) on the daily chart is 43, moving up toward the neutral 50 level, indicating fading bearish momentum. Additionally, the Moving Average Convergence Divergence (MACD) indicator showed a bullish crossover on Sunday, providing a buy signal and supporting the bullish thesis.
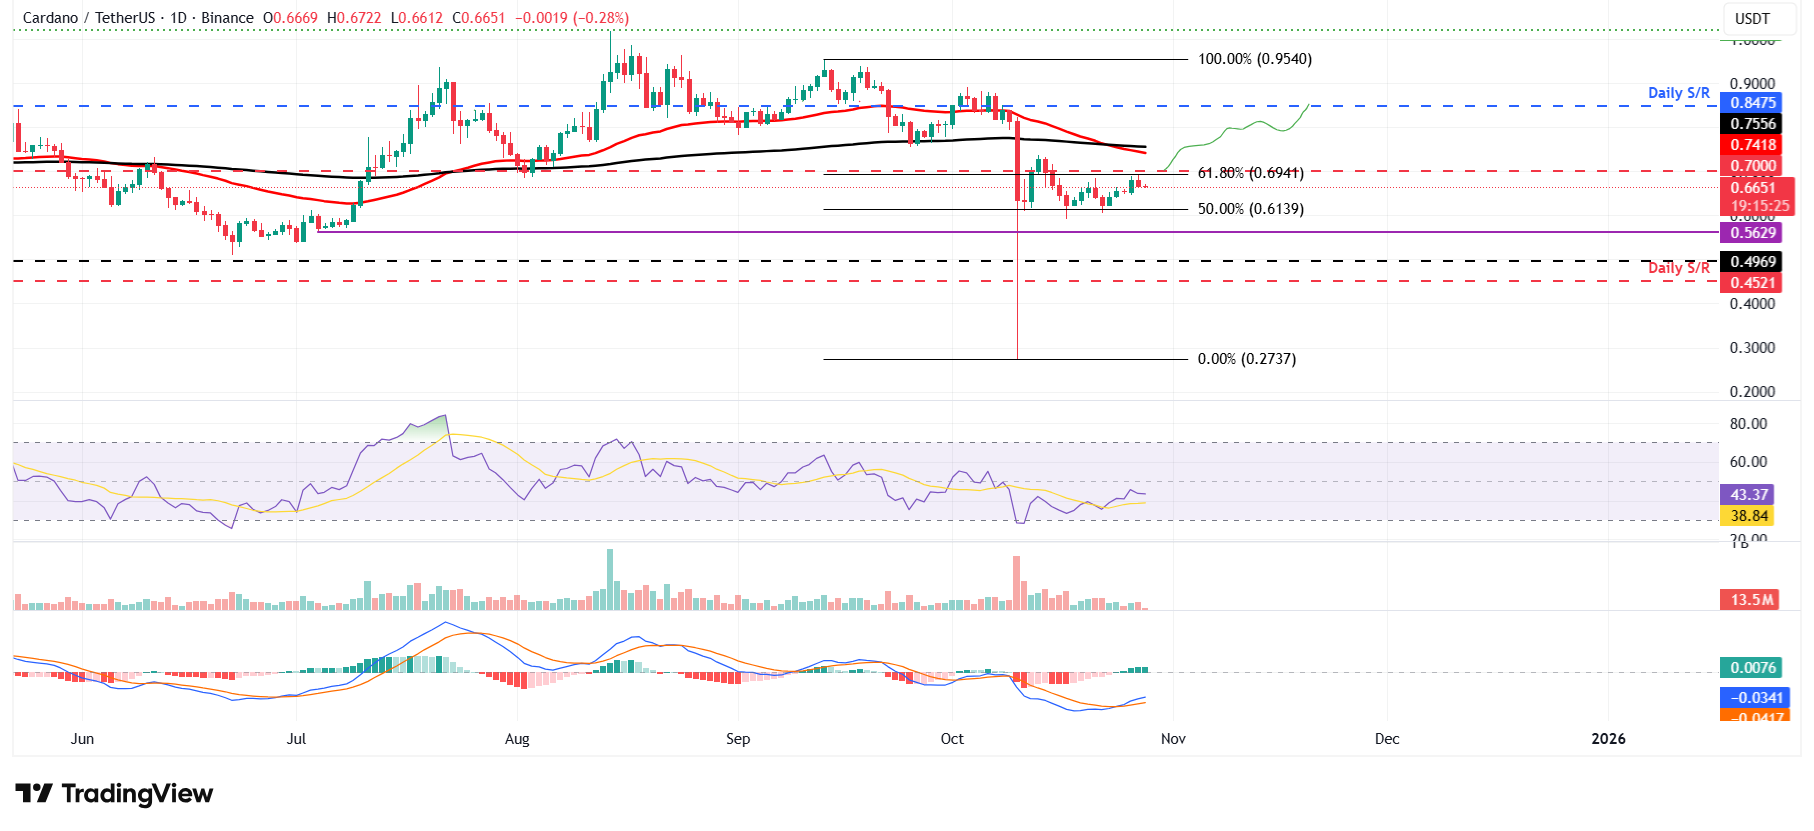
ADA/USDT daily chart
On the other hand, if ADA faces a correction, it could extend the decline toward the 50% retracement level at $0.61.

FXStreet
Lebih sejuta pengguna bergantung pada FXStreet untuk data pasaran masa nyata, alat carta, pandangan pakar dan berita Forex. Kalendar ekonomi yang komprehensif dan webinar pendidikan mereka membantu pedagang kekal bermaklumat dan membuat keputusan yang dikira. FXStreet disokong oleh pasukan kira-kira 60 profesional di ibu pejabat Barcelona dan pelbagai wilayah global.
Read More


