
Trade The World
Chainlink Price Forecast: Chainlink reserve expansion counters retail selling
Oleh Vishal Dixit
Tarikh Diterbitkan: 24 Oct 2025 | Tarikh Diubah: 24 Oct 2025


POPULAR ARTICLES

Chainlink (LINK) stalls above $17 at press time on Friday after a 2% recovery on Thursday, driven by the buyback of 63,481 LINK tokens. Technically, Chainlink stands at a crossroads, while muted retail interest tilts it bearish.
- Chainlink holds above $17 after a 2% recovery on Thursday, fueled by a buyback of over 63,000 LINK tokens.
- Derivatives data shows muted interest in Chainlink, indicating a risk-off sentiment among investors.
- The technical outlook for Chainlink remains divided as momentum wanes and recovery stalls.
Chainlink (LINK) stalls above $17 at press time on Friday after a 2% recovery on Thursday, driven by the buyback of 63,481 LINK tokens. Technically, Chainlink stands at a crossroads, while muted retail interest tilts it bearish.
Chainlink Reserve buyback fails to boost retail demand
Chainlink Reserve is funded by revenue from off-chain and on-chain services, which reduces the supply of LINK available in the market, thereby driving demand higher. However, the recent buyback of 63,481 LINK on Thursday, the second-largest inflow since inception, has served as a buffer, preventing further losses. As of Friday, the Chainlink Reserve holds 586,641 LINK tokens, worth $10.2 million.
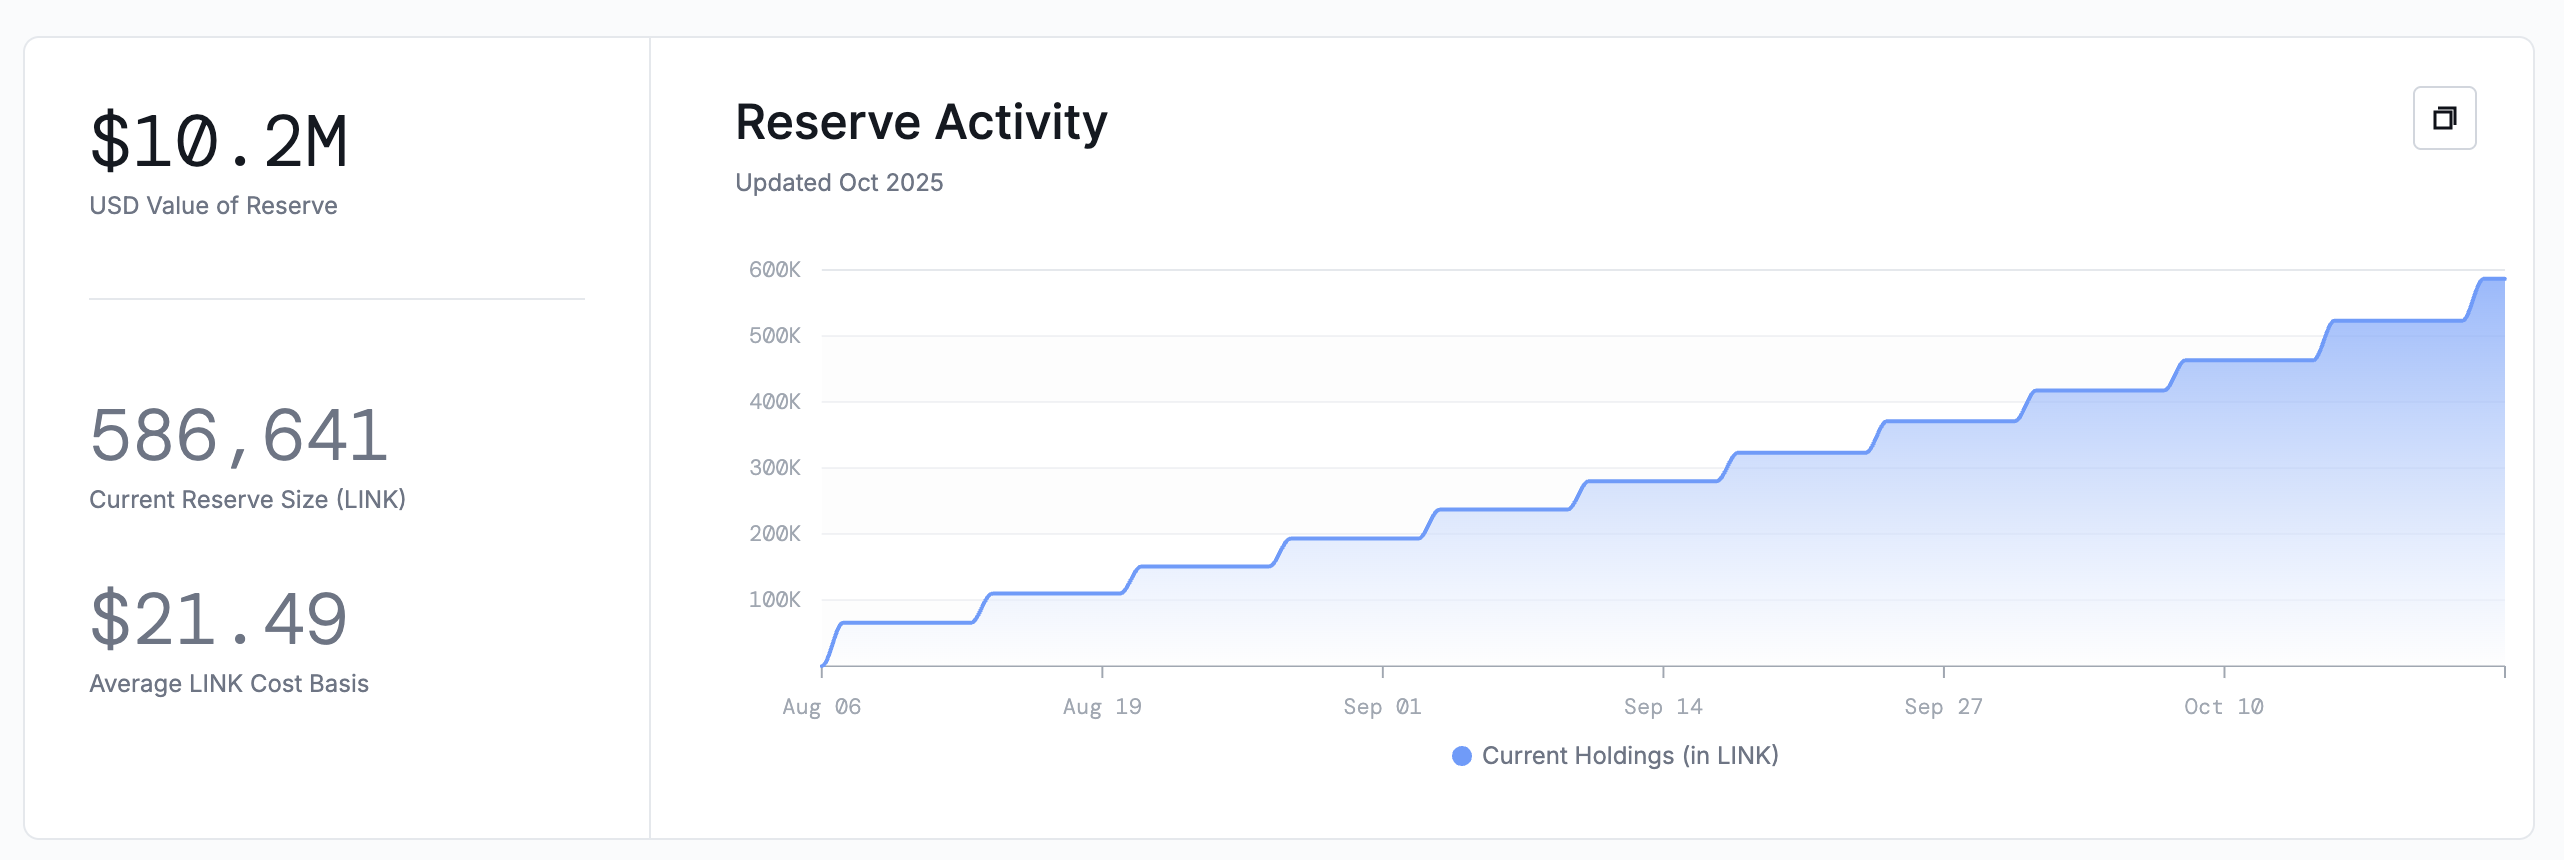
Chainlink Reserve. Source: Chainlink
Amid the buyback, the retail demand for Chainlink smolders according to CoinGlass’ LINK futures Open Interest data, stalling at $654.04 million. The sideways trend in LINK OI after the October 10 crash suggests an extended risk-off sentiment, with traders avoiding increased leverage or adding new long positions.
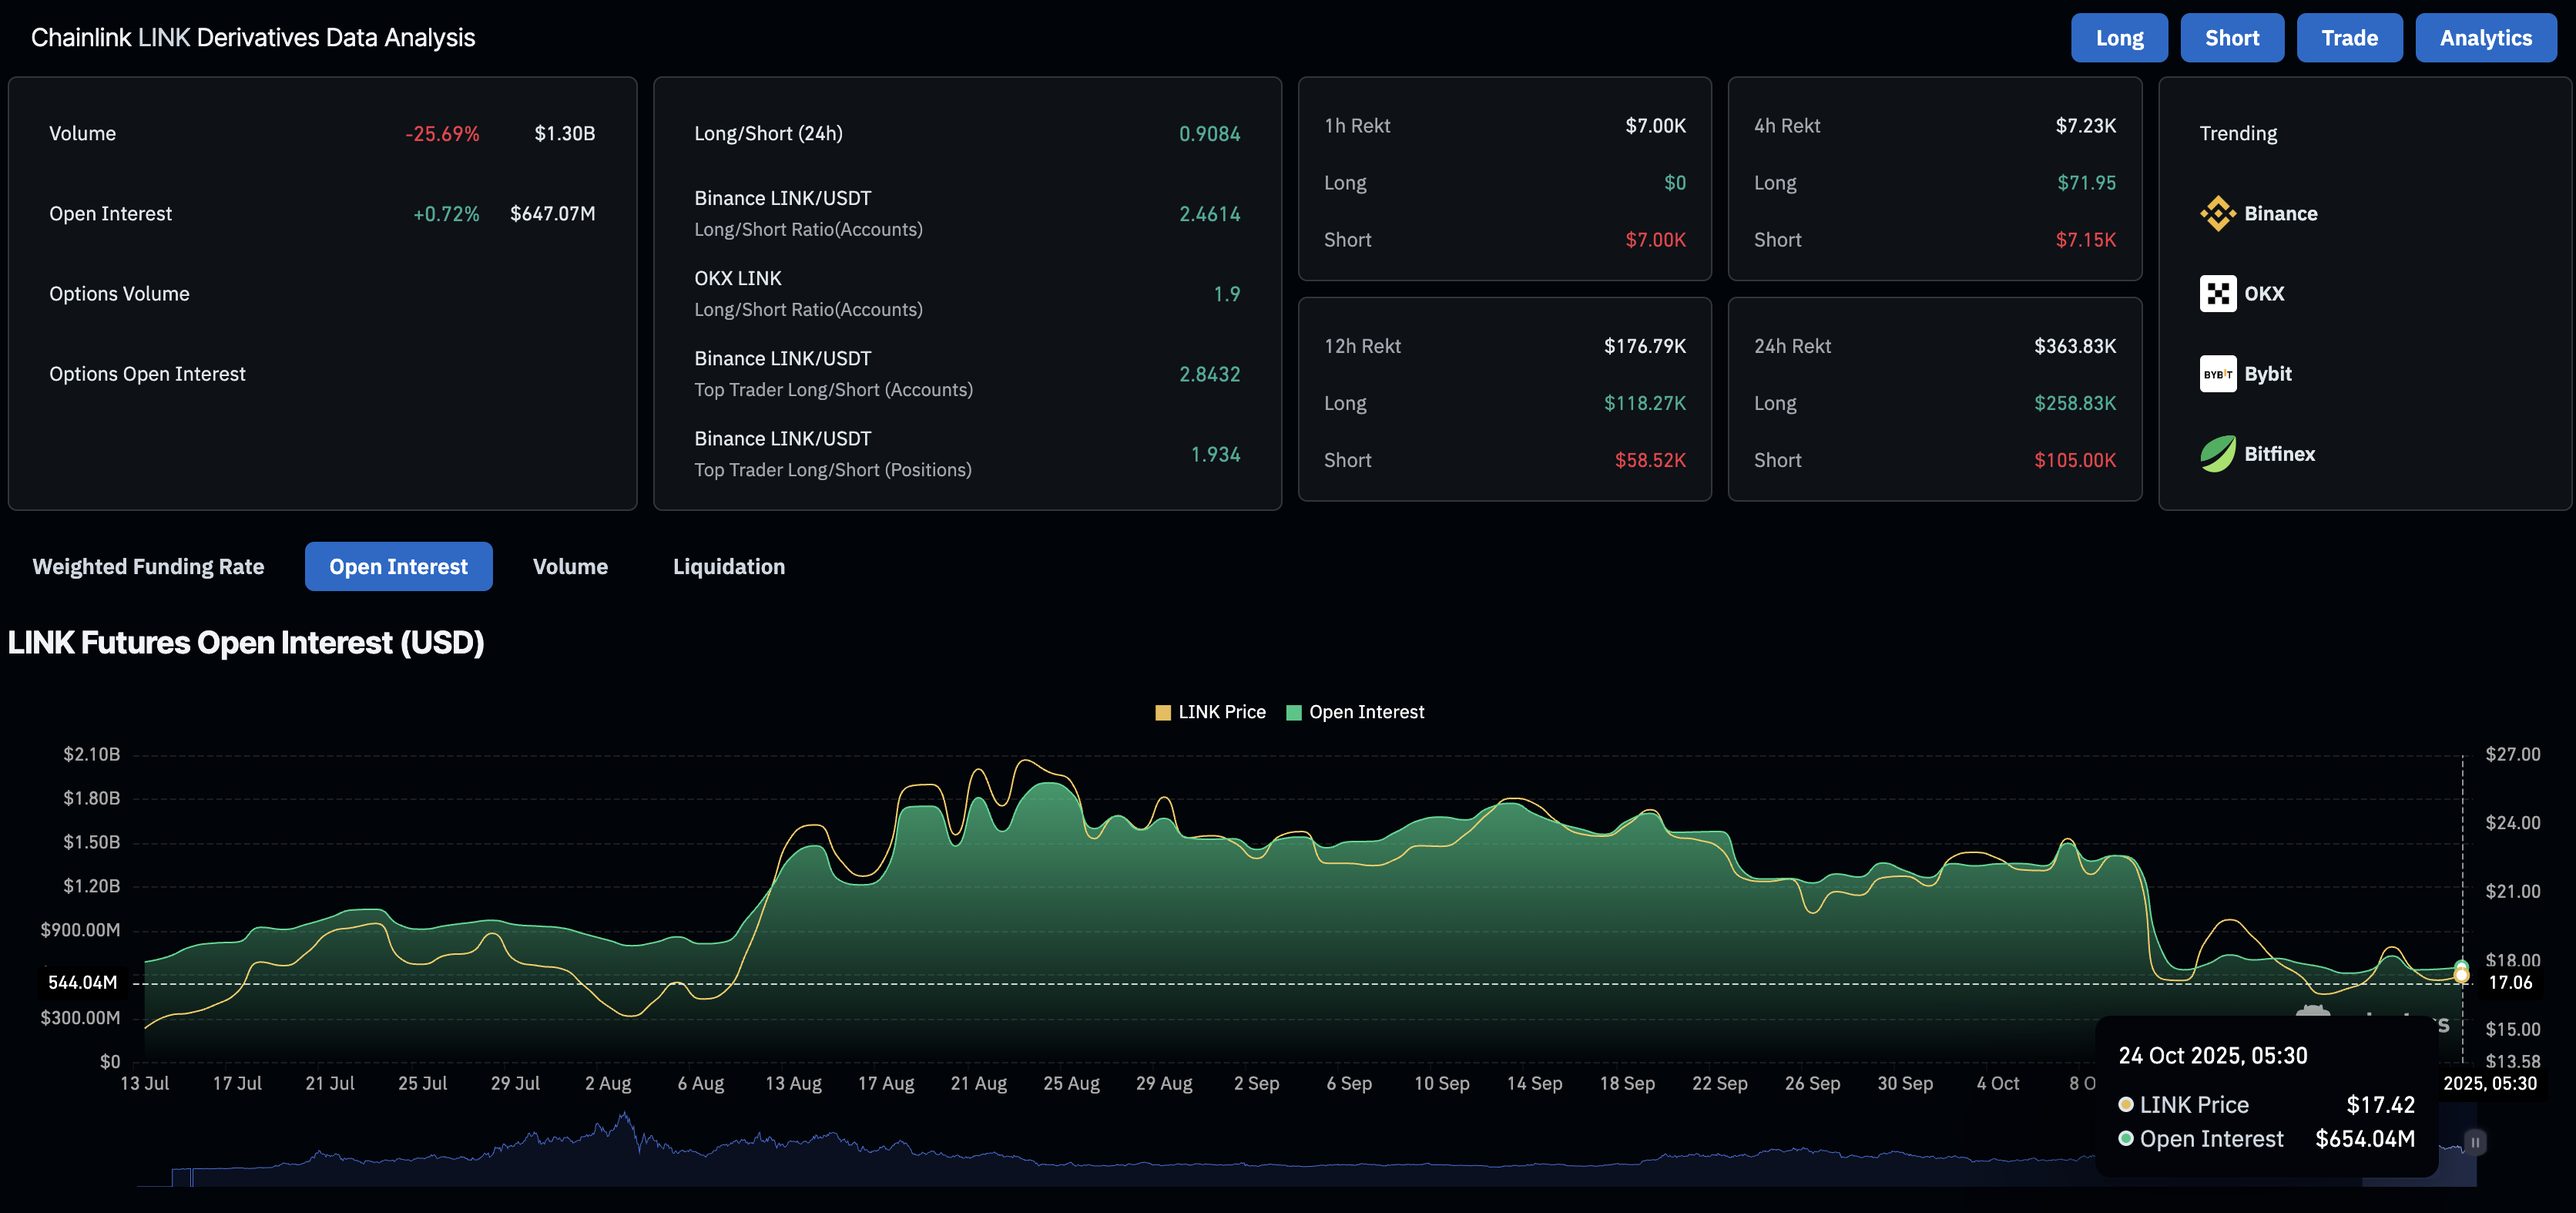
Chainlink derivatives data. Source: CoinGlass
Chainlink struggles to extend recovery
Chainlink edges lower by 0.50% at press time on Friday, following the 2% recovery on the previous day. The oracle token struggles to exceed the central Pivot Point at $17.72, risking a freefall to the S1 Pivot Point at $15.26.
Still, the momentum indicators on the daily chart flash mixed signals as the Moving Average Convergence Divergence (MACD) approaches its signal line, signaling a bullish crossover. Meanwhile, the Relative Strength Index (RSI) at 45 on the same chart maintains a sideways trend below the midpoint, indicating a bearish trend.
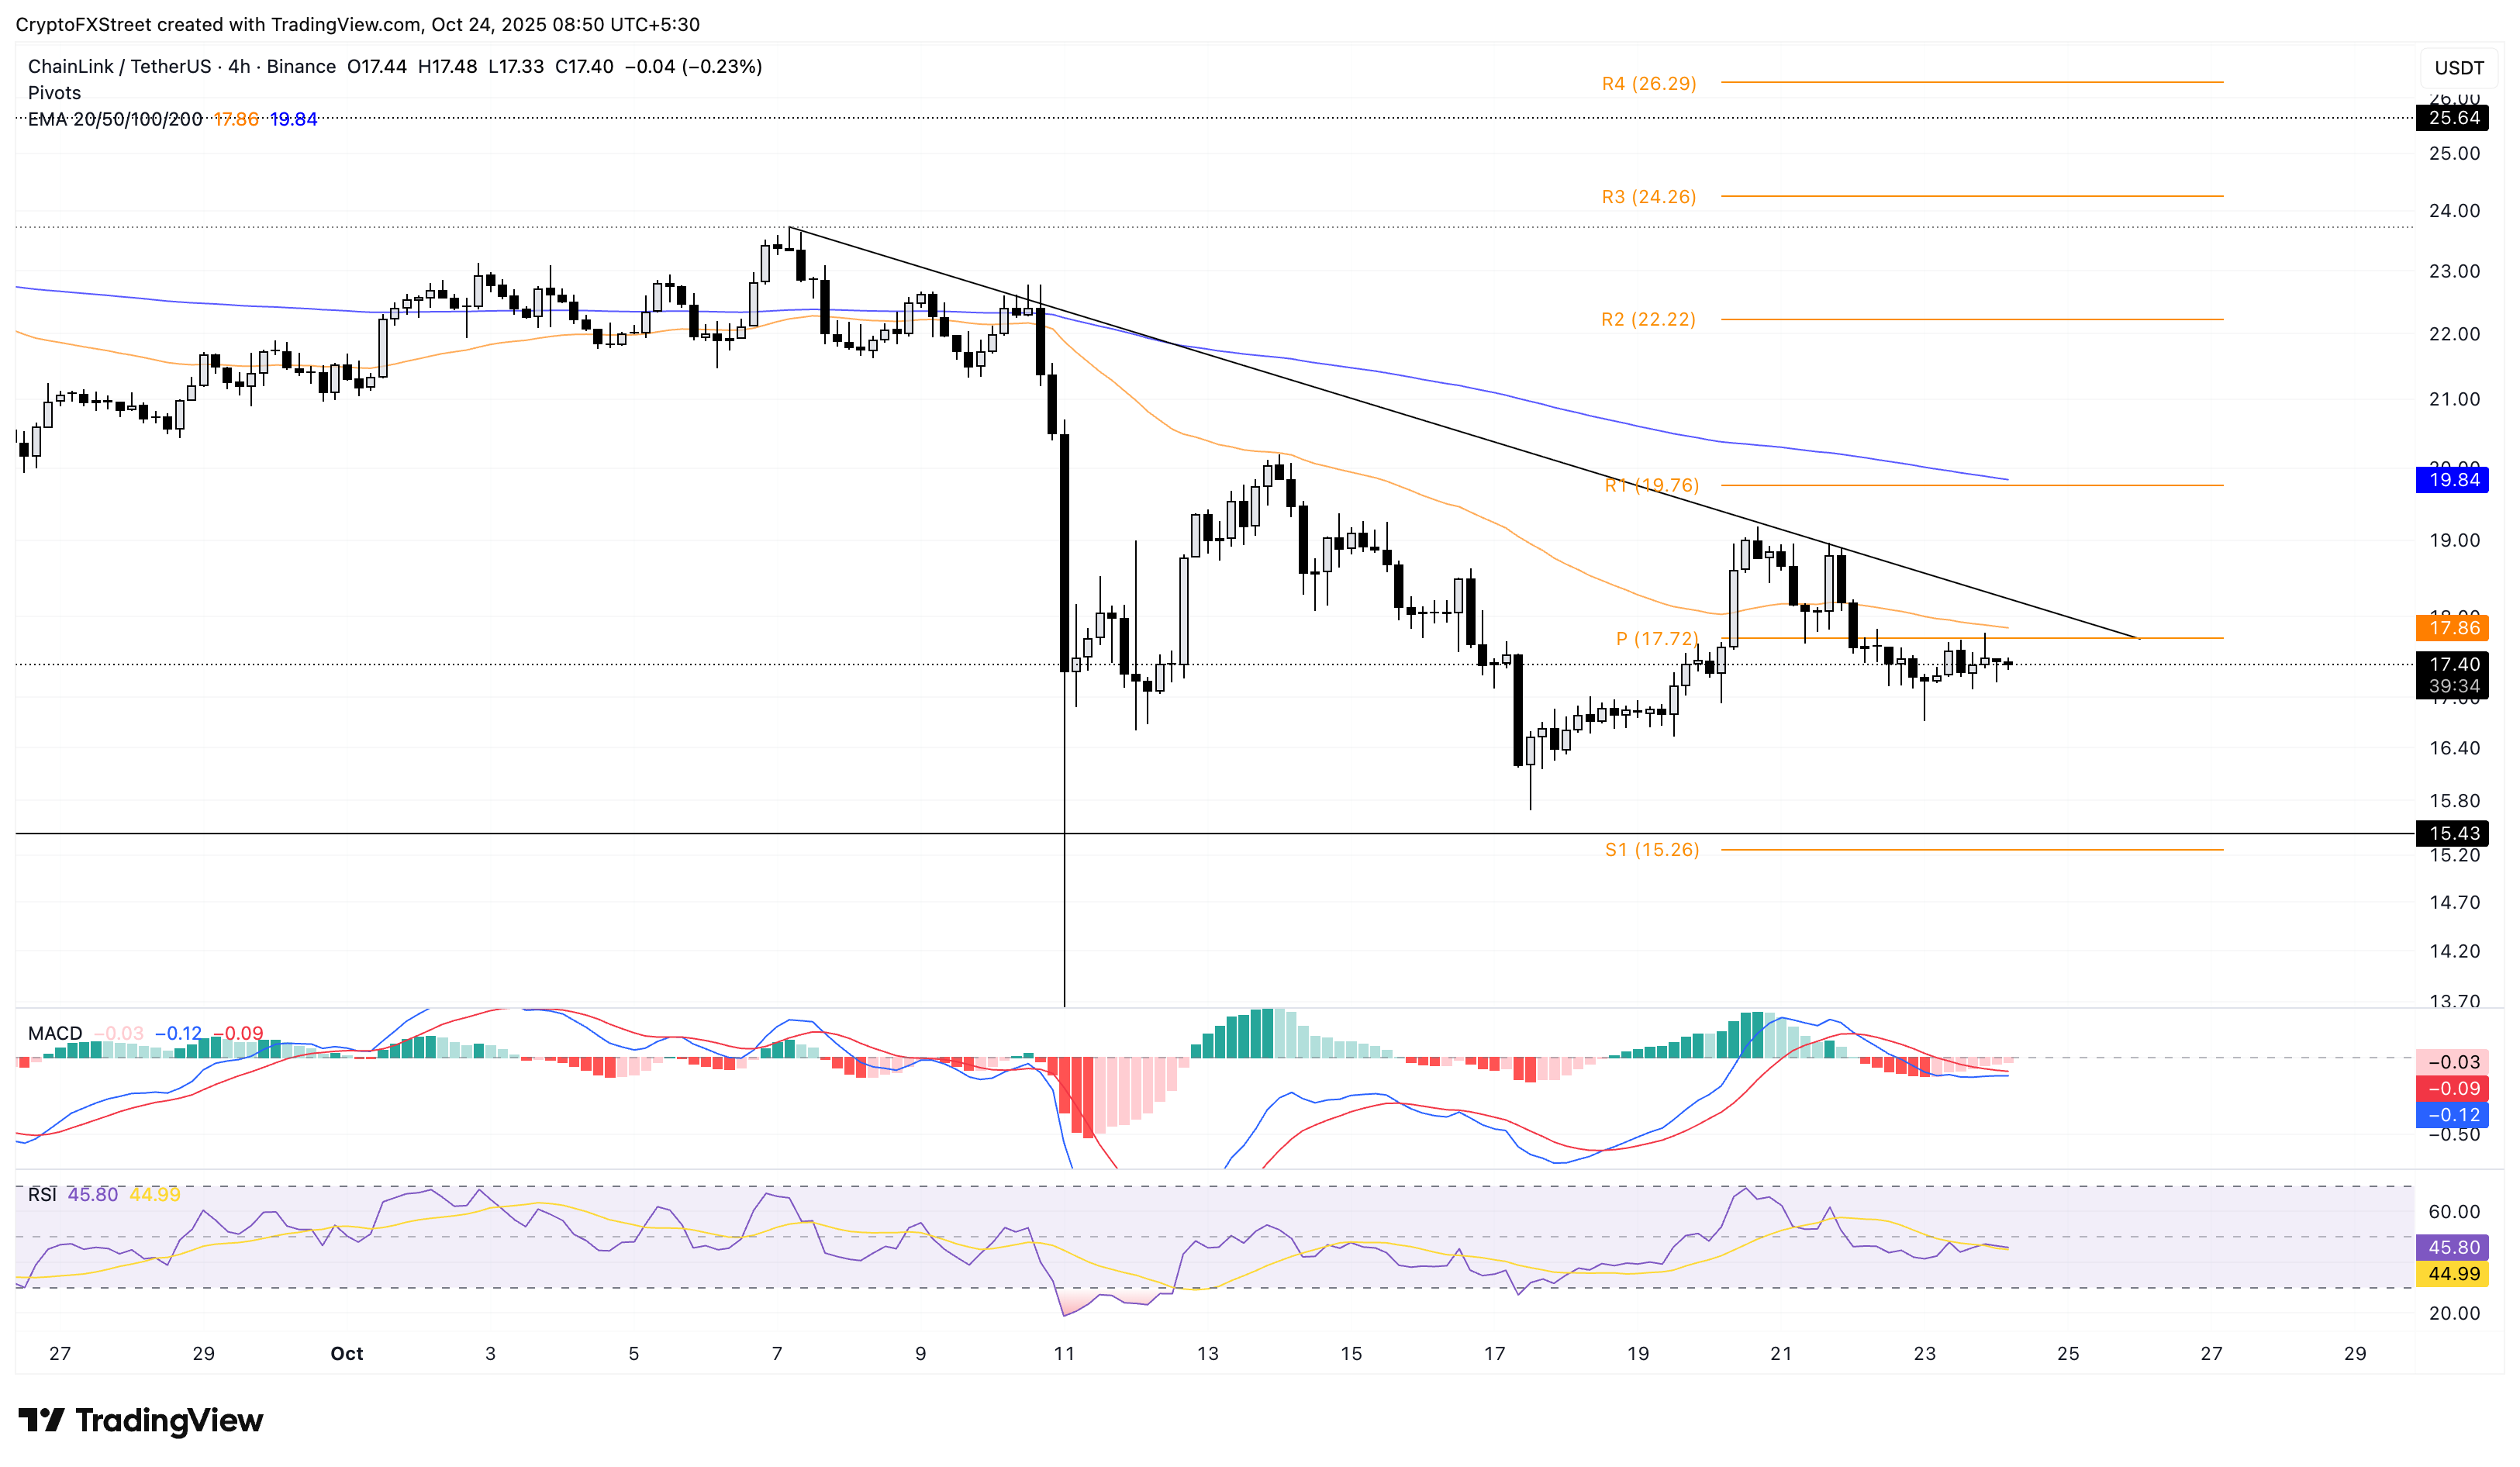
LINK/USDT 4-hour price chart.
To reinforce an uptrend, Chainlink must surpass the short-term resistance trendline near $18.00, potentially targeting the R1 Pivot Point at $19.76.

FXStreet
Lebih sejuta pengguna bergantung pada FXStreet untuk data pasaran masa nyata, alat carta, pandangan pakar dan berita Forex. Kalendar ekonomi yang komprehensif dan webinar pendidikan mereka membantu pedagang kekal bermaklumat dan membuat keputusan yang dikira. FXStreet disokong oleh pasukan kira-kira 60 profesional di ibu pejabat Barcelona dan pelbagai wilayah global.
Read More


