
Trade The World
Crypto Today: Bitcoin, Ethereum build breakout momentum, XRP lags amid mild ETF inflows
Oleh John Isige
Tarikh Diterbitkan: 13 Jan 2026 | Tarikh Diubah: 13 Jan 2026


POPULAR ARTICLES

Bitcoin (BTC) has risen, stepping above $92,000 at the time of writing on Tuesday, reflecting mild price increases across the crypto market.
- Bitcoin rises on Tuesday, reclaiming the $92,000 level, supported by ETF inflows and an improving technical structure.
- Ethereum records mild ETF inflows as bulls push for a potential breakout above the 50-day EMA.
- XRP struggles to recover from support at $2.00 despite steady demand for spot ETFs.
Bitcoin (BTC) has risen, stepping above $92,000 at the time of writing on Tuesday, reflecting mild price increases across the crypto market.
The leading altcoin by market capitalisation, Ethereum (ETH), is also edging higher above $3,100, while Ripple (XRP) remains stable above support at $2.00.
Bitcoin, Ethereum rebound as ETF inflows resume
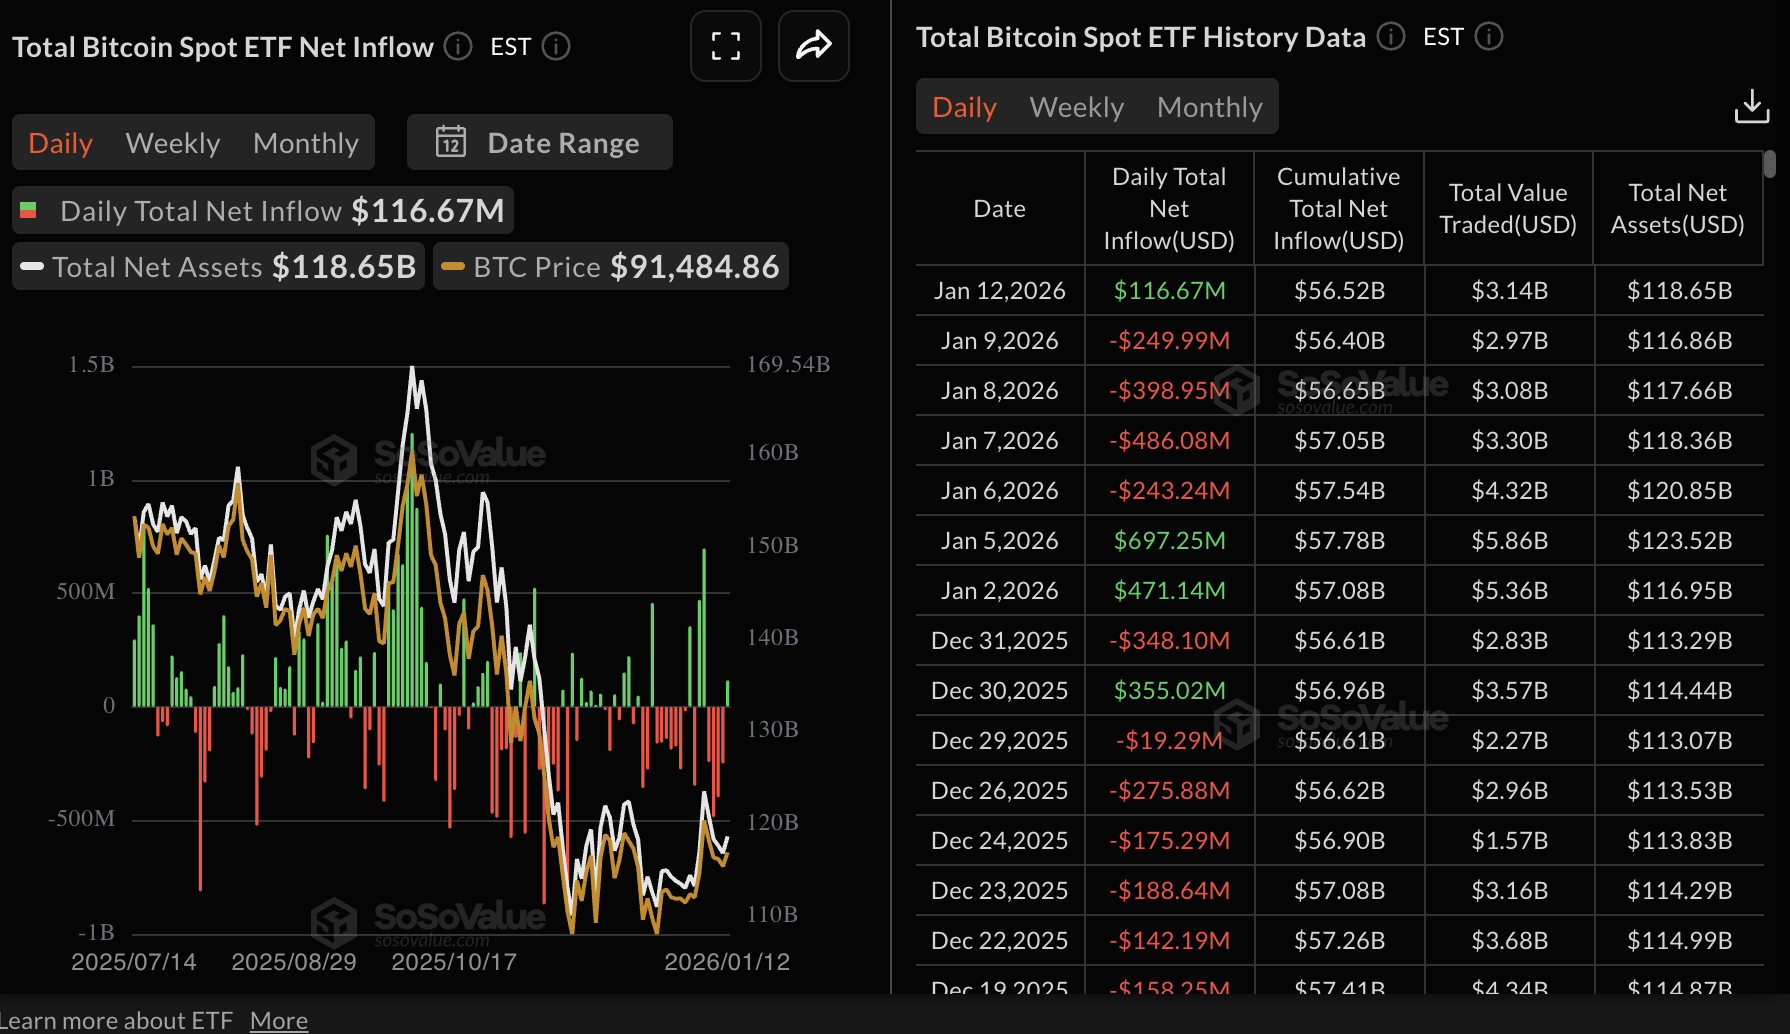
Bitcoin spot Exchange Traded Funds (ETFs) recorded inflows of approximately $117 million on Monday, ending four days of consecutive outflows. BlackRock’s IBIT ETF was the best-performing product, drawing nearly $112 million in inflows, followed by Grayscale’s GBTC with approximately $64 million.
The cumulative inflow volume stands at $56.25 billion and net assets at $118.65 billion. Steady inflows could shape positive sentiment around Bitcoin, but if outflows come back, risk-off mood may continue to weigh on BTC in the short term.
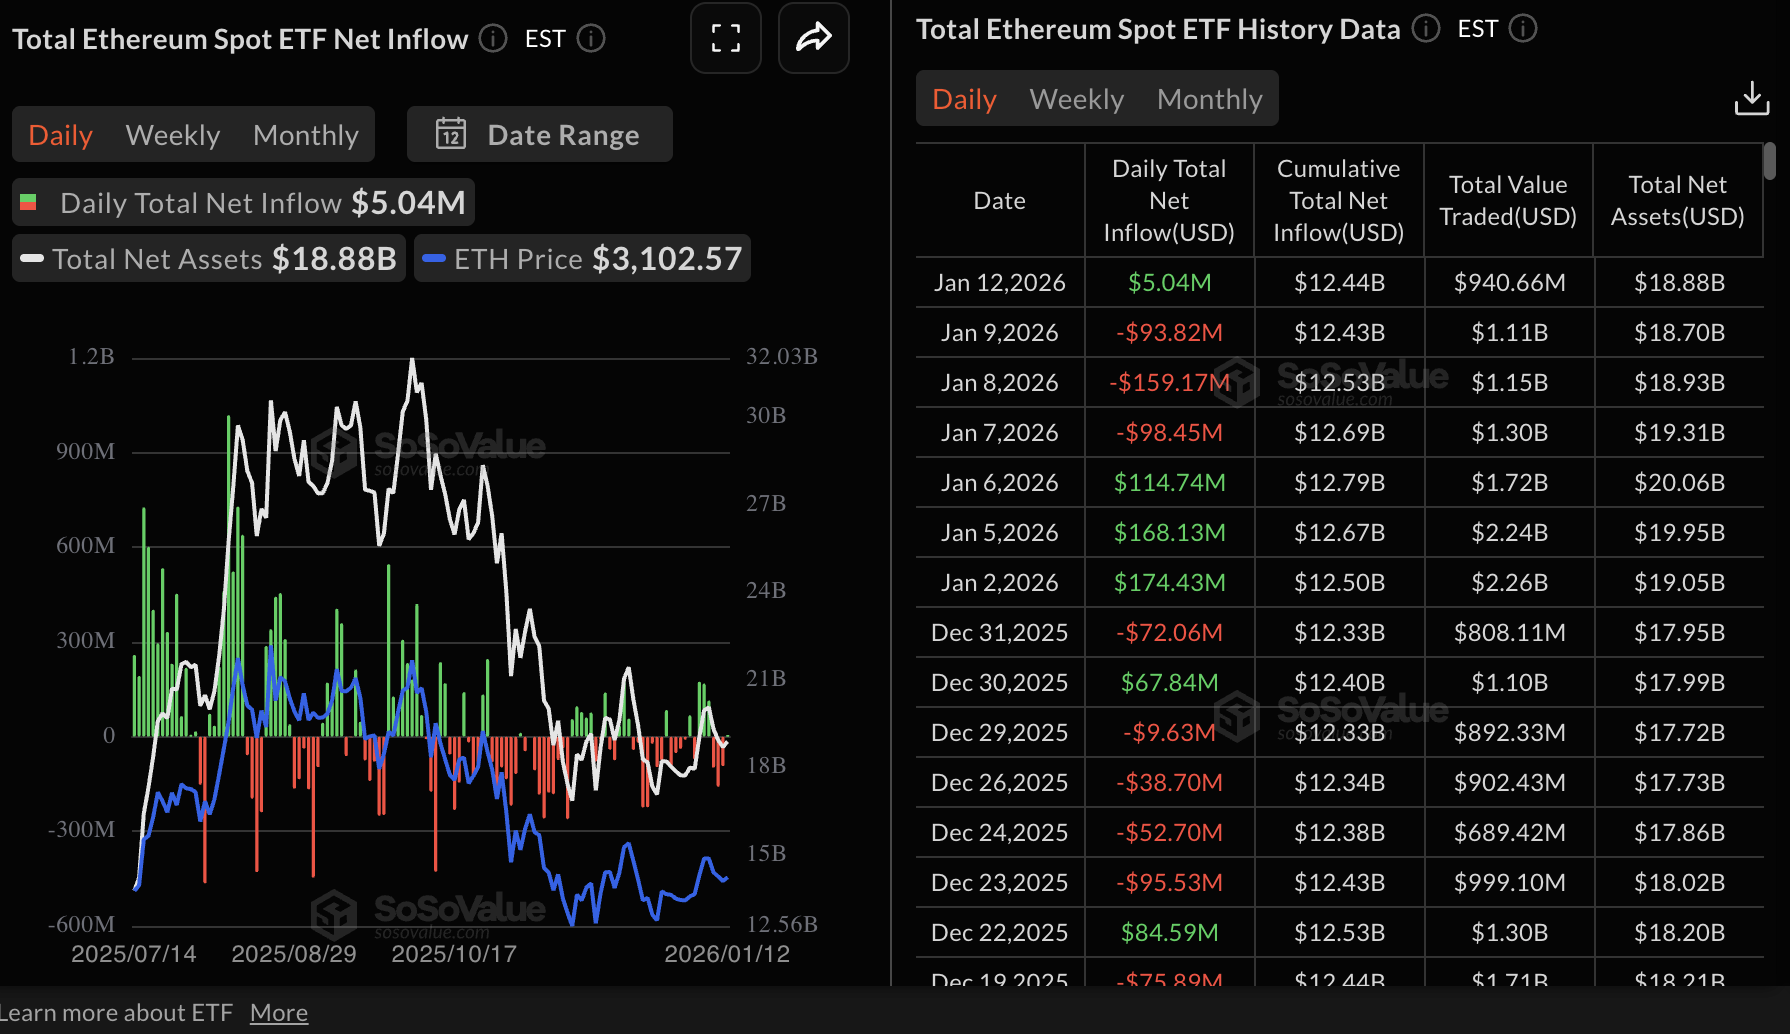
Ethereum spot ETFs listed in the US posted mild inflows of approximately $5 million on Monday following three consecutive days of outflows. Grayscales’ ETHE emerged as the top-performing ETF, with almost $51 million in inflows. The cumulative inflow volume stands at $12.44 billion and net assets at $18.88 billion, according to SoSoValue data.
Meanwhile, XRP spot ETFs extended their inflow streak for the third consecutive day after drawing $15 million on Monday. Bitwise’s XRP ETF led with nearly $8 million in inflows, followed by Franklin Templeton’s XRPZ with approximately $4.5 million. None of the five XRP ETFs recorded outflows on Monday, bringing the cumulative inflow to $1.23 billion and net assets to $1.47 billion.
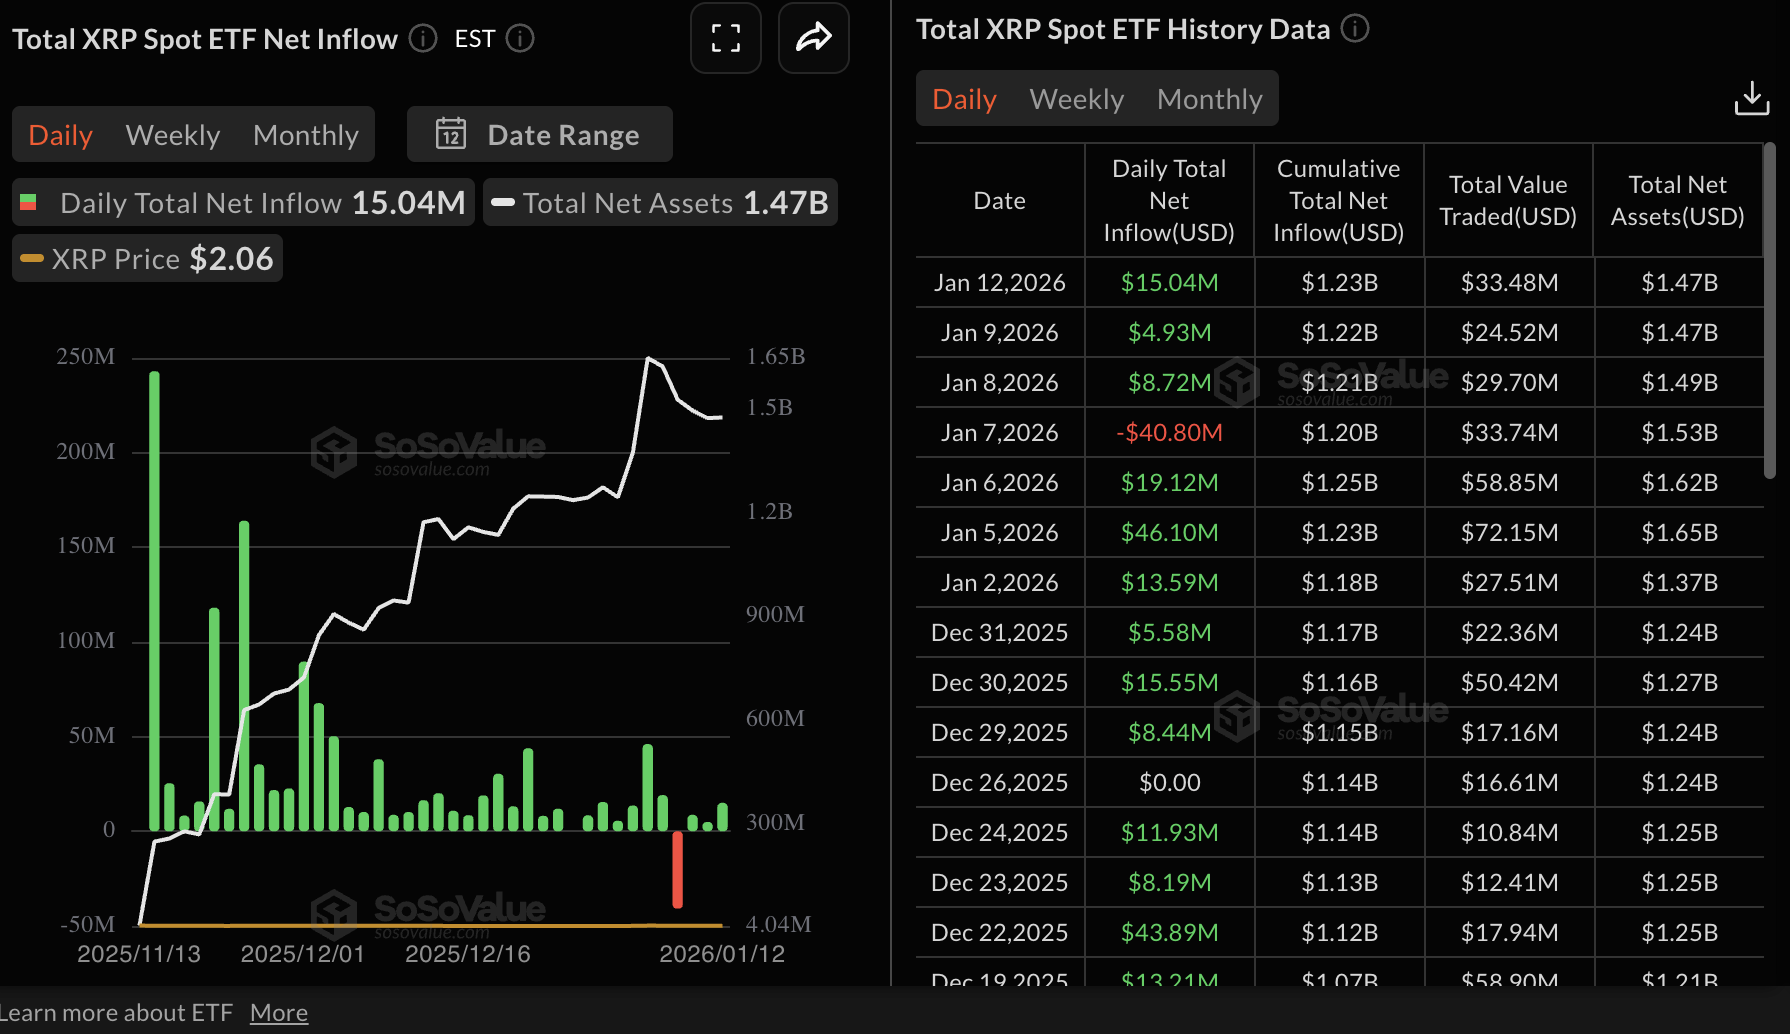
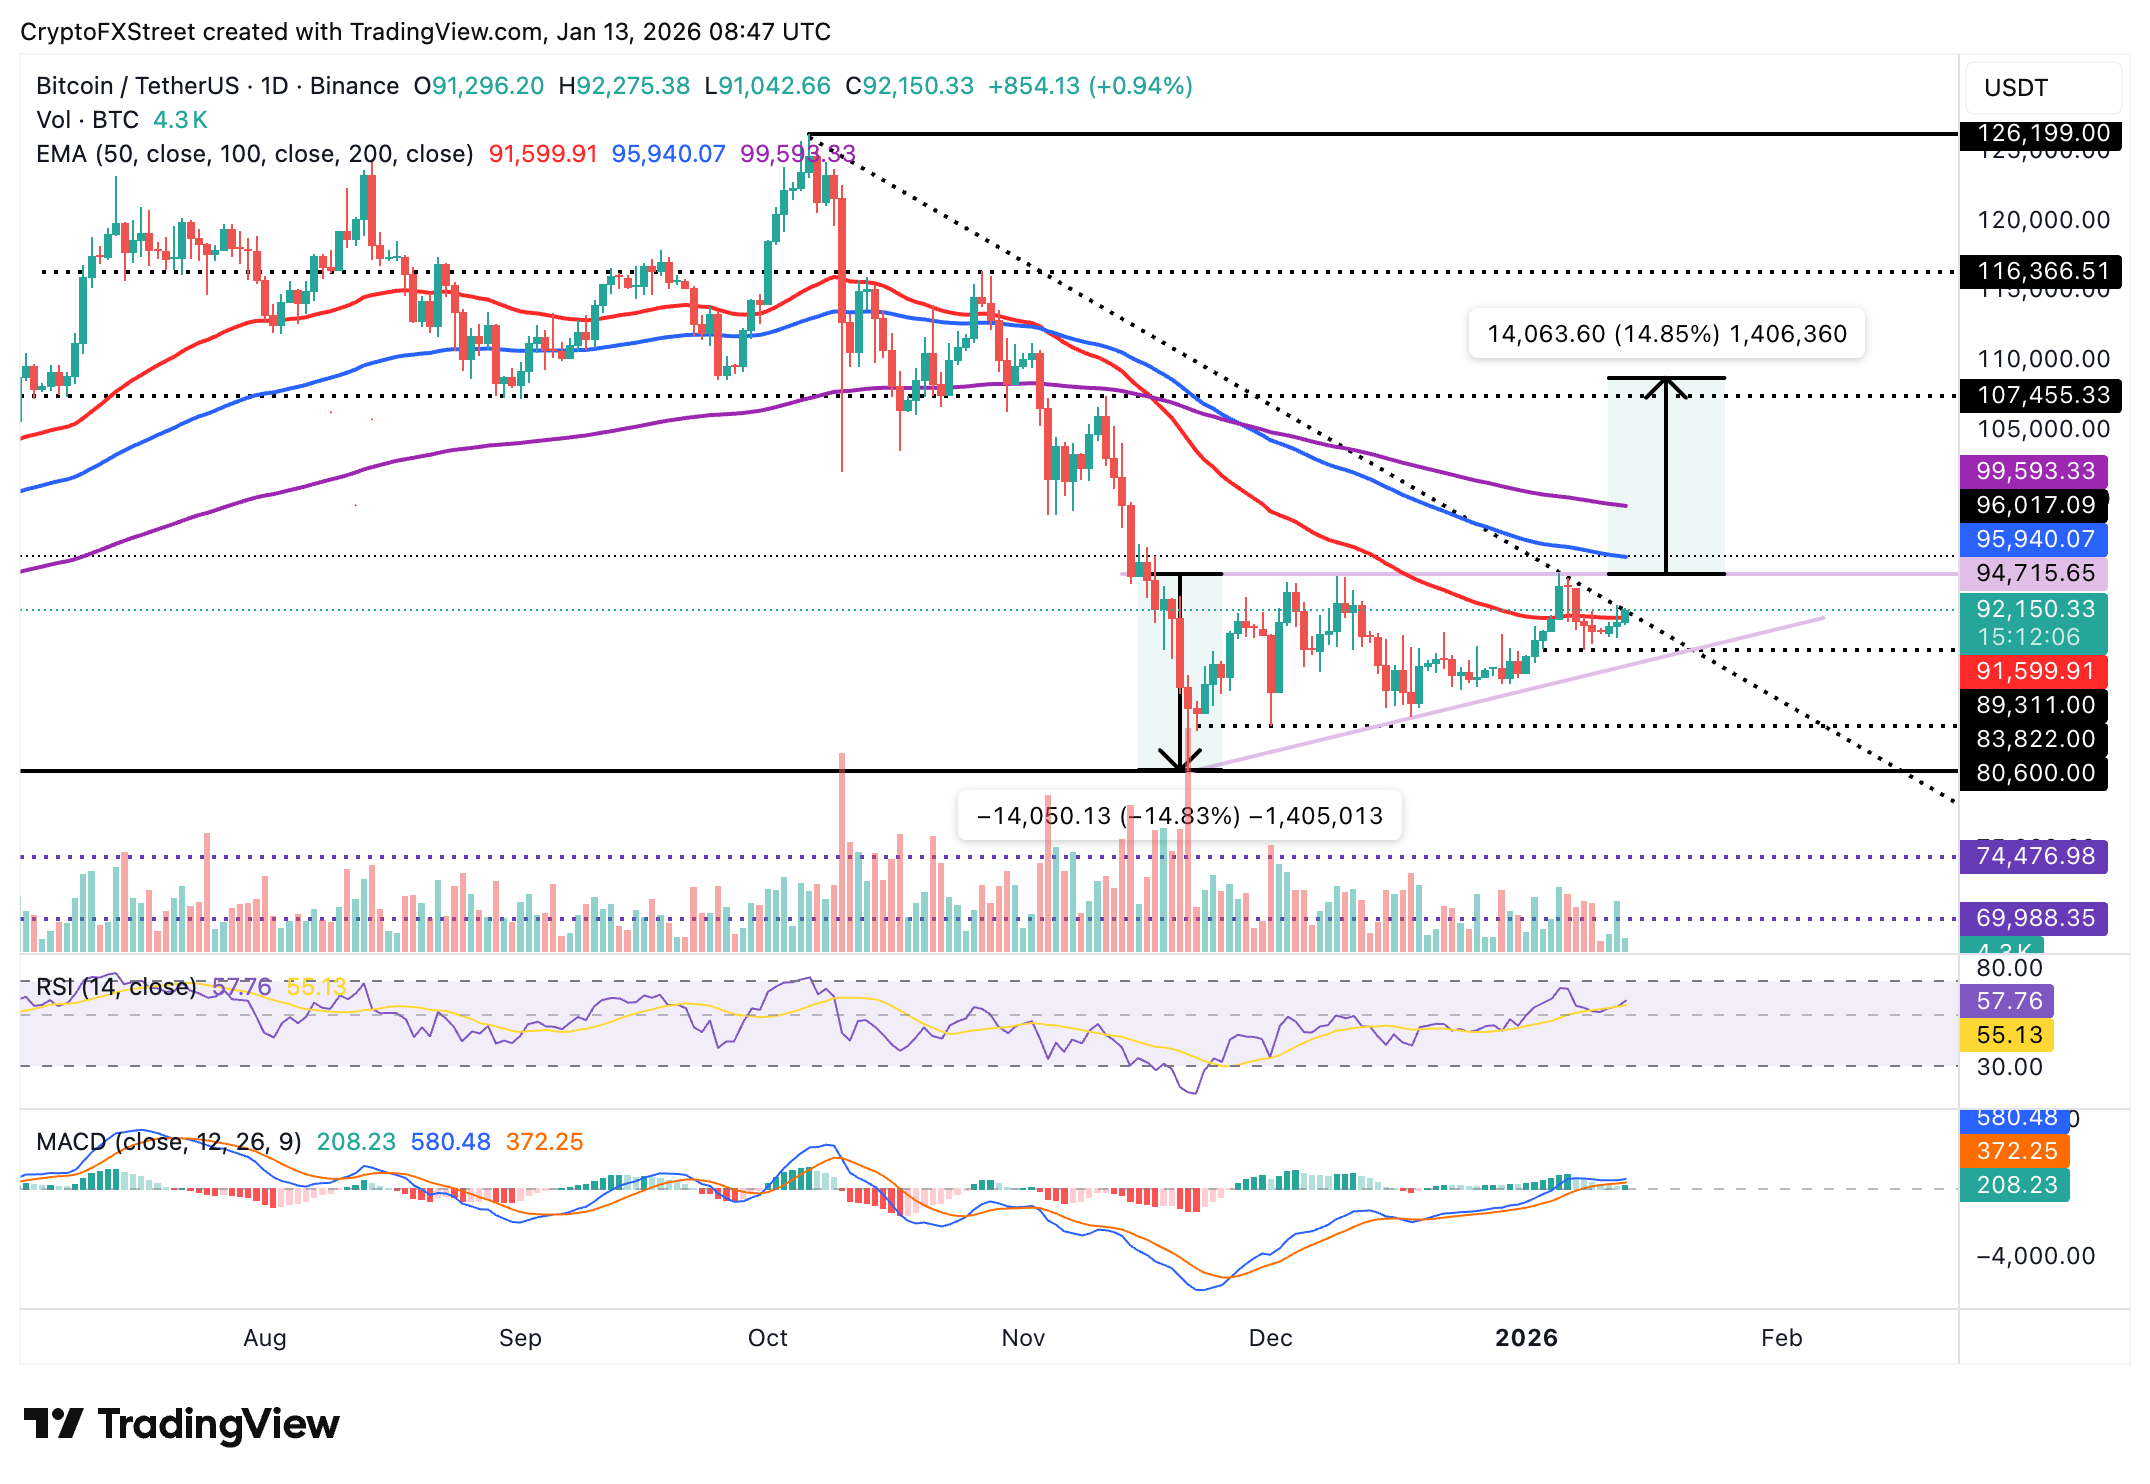
Chart of the day: Bitcoin edges higher amid breakout signals
Bitcoin is trading above $92,000 at the time of writing on Tuesday, while holding above the 50-day Exponential Moving Average (EMA), providing immediate support at $91,600.
The Relative Strength Index (RSI) on the daily chart, at 58, is rising in tandem with the price, indicating that bullish momentum is steadying. Higher RSI readings toward the overbought territory would increase the odds of a technical breakout above $100,000.
The Moving Average Convergence Divergence (MACD) indicator on the same daily chart supports Bitcoin’s short-term bullish outlook. Traders would be prompted to lean into risk if the blue MACD line remains above the red signal line while the green histogram continues to expand.
A close above the descending trendline from the record high of $126,199 would reinforce the bullish grip and point Bitcoin toward the 100-day EMA resistance at $95,940 and the 200-day EMA at $99,593.
Still, profit-taking could snuff out short-term gains, resulting in a correction below the 50-day EMA. Closing below this moving average may increase the chances of BTC correcting below $90,000.
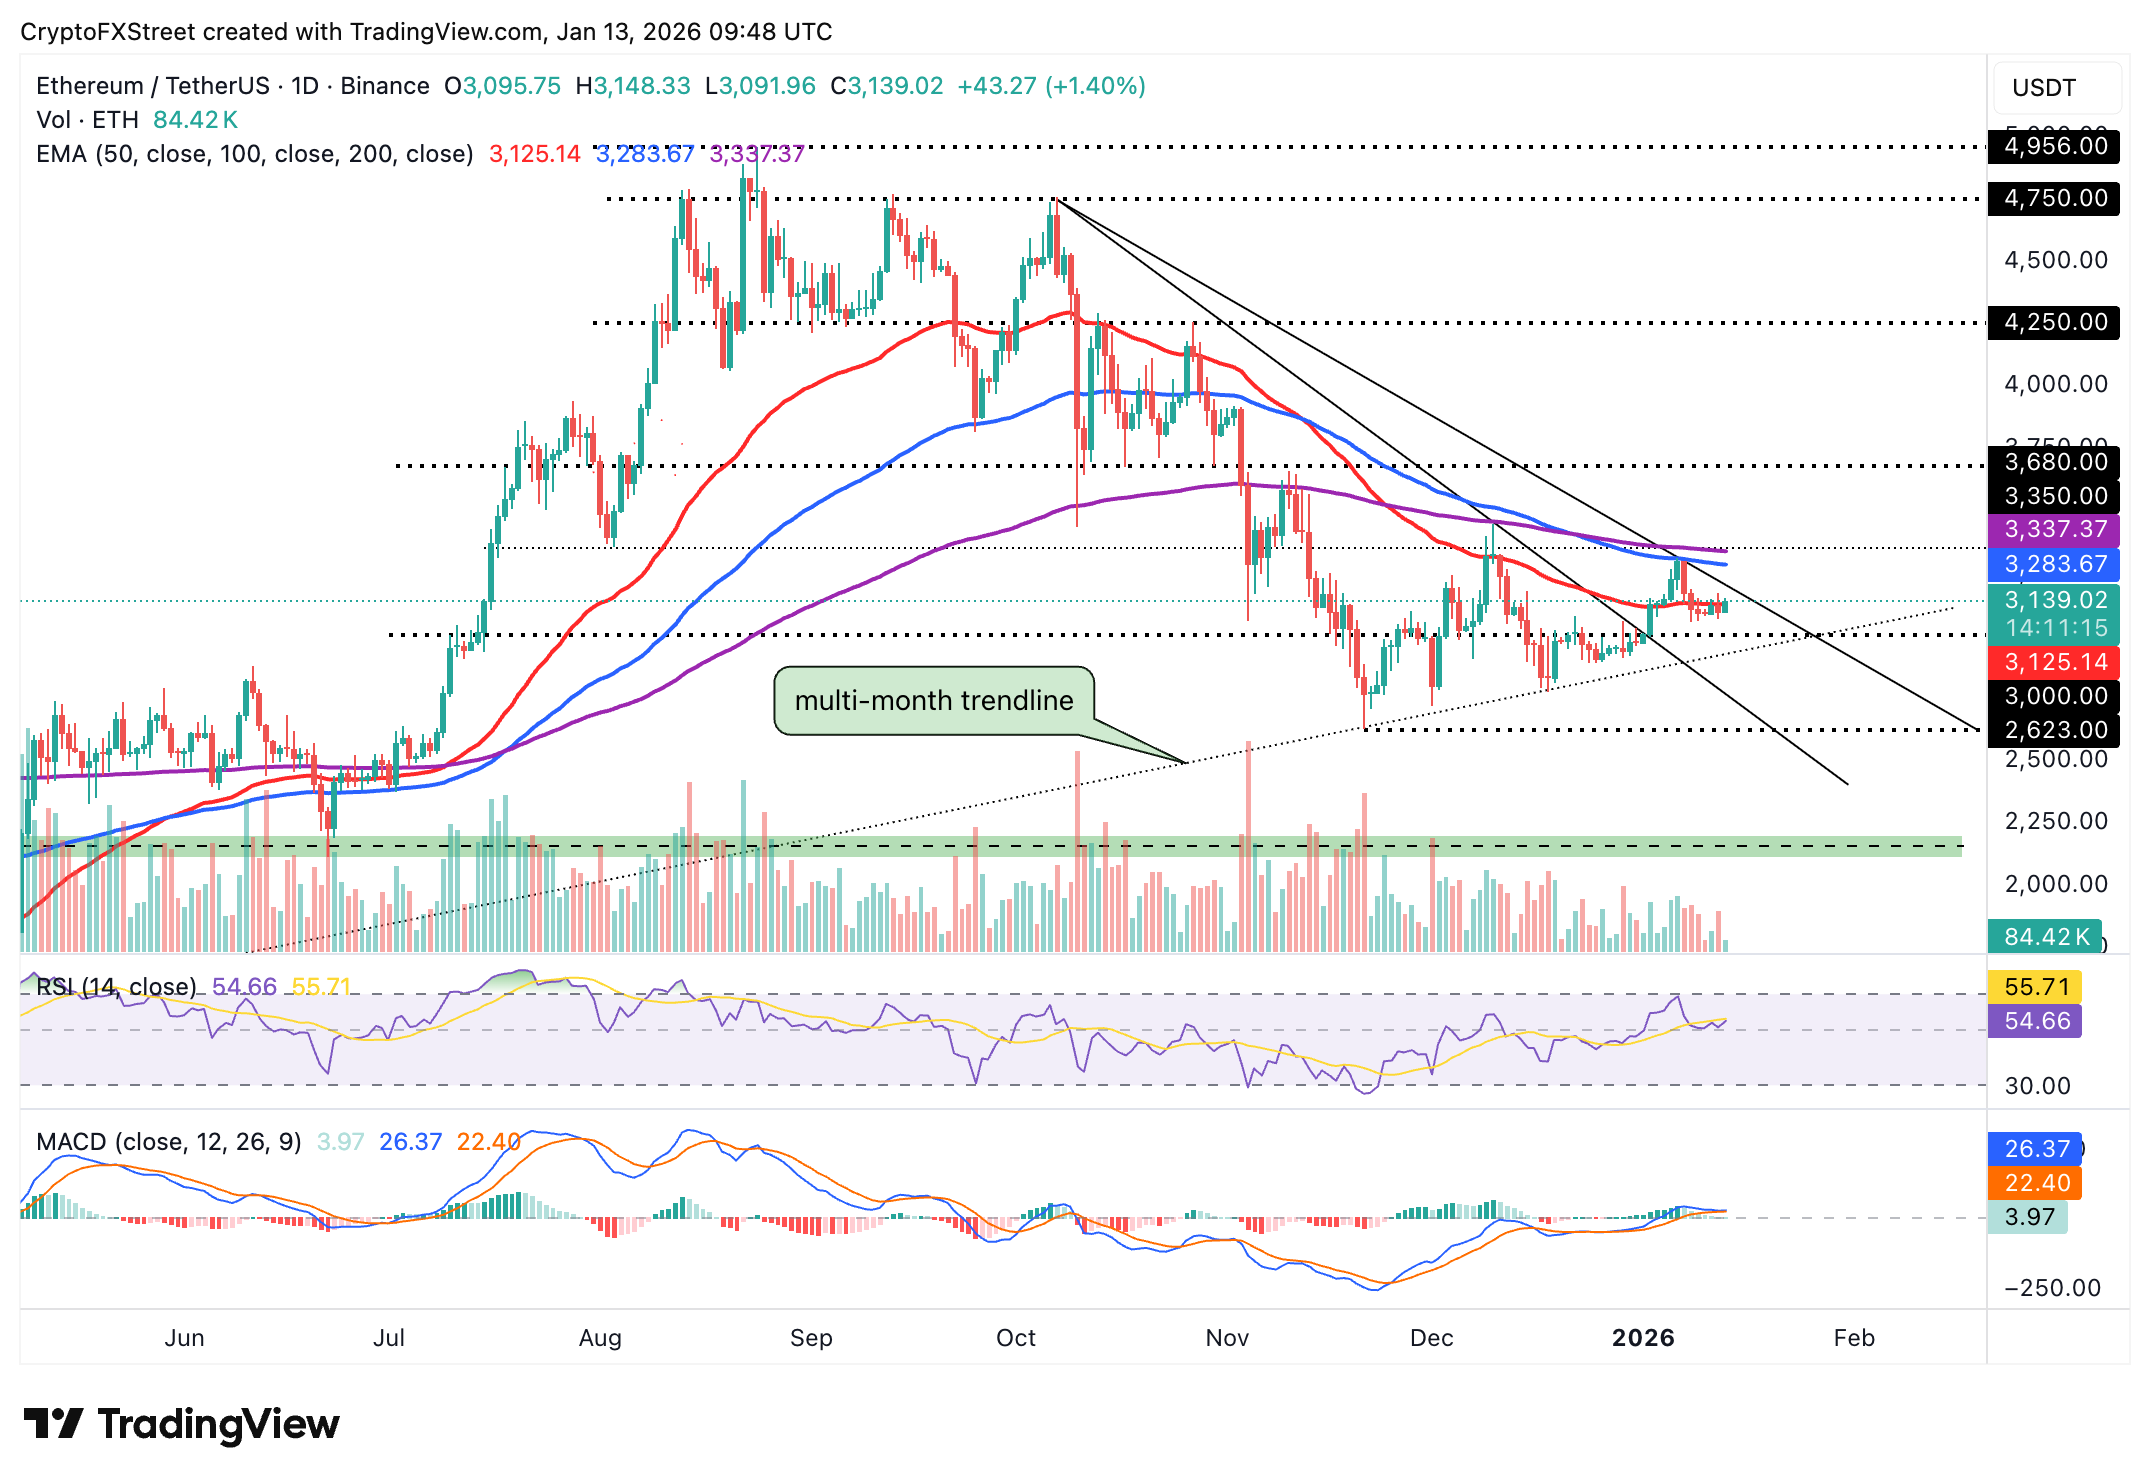
Altcoins technical outlook: Ethereum gains momentum as XRP holds support
Ethereum is trading above $3,100 at the time of writing on Tuesday. The 50-day EMA at $3,125 anchors the smart contracts token, likely to extend the rebound, with a descending trendline as highlighted on the daily chart.
The RSI has risen from the midline to 54 on the same chart, suggesting that bullish momentum is gradually increasing. The MACD indicator supports price stability with a slight positive divergence. However, traders should watch for an expanding histogram above the mean line to confirm the bullish momentum.
A close above the descending trendline resistance would increase the odds of a breakout toward the 100-day EMA at $3,283 and the 200-day EMA at $3,337. Conversely, losing the 50-day EMA as the immediate support may lead to a 4% decline to $3,000.
As for XRP, the price is above support at $2.00 but remains below the 50-day EMA resistance at $2.07. The RSI has stabilised above the midline on the daily chart, suggesting that bulls have a slight edge over bears. However, the MACD indicator on the same chart is poised to flash a sell signal if the blue line crosses below the red line.
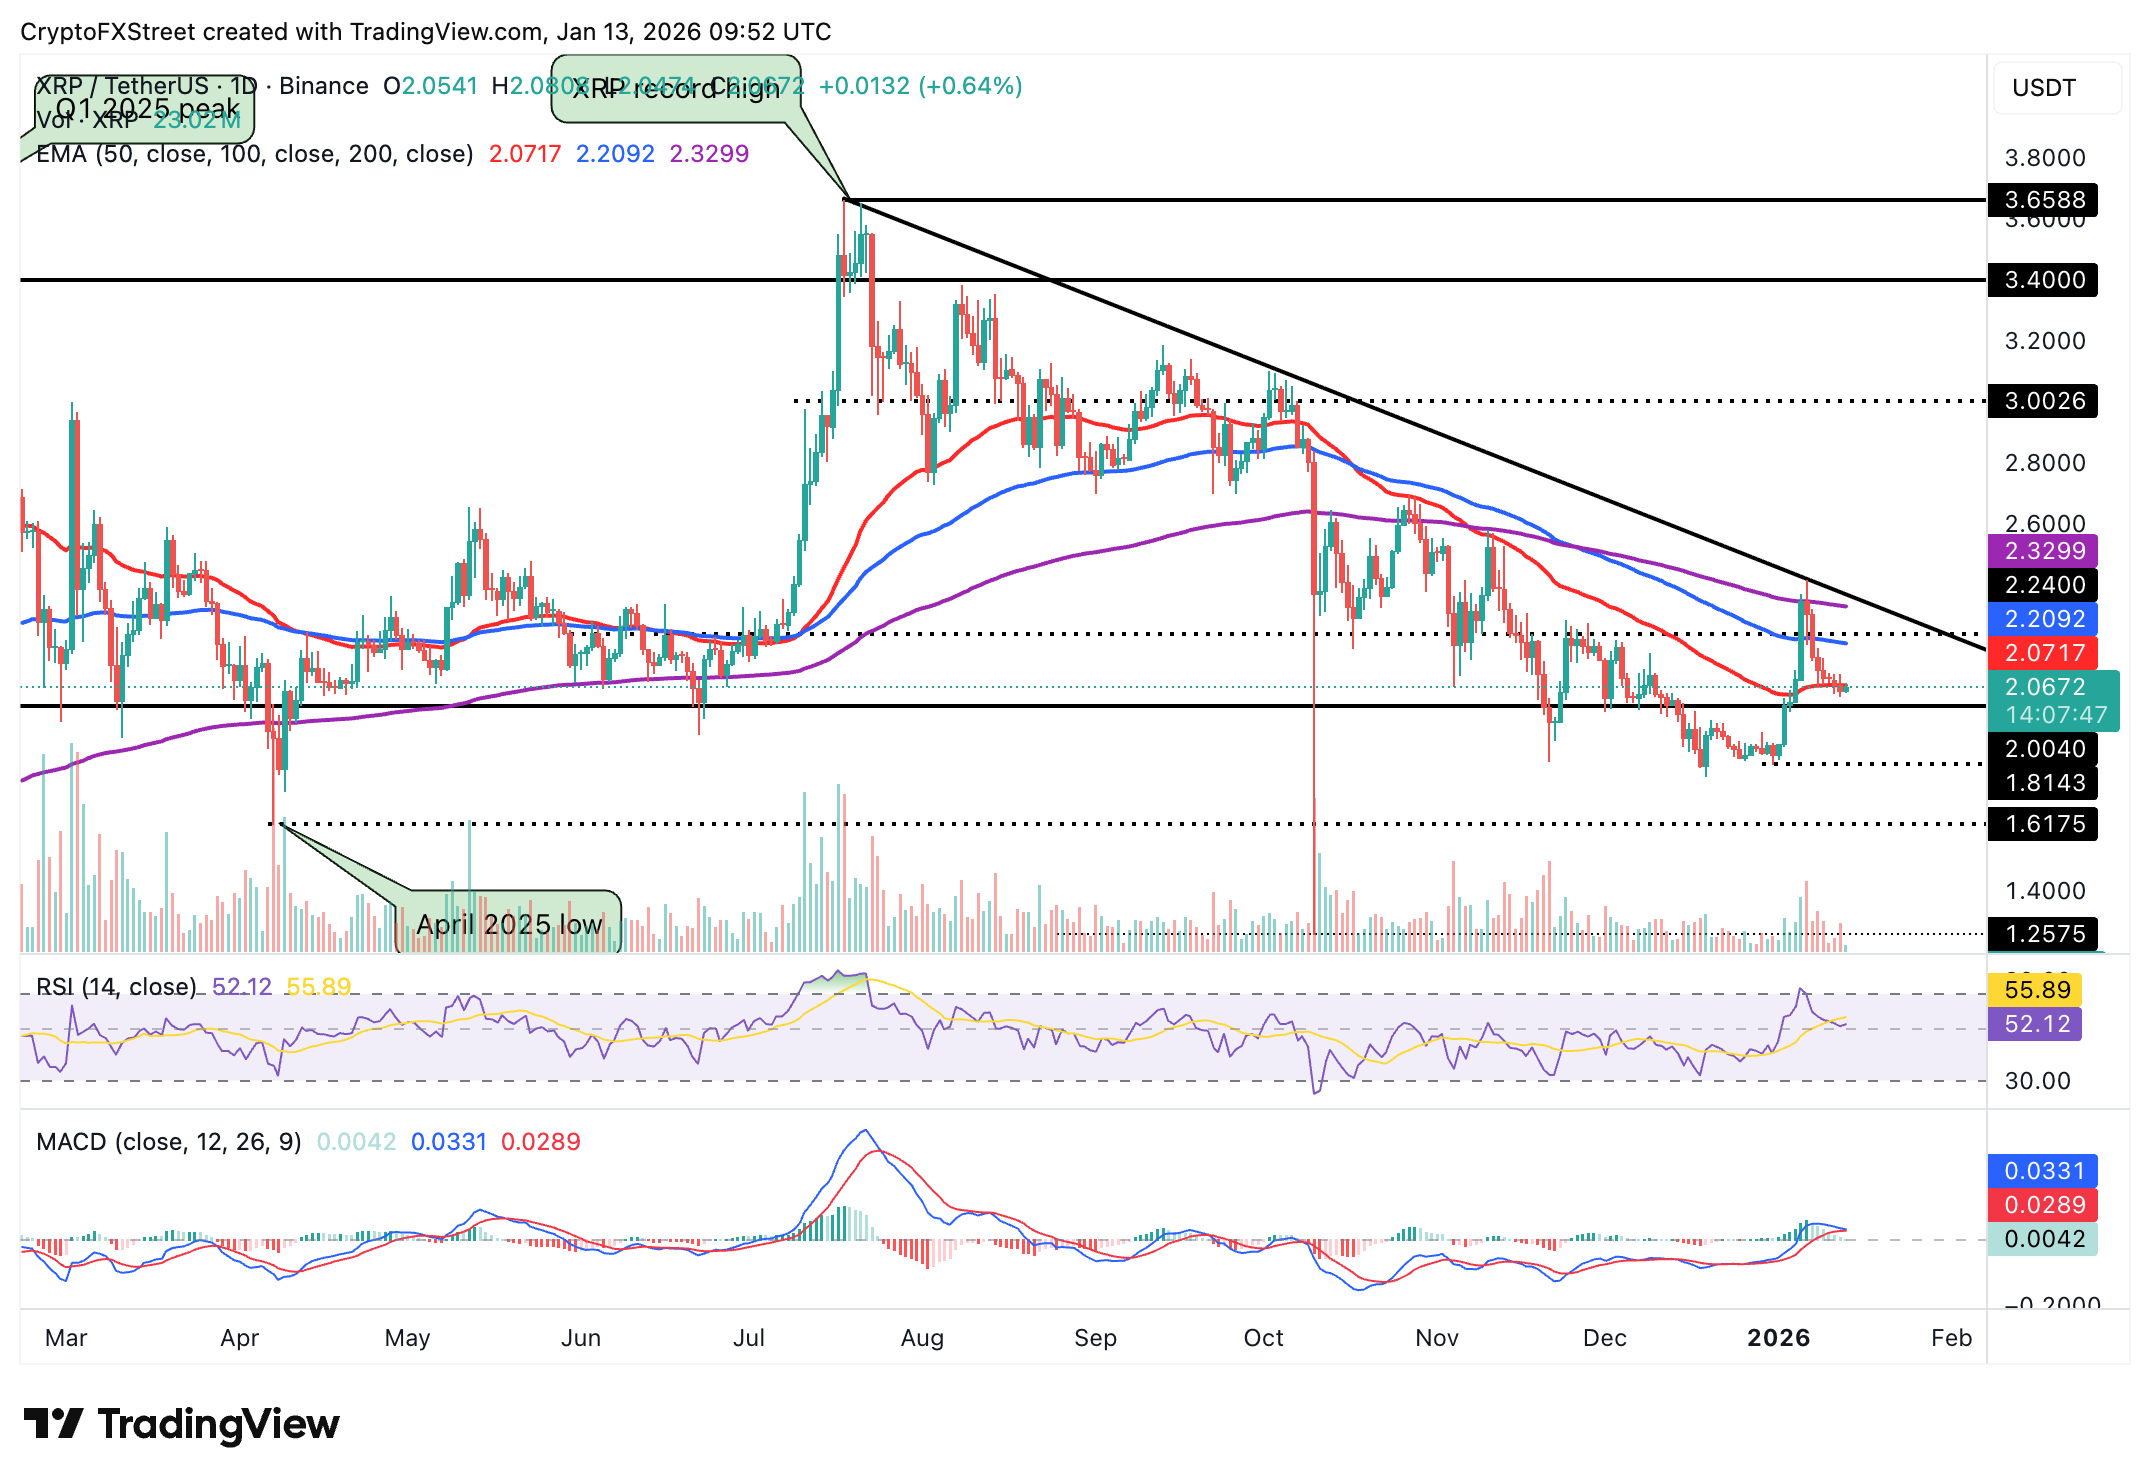
XRP should close above the 50-day EMA to validate its bullish potential for a 9% move to test the 100-day EMA hurdle at $2.21. Still, XRP may resume its downtrend below $2.00 if selling pressure intensifies in the broader crypto market.
Crypto ETF FAQs
An Exchange-Traded Fund (ETF) is an investment vehicle or an index that tracks the price of an underlying asset. ETFs can not only track a single asset, but a group of assets and sectors. For example, a Bitcoin ETF tracks Bitcoin’s price. ETF is a tool used by investors to gain exposure to a certain asset.
Yes. The first Bitcoin futures ETF in the US was approved by the US Securities & Exchange Commission in October 2021. A total of seven Bitcoin futures ETFs have been approved, with more than 20 still waiting for the regulator’s permission. The SEC says that the cryptocurrency industry is new and subject to manipulation, which is why it has been delaying crypto-related futures ETFs for the last few years.
Yes. The SEC approved in January 2024 the listing and trading of several Bitcoin spot Exchange-Traded Funds, opening the door to institutional capital and mainstream investors to trade the main crypto currency. The decision was hailed by the industry as a game changer.
The main advantage of crypto ETFs is the possibility of gaining exposure to a cryptocurrency without ownership, reducing the risk and cost of holding the asset. Other pros are a lower learning curve and higher security for investors since ETFs take charge of securing the underlying asset holdings. As for the main drawbacks, the main one is that as an investor you can’t have direct ownership of the asset, or, as they say in crypto, “not your keys, not your coins.” Other disadvantages are higher costs associated with holding crypto since ETFs charge fees for active management. Finally, even though investing in ETFs reduces the risk of holding an asset, price swings in the underlying cryptocurrency are likely to be reflected in the investment vehicle too.

FXStreet
Lebih sejuta pengguna bergantung pada FXStreet untuk data pasaran masa nyata, alat carta, pandangan pakar dan berita Forex. Kalendar ekonomi yang komprehensif dan webinar pendidikan mereka membantu pedagang kekal bermaklumat dan membuat keputusan yang dikira. FXStreet disokong oleh pasukan kira-kira 60 profesional di ibu pejabat Barcelona dan pelbagai wilayah global.
Read More


