
Trade The World
EUR/JPY Price Forecast: Tests confluence support zone around 177.00, nine-day EMA
Oleh Akhtar Faruqui
Tarikh Diterbitkan: 29 Oct 2025 | Tarikh Diubah: 29 Oct 2025


POPULAR ARTICLES

EUR/JPY extends its losses for the second successive day, trading around 177.10 during the European hours on Wednesday.
- EUR/JPY tests support zone around the crucial level of 177.00 and the nine-day EMA of 176.94.
- The 14-day Relative Strength Index falls toward the 50 mark, indicating an ongoing downward correction.
- The initial resistance lies at the record high of 178.23.
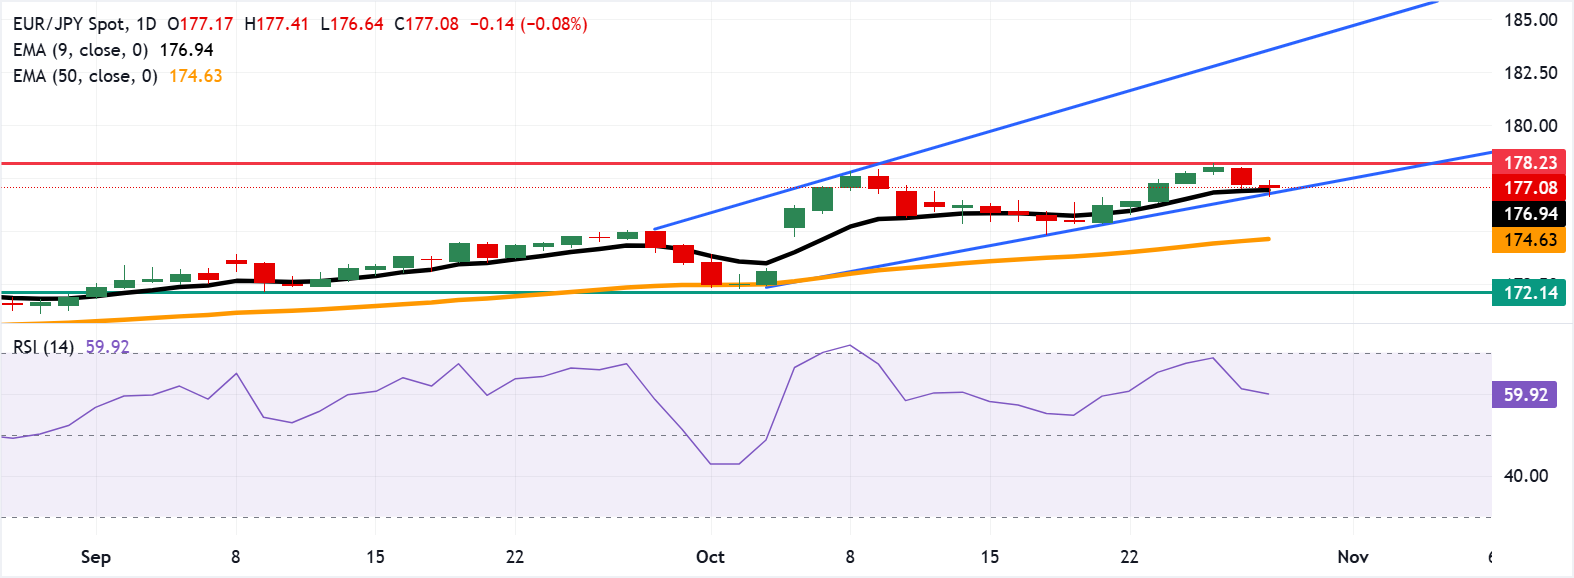
EUR/JPY extends its losses for the second successive day, trading around 177.10 during the European hours on Wednesday. The technical analysis of the daily chart suggests that the currency cross treads water slightly above the confluence support zone around the nine-day Exponential Moving Average (EMA) and lower boundary of the ascending channel pattern. Further declines would indicate weakening of a prevailing bullish bias.
The short-term price momentum is stronger as the EUR/JPY cross remains above the nine-day EMA. The 14-day Relative Strength Index (RSI) falls toward the 50 mark after pulling back from overbought territory, signaling an ongoing downward corrective move. However, the bullish bias persists until it remains above the 50 level.
The EUR/JPY cross is testing its immediate support at the psychological level of 177.00, followed by the nine-day EMA of 176.94 and the ascending channel’s lower boundary around 176.80. A break below this confluence support zone would undermine the short-term bullish momentum, potentially putting downward pressure on the currency pair toward the 50-day EMA region near 174.63. Further declines would prompt the currency cross to approach the seven-week low of 172.14, which was recorded on September 9.
On the upside, the EUR/JPY cross may target the record high of 178.23, reached on October 27. A break above this level would open the doors for the currency cross to explore the region around the upper boundary of the ascending channel around 183.60.
EUR/JPY: Daily Chart
Euro Price Today
The table below shows the percentage change of Euro (EUR) against listed major currencies today. Euro was the weakest against the Australian Dollar.
| USD | EUR | GBP | JPY | CAD | AUD | NZD | CHF | |
|---|---|---|---|---|---|---|---|---|
| USD | 0.24% | 0.52% | 0.18% | -0.01% | -0.11% | 0.12% | 0.45% | |
| EUR | -0.24% | 0.29% | -0.05% | -0.24% | -0.36% | -0.12% | 0.21% | |
| GBP | -0.52% | -0.29% | -0.34% | -0.53% | -0.64% | -0.40% | -0.08% | |
| JPY | -0.18% | 0.05% | 0.34% | -0.19% | -0.30% | -0.06% | 0.26% | |
| CAD | 0.00% | 0.24% | 0.53% | 0.19% | -0.12% | 0.12% | 0.45% | |
| AUD | 0.11% | 0.36% | 0.64% | 0.30% | 0.12% | 0.24% | 0.57% | |
| NZD | -0.12% | 0.12% | 0.40% | 0.06% | -0.12% | -0.24% | 0.33% | |
| CHF | -0.45% | -0.21% | 0.08% | -0.26% | -0.45% | -0.57% | -0.33% |
The heat map shows percentage changes of major currencies against each other. The base currency is picked from the left column, while the quote currency is picked from the top row. For example, if you pick the Euro from the left column and move along the horizontal line to the US Dollar, the percentage change displayed in the box will represent EUR (base)/USD (quote).

FXStreet
Lebih sejuta pengguna bergantung pada FXStreet untuk data pasaran masa nyata, alat carta, pandangan pakar dan berita Forex. Kalendar ekonomi yang komprehensif dan webinar pendidikan mereka membantu pedagang kekal bermaklumat dan membuat keputusan yang dikira. FXStreet disokong oleh pasukan kira-kira 60 profesional di ibu pejabat Barcelona dan pelbagai wilayah global.
Read More


