
Trade The World
Stellar Price Forecast: XLM shows early signs of recovery as bullish sentiment returns in the derivatives market
Oleh Manish Chhetri
Tarikh Diterbitkan: 23 Oct 2025 | Tarikh Diubah: 23 Oct 2025


POPULAR ARTICLES

Stellar (XLM) price trades in green above $0.30 at the time of writing on Thursday after finding support near the lower boundary of a falling wedge pattern on the daily chart. Derivatives data hints at a rebound ahead as funding rates turn positive and bullish bets among traders are rising.
- Stellar price finds support near the lower boundary of a falling wedge pattern, hinting at a potential rebound.
- Derivatives data indicate improving sentiment, with funding rates turning positive and bullish positions rising.
- The technical outlook suggests fading bearish momentum, reinforcing the potential for a short-term recovery.
Stellar (XLM) price trades in green above $0.30 at the time of writing on Thursday after finding support near the lower boundary of a falling wedge pattern on the daily chart. Derivatives data hints at a rebound ahead as funding rates turn positive and bullish bets among traders are rising. On the technical side, early signs of fading bearish momentum suggest a recovery on the horizon.
Stellar’s derivatives data shows a bullish bias
CoinGlass’s OI-Weighted Funding Rate data shows that the number of traders betting that the price of Stellar will slide further is lower than those anticipating a price increase.
The metric has turned positive and reads 0.0011% on Thursday, indicating that longs are paying shorts. Historically, as shown in the chart below, when the funding rates have flipped from negative to positive, the XLM price has rallied.
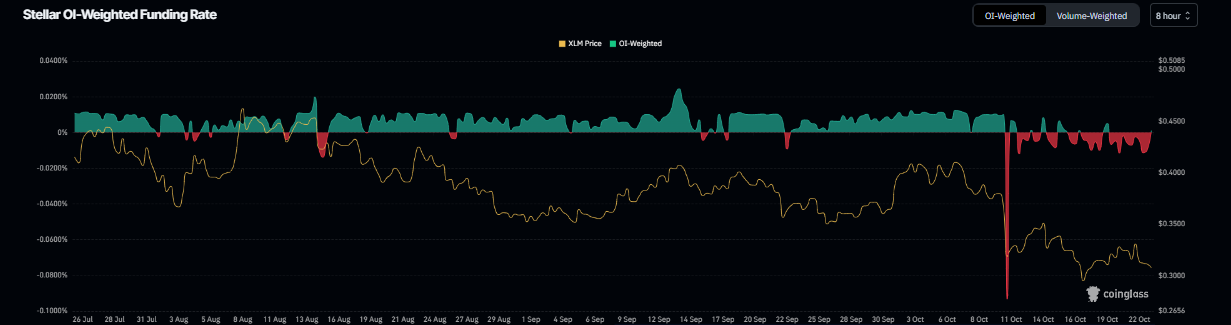
Stellar funding rate chart. Source: Coinglass
Apart from the positive funding rates, Stellar bullish bets are rising among traders. Coinglass’s long-to-short ratio for XLM reads 1.14 on Thursday, the highest level over a month, supporting the bullish sentiment.
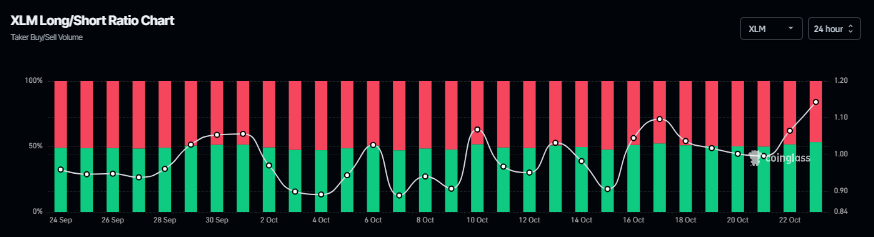
XLM long-to-short chart. Source: Coinglass
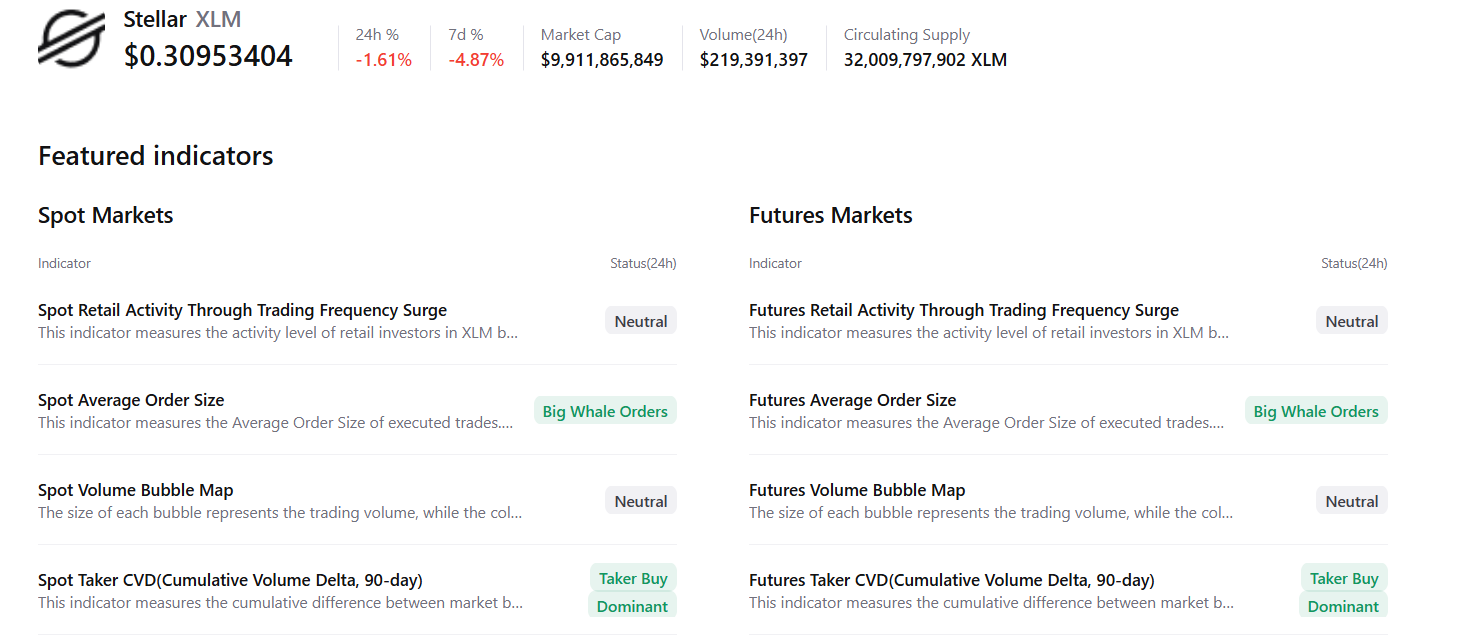
CryptoQuant’s summary data supports the bullish outlook, as XLM’s spot and futures market activity are showing big whale orders and buy dominance, signaling a potential rally ahead.
Stellar’s growing developments
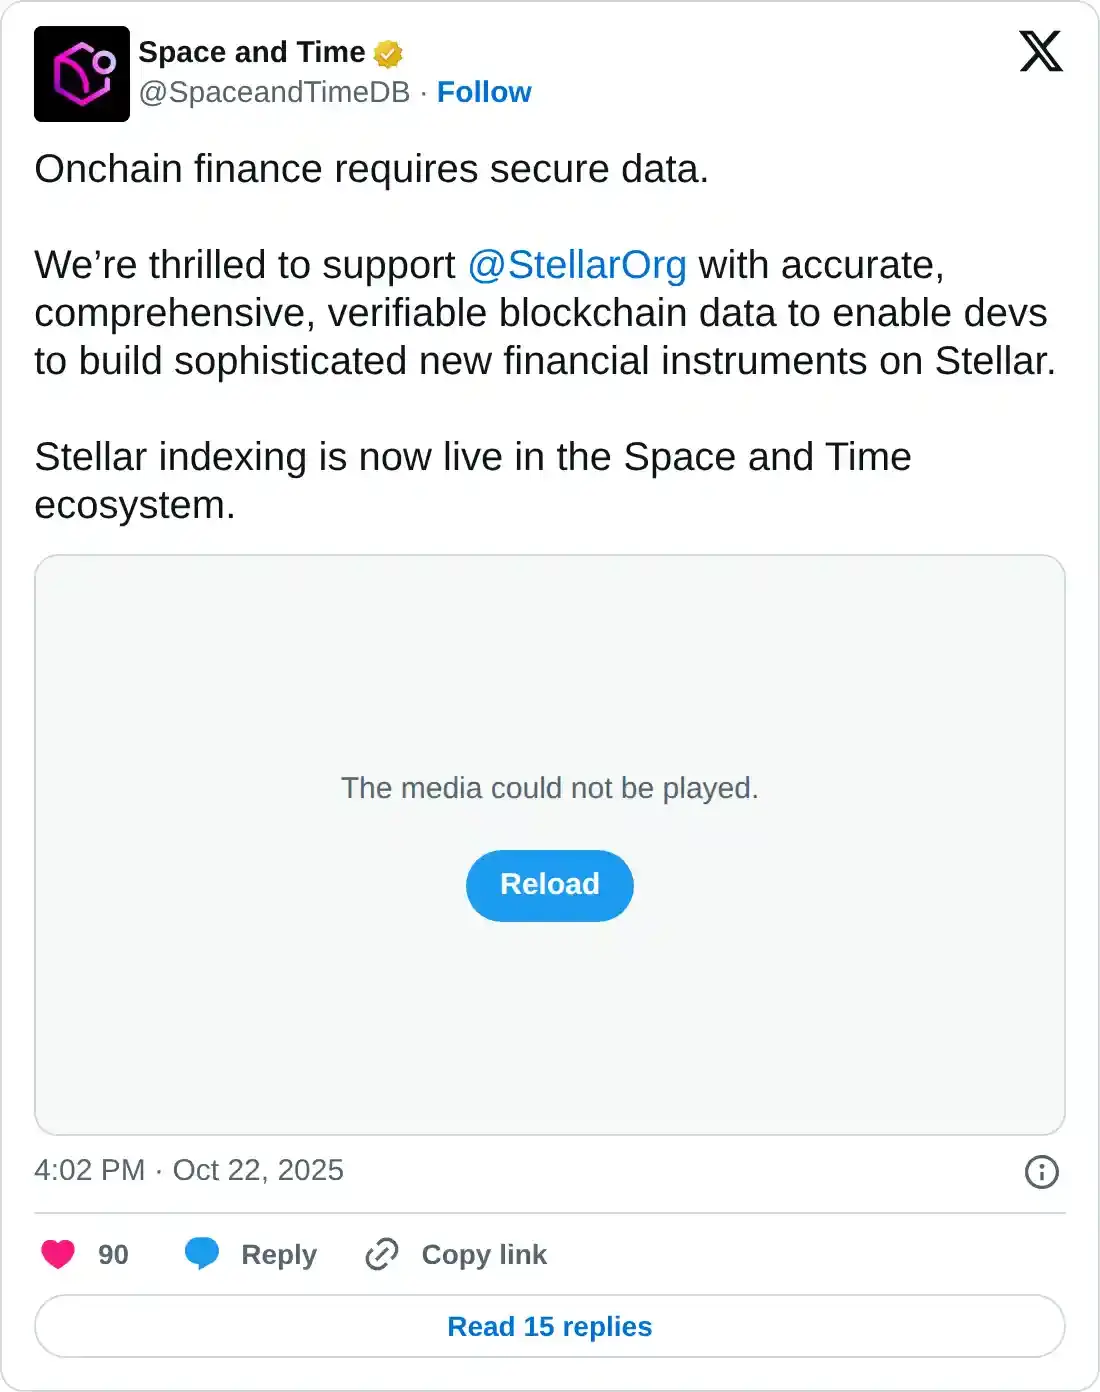
Stellar announced on Wednesday a partnership with Space and Time to bring more accurate, comprehensive, and verifiable blockchain data, enabling developers to build sophisticated new financial instruments on the Stellar blockchain. This development could enhance network utility and attract more institutional and Decentralized Finance (DeFi) participation.
Stellar Price Forecast: XLM shows early signs of fading bearish momentum
Stellar price faced rejection from the weekly resistance at $0.331 on Monday and declined by over 5% in the next two days, retesting the lower trendline of the falling wedge pattern. At the time of writing on Thursday, XLM trades slightly higher at around $0.309.
If XLM continues its recovery, it could extend the rally toward the weekly resistance at $0.331. A successful close above this level could extend additional gains toward the 50-day Exponential Moving Average (EMA) at $0.356.
The Relative Strength Index (RSI) indicator at 37 points upward on the daily chart, suggesting early signs of fading bearish momentum. For the recovery rally to be sustained, the RSI must move above the neutral level of 50. Moreover, the Moving Average Convergence Divergence (MACD) lines are converging to form a bullish crossover. If successful, this would further support a recovery ahead.
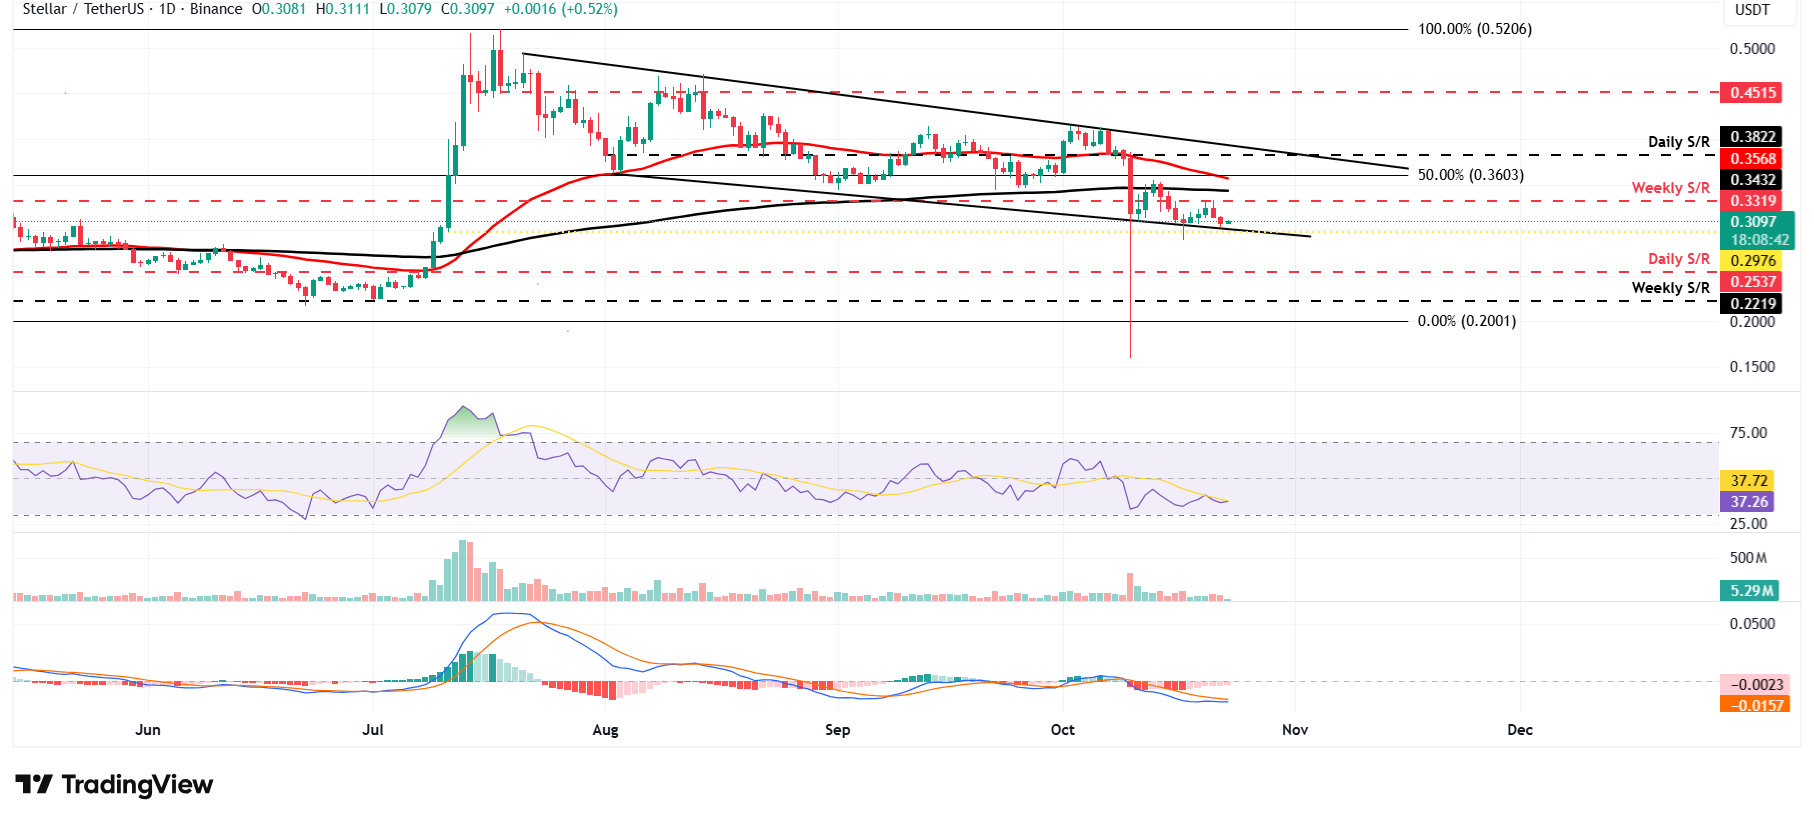
XLM/USDT daily chart
On the other hand, if XLM faces a correction, it could extend the decline to find support around the daily support level at $0.297.

FXStreet
Lebih sejuta pengguna bergantung pada FXStreet untuk data pasaran masa nyata, alat carta, pandangan pakar dan berita Forex. Kalendar ekonomi yang komprehensif dan webinar pendidikan mereka membantu pedagang kekal bermaklumat dan membuat keputusan yang dikira. FXStreet disokong oleh pasukan kira-kira 60 profesional di ibu pejabat Barcelona dan pelbagai wilayah global.
Read More


