
Trade The World
Top 3 Price Prediction: Bitcoin, Ethereum, Ripple – BTC, ETH, and XRP slip as market weakness persists
Oleh Manish Chhetri
Tarikh Diterbitkan: 31 Oct 2025 | Tarikh Diubah: 31 Oct 2025


POPULAR ARTICLES

Bitcoin (BTC) price trades below $109,000 at the time of writing on Friday after slipping nearly 5% so far this week. Ethereum (ETH) and Ripple (XRP) prices followed BTC’s footsteps, correcting by nearly 8% and 7%, respectively.
- Bitcoin trades below $109,000 on Friday, down nearly 5% so far this week.
- Ethereum nears key support at $3,593, a close below this level could accelerate the correction further.
- XRP hovers around $2.46 after a sharp decline, facing rejection from its 50-day EMA at $2.67.
Bitcoin (BTC) price trades below $109,000 at the time of writing on Friday after slipping nearly 5% so far this week. Ethereum (ETH) and Ripple (XRP) prices followed BTC’s footsteps, correcting by nearly 8% and 7%, respectively. These top three currencies are approaching key support levels; a decisive close below could extend further losses.
Bitcoin could extend its correction toward $102,000 if it closes below key support
Bitcoin price was rejected from the 78.6% Fibonacci retracement level (drawn from the April 7 low of $74,508 to the October 6 all-time high of $126,199) at $115,137 on Monday, and declined 5.44% by Thursday. At the time of writing on Friday, BTC hovers at around $109,100.
If BTC continues its correction and closes below the 61.8% Fibonacci retracement level at $106,453, it could extend the decline toward the October 10 low of $102,000.
The Relative Strength Index (RSI) on the daily chart reads 43, below the neutral level of 50, indicating bearish momentum gaining traction. The Moving Average Convergence Divergence (MACD) lines are also converging, with decreasing green histogram bars signaling fading bullish momentum.
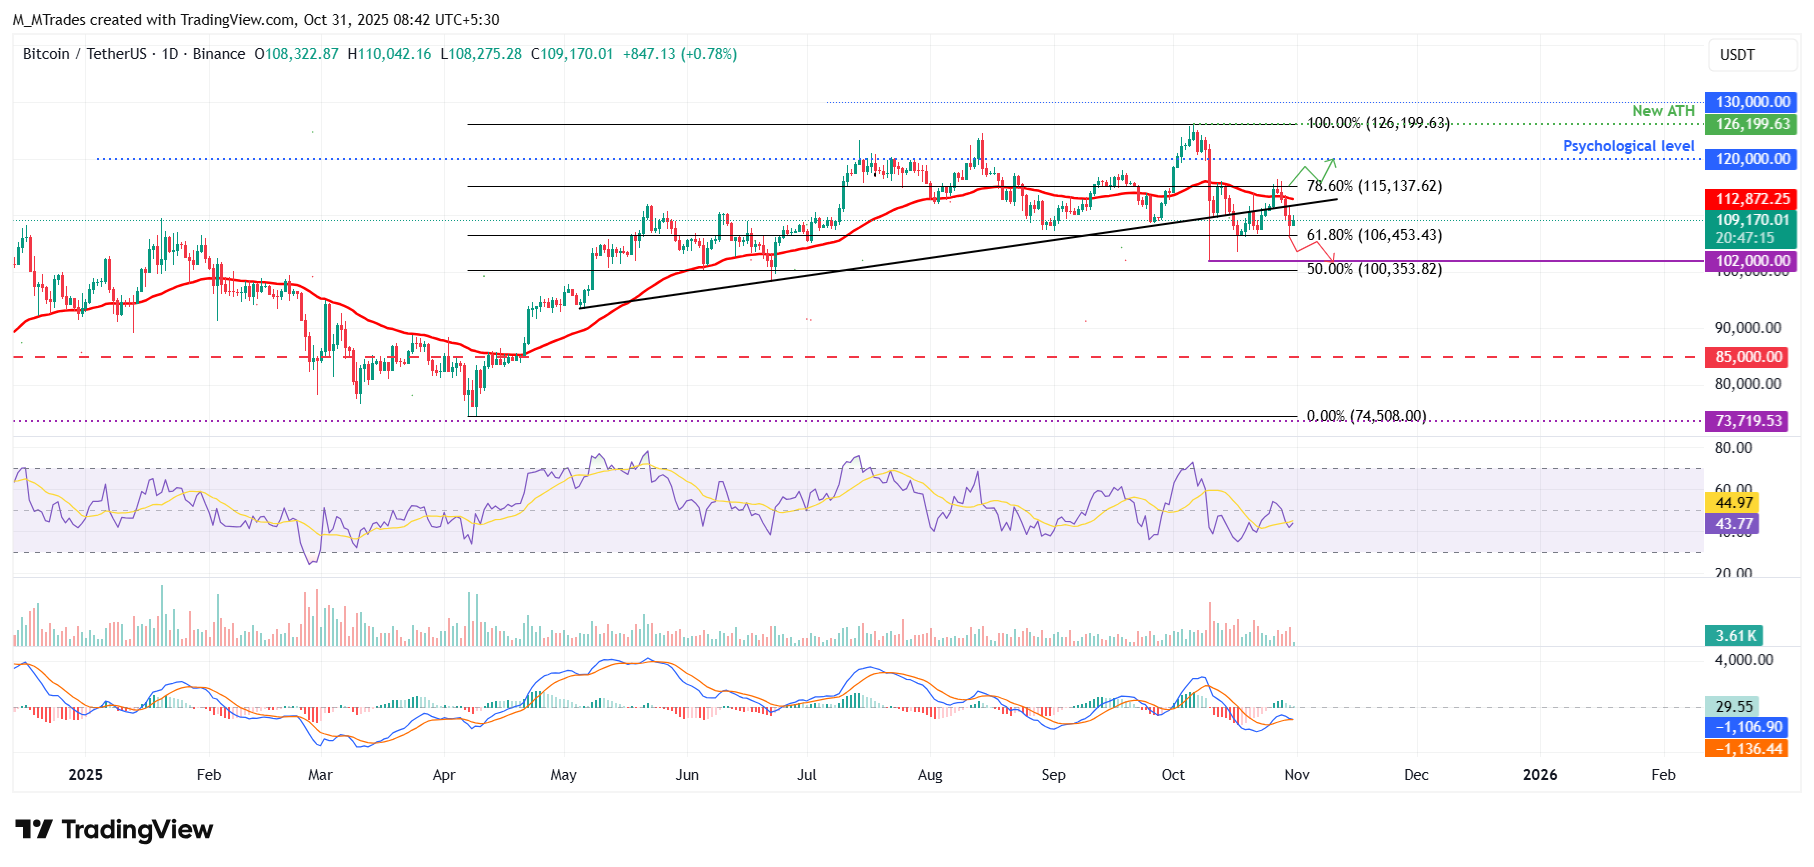
BTC/USDT daily chart
However, if BTC finds support around the 61.8% Fibonacci retracement level at $106,453, it could extend the recovery toward the 50-day EMA at $112,872.
Ethereum shows weakness in momentum
Ethereum price faced rejection from the daily resistance level at $4,232 on Monday and declined by 8.86% by Thursday. At the time of writing on Friday, ETH hovers around $3,833.
If ETH continues its correction, it could extend the decline toward the 61.8% Fibonacci retracement level at $3,593.
Like Bitcoin, Ethereum’s RSI and MACD indicators are signaling a bearish view.
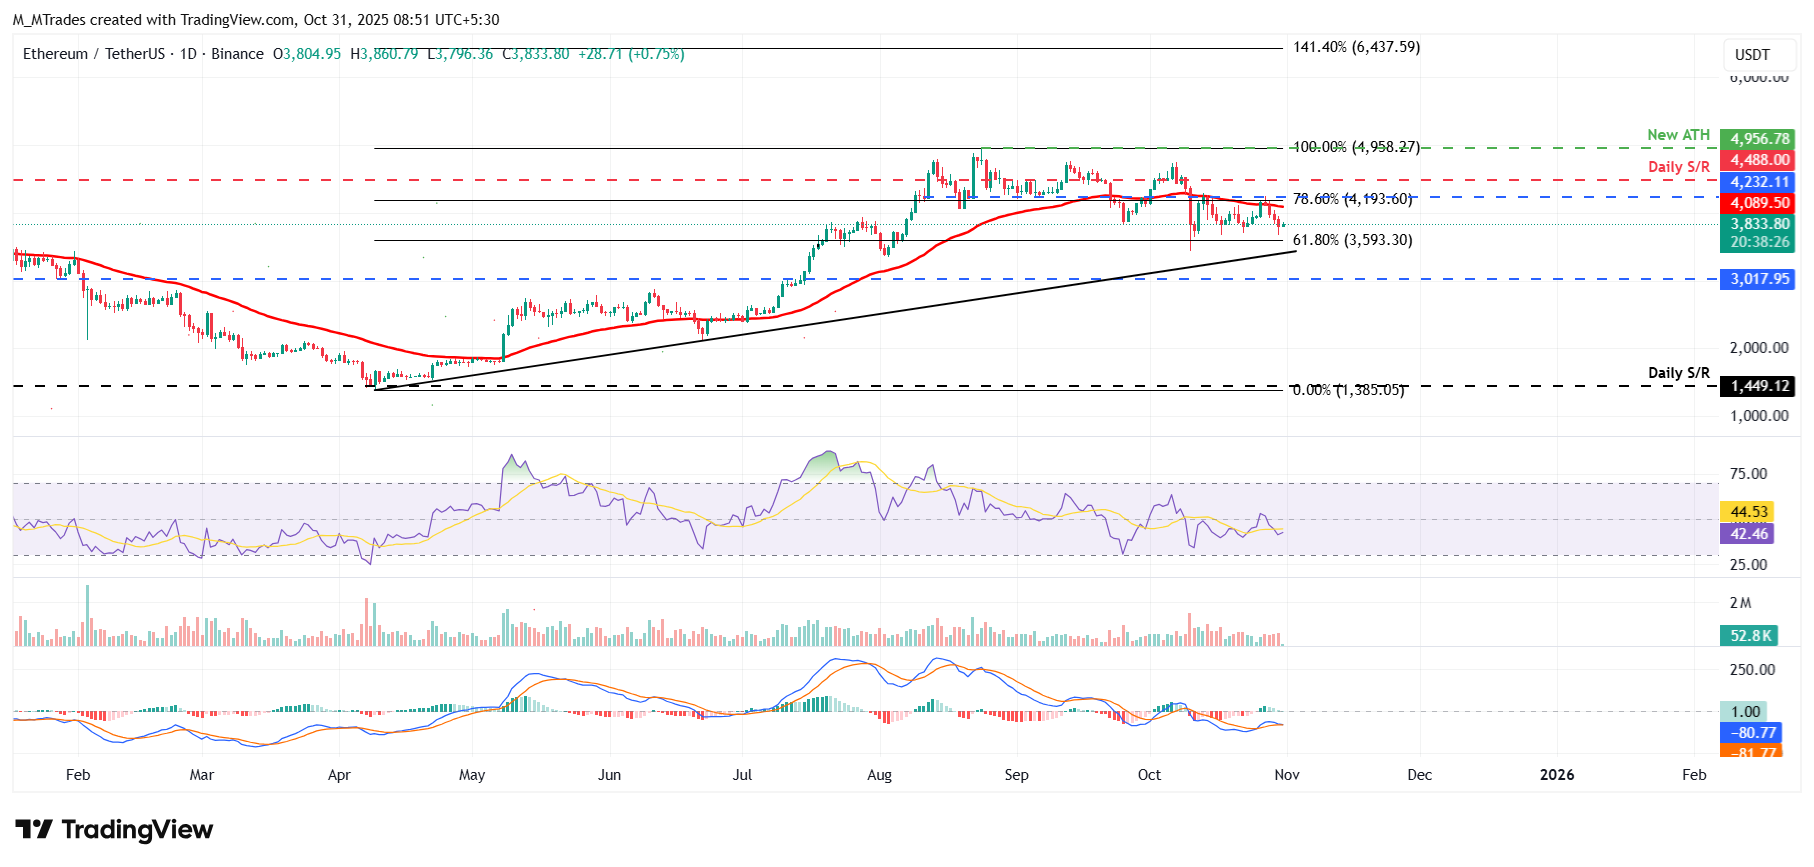
ETH/USDT daily chart
However, if ETH recovers, it could extend the recovery toward the 50-day EMA at $4,089.
XRP faces rejection from the 50-day EMA
XRP price faced rejection from the 50-day EMA at $2.66 on Monday and declined by nearly 8% until Thursday, retesting the daily support level at $2.35. At the time of writing on Friday, XRP hovers at around $2.46.
If XRP breaks and closes below the daily support at $2.35, it could extend the correction toward the next daily support at $1.96.
Like Bitcoin and Ethereum, XRP RSI and MACD are showing early signs of bearish momentum.
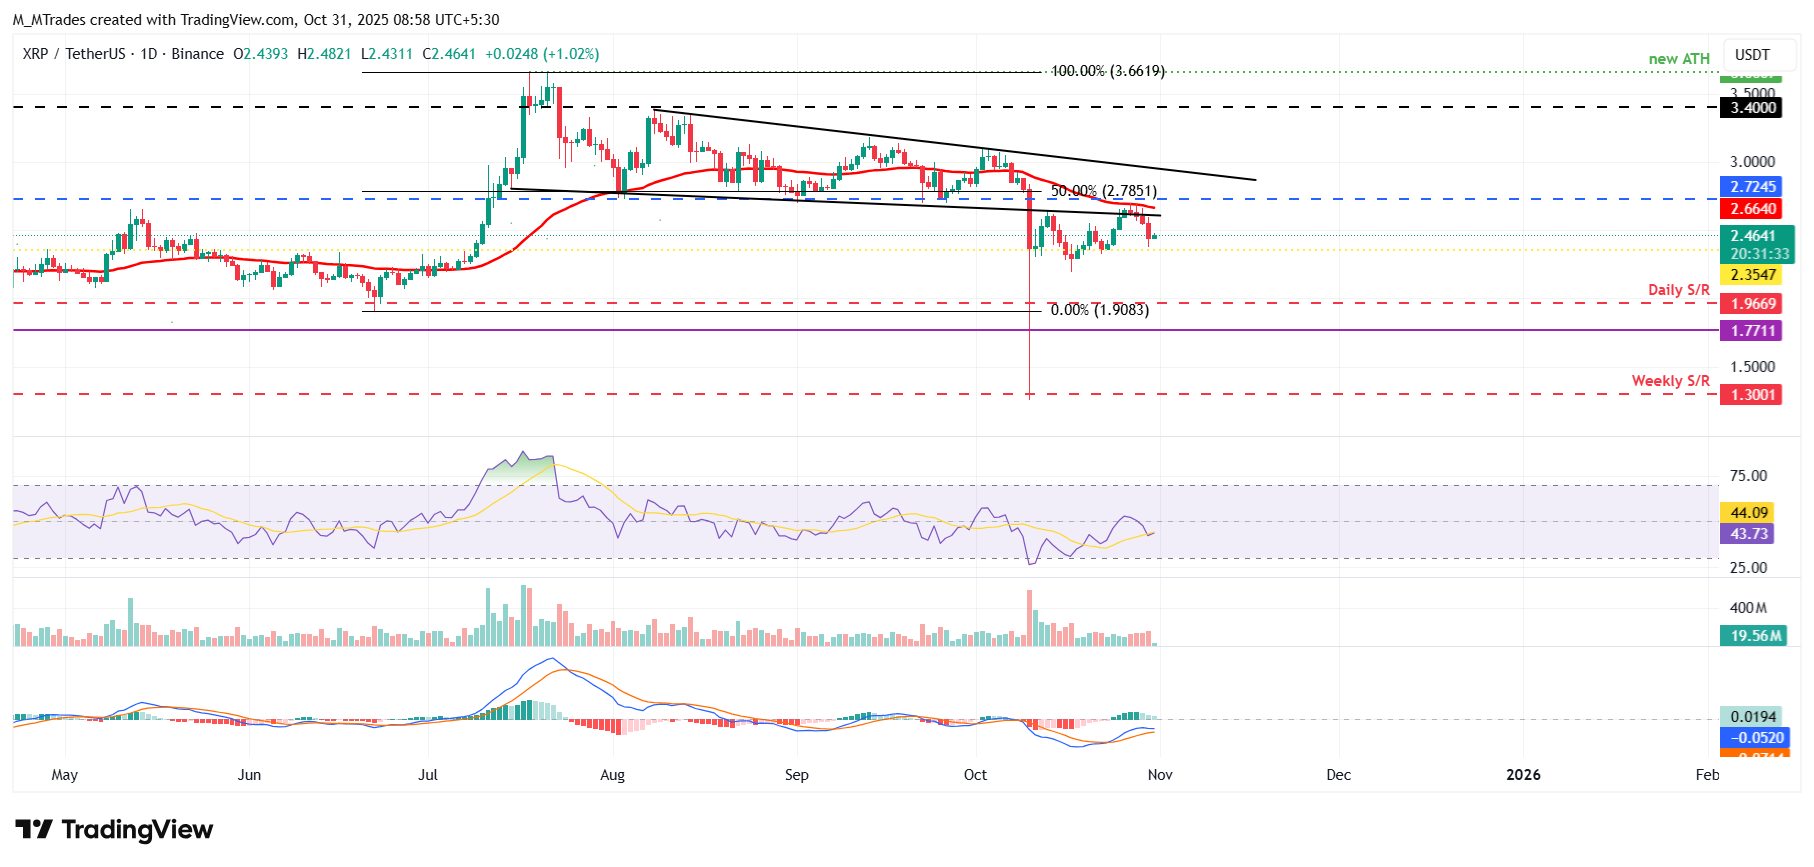
XRP/USDT daily chart
On the other hand, if XRP recovers, it could extend the recovery toward the 50-day EMA at $2.66.
Cryptocurrency metrics FAQs
The developer or creator of each cryptocurrency decides on the total number of tokens that can be minted or issued. Only a certain number of these assets can be minted by mining, staking or other mechanisms. This is defined by the algorithm of the underlying blockchain technology. On the other hand, circulating supply can also be decreased via actions such as burning tokens, or mistakenly sending assets to addresses of other incompatible blockchains.
Market capitalization is the result of multiplying the circulating supply of a certain asset by the asset’s current market value.
Trading volume refers to the total number of tokens for a specific asset that has been transacted or exchanged between buyers and sellers within set trading hours, for example, 24 hours. It is used to gauge market sentiment, this metric combines all volumes on centralized exchanges and decentralized exchanges. Increasing trading volume often denotes the demand for a certain asset as more people are buying and selling the cryptocurrency.
Funding rates are a concept designed to encourage traders to take positions and ensure perpetual contract prices match spot markets. It defines a mechanism by exchanges to ensure that future prices and index prices periodic payments regularly converge. When the funding rate is positive, the price of the perpetual contract is higher than the mark price. This means traders who are bullish and have opened long positions pay traders who are in short positions. On the other hand, a negative funding rate means perpetual prices are below the mark price, and hence traders with short positions pay traders who have opened long positions.

FXStreet
Lebih sejuta pengguna bergantung pada FXStreet untuk data pasaran masa nyata, alat carta, pandangan pakar dan berita Forex. Kalendar ekonomi yang komprehensif dan webinar pendidikan mereka membantu pedagang kekal bermaklumat dan membuat keputusan yang dikira. FXStreet disokong oleh pasukan kira-kira 60 profesional di ibu pejabat Barcelona dan pelbagai wilayah global.
Read More


