
Top Crypto Gainers: Dash, Monero, Story see strong rebounds
Oleh Vishal Dixit
Tarikh Diterbitkan: 19 Jan 2026 | Tarikh Diubah: 19 Jan 2026


ARTIKEL POPULAR

Privacy coins, such as Dash (DASH) and Monero (XMR), extend gains on Monday amid a broader cryptocurrency market pullback as the short-term surge in demand fades. The meme coin Story (IP) shares the top-gainer spot with privacy coins over the last 24 hours.
- Dash hovers around $80 on Monday with an upside bias after Sunday’s 6% gains.
- Monero is up nearly 5% on Monday after a four-day decline, bouncing off the 20-day EMA.
- Story consolidates above its 50-day EMA with a 7% rebound on Sunday.
Privacy coins, such as Dash (DASH) and Monero (XMR), extend gains on Monday amid a broader cryptocurrency market pullback as the short-term surge in demand fades. The meme coin Story (IP) shares the top-gainer spot with privacy coins over the last 24 hours. Technically, DASH and XMR flash upside bias while IP consolidates, stabilizing after last week’s correction.
Dash rebounds within a range-formation
Dash trades around $80 at press time on Monday, climbing from $72 earlier on the low. The privacy coin is trading roughly within the 50% and 61.8% Fibonacci retracement levels at $72 and $86, respectively, measured from the November 4 high to the December 19 low.
A decisive close exceeding these levels would determine the next phase in the DASH price trend. The intraday rebound, Sunday’s 6% gains, and technical indicators reinforce a strong upward bias.
The Moving Average Convergence Divergence (MACD) and its signal line rise into positive territory on the daily chart, but the declining green histogram bars suggest a weakening of bullish momentum. At the same time, the Relative Strength Index (RSI) is at 71, flatlining above the overbought boundary, indicating a hold in buying strength.
If DASH exceeds $86, it could target the 78.6% Fibonacci retracement level at $109.
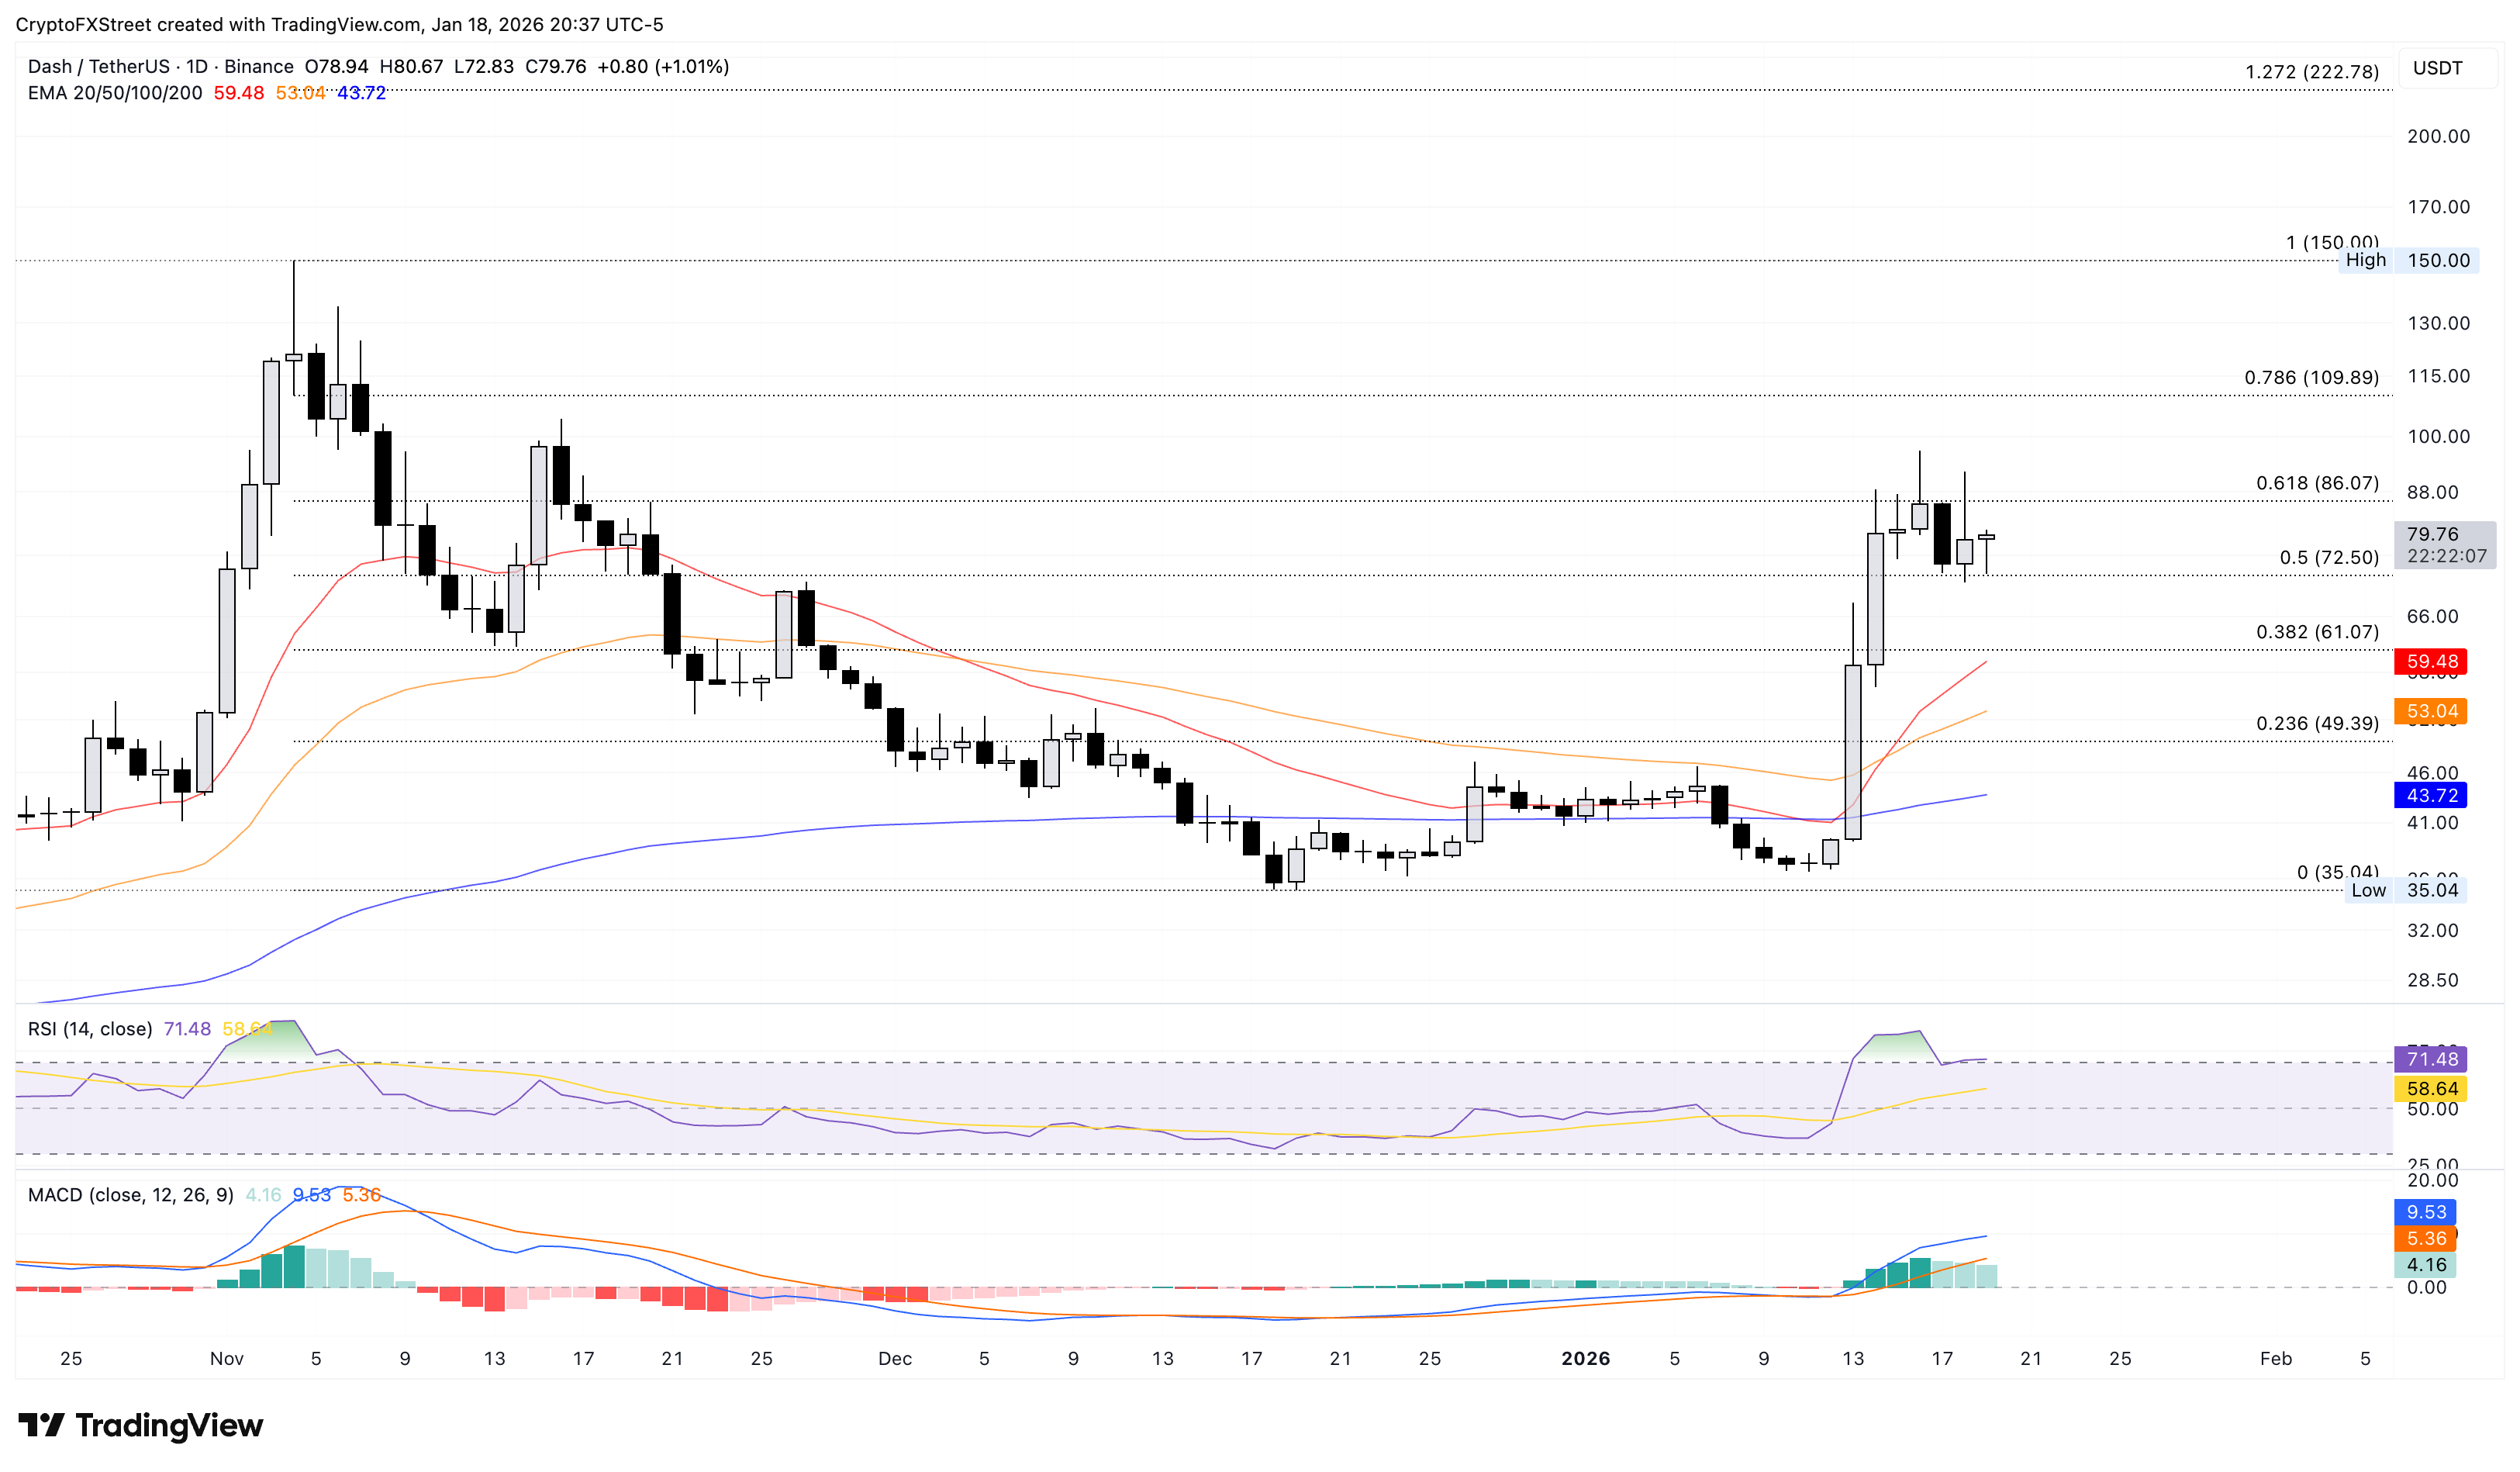
On the flip side, a closing below $72 would likely test the 38.2% Fibonacci retracement level at $61.
Monero regains strength after a steep pullback
Monero exceeds $600, bouncing off the R2 Pivot Point at $569 to avoid a drop below the 20-day Exponential Moving Average (EMA) at $548. At the time of writing, XMR is up 5% on Monday, recovering after a four-day decline of 20% from roughly $700, as previously forecasted by FXStreet.
The R3 Pivot Point at $640 serves as the immediate resistance level, with a higher target at the R4 Pivot Point at $711.
The MACD and signal line remain above the zero line, with a contracting histogram suggesting weakening bullish momentum. Still, the Relative Strength Index (RSI) is at 62, indicating intense buying pressure without overbought conditions.
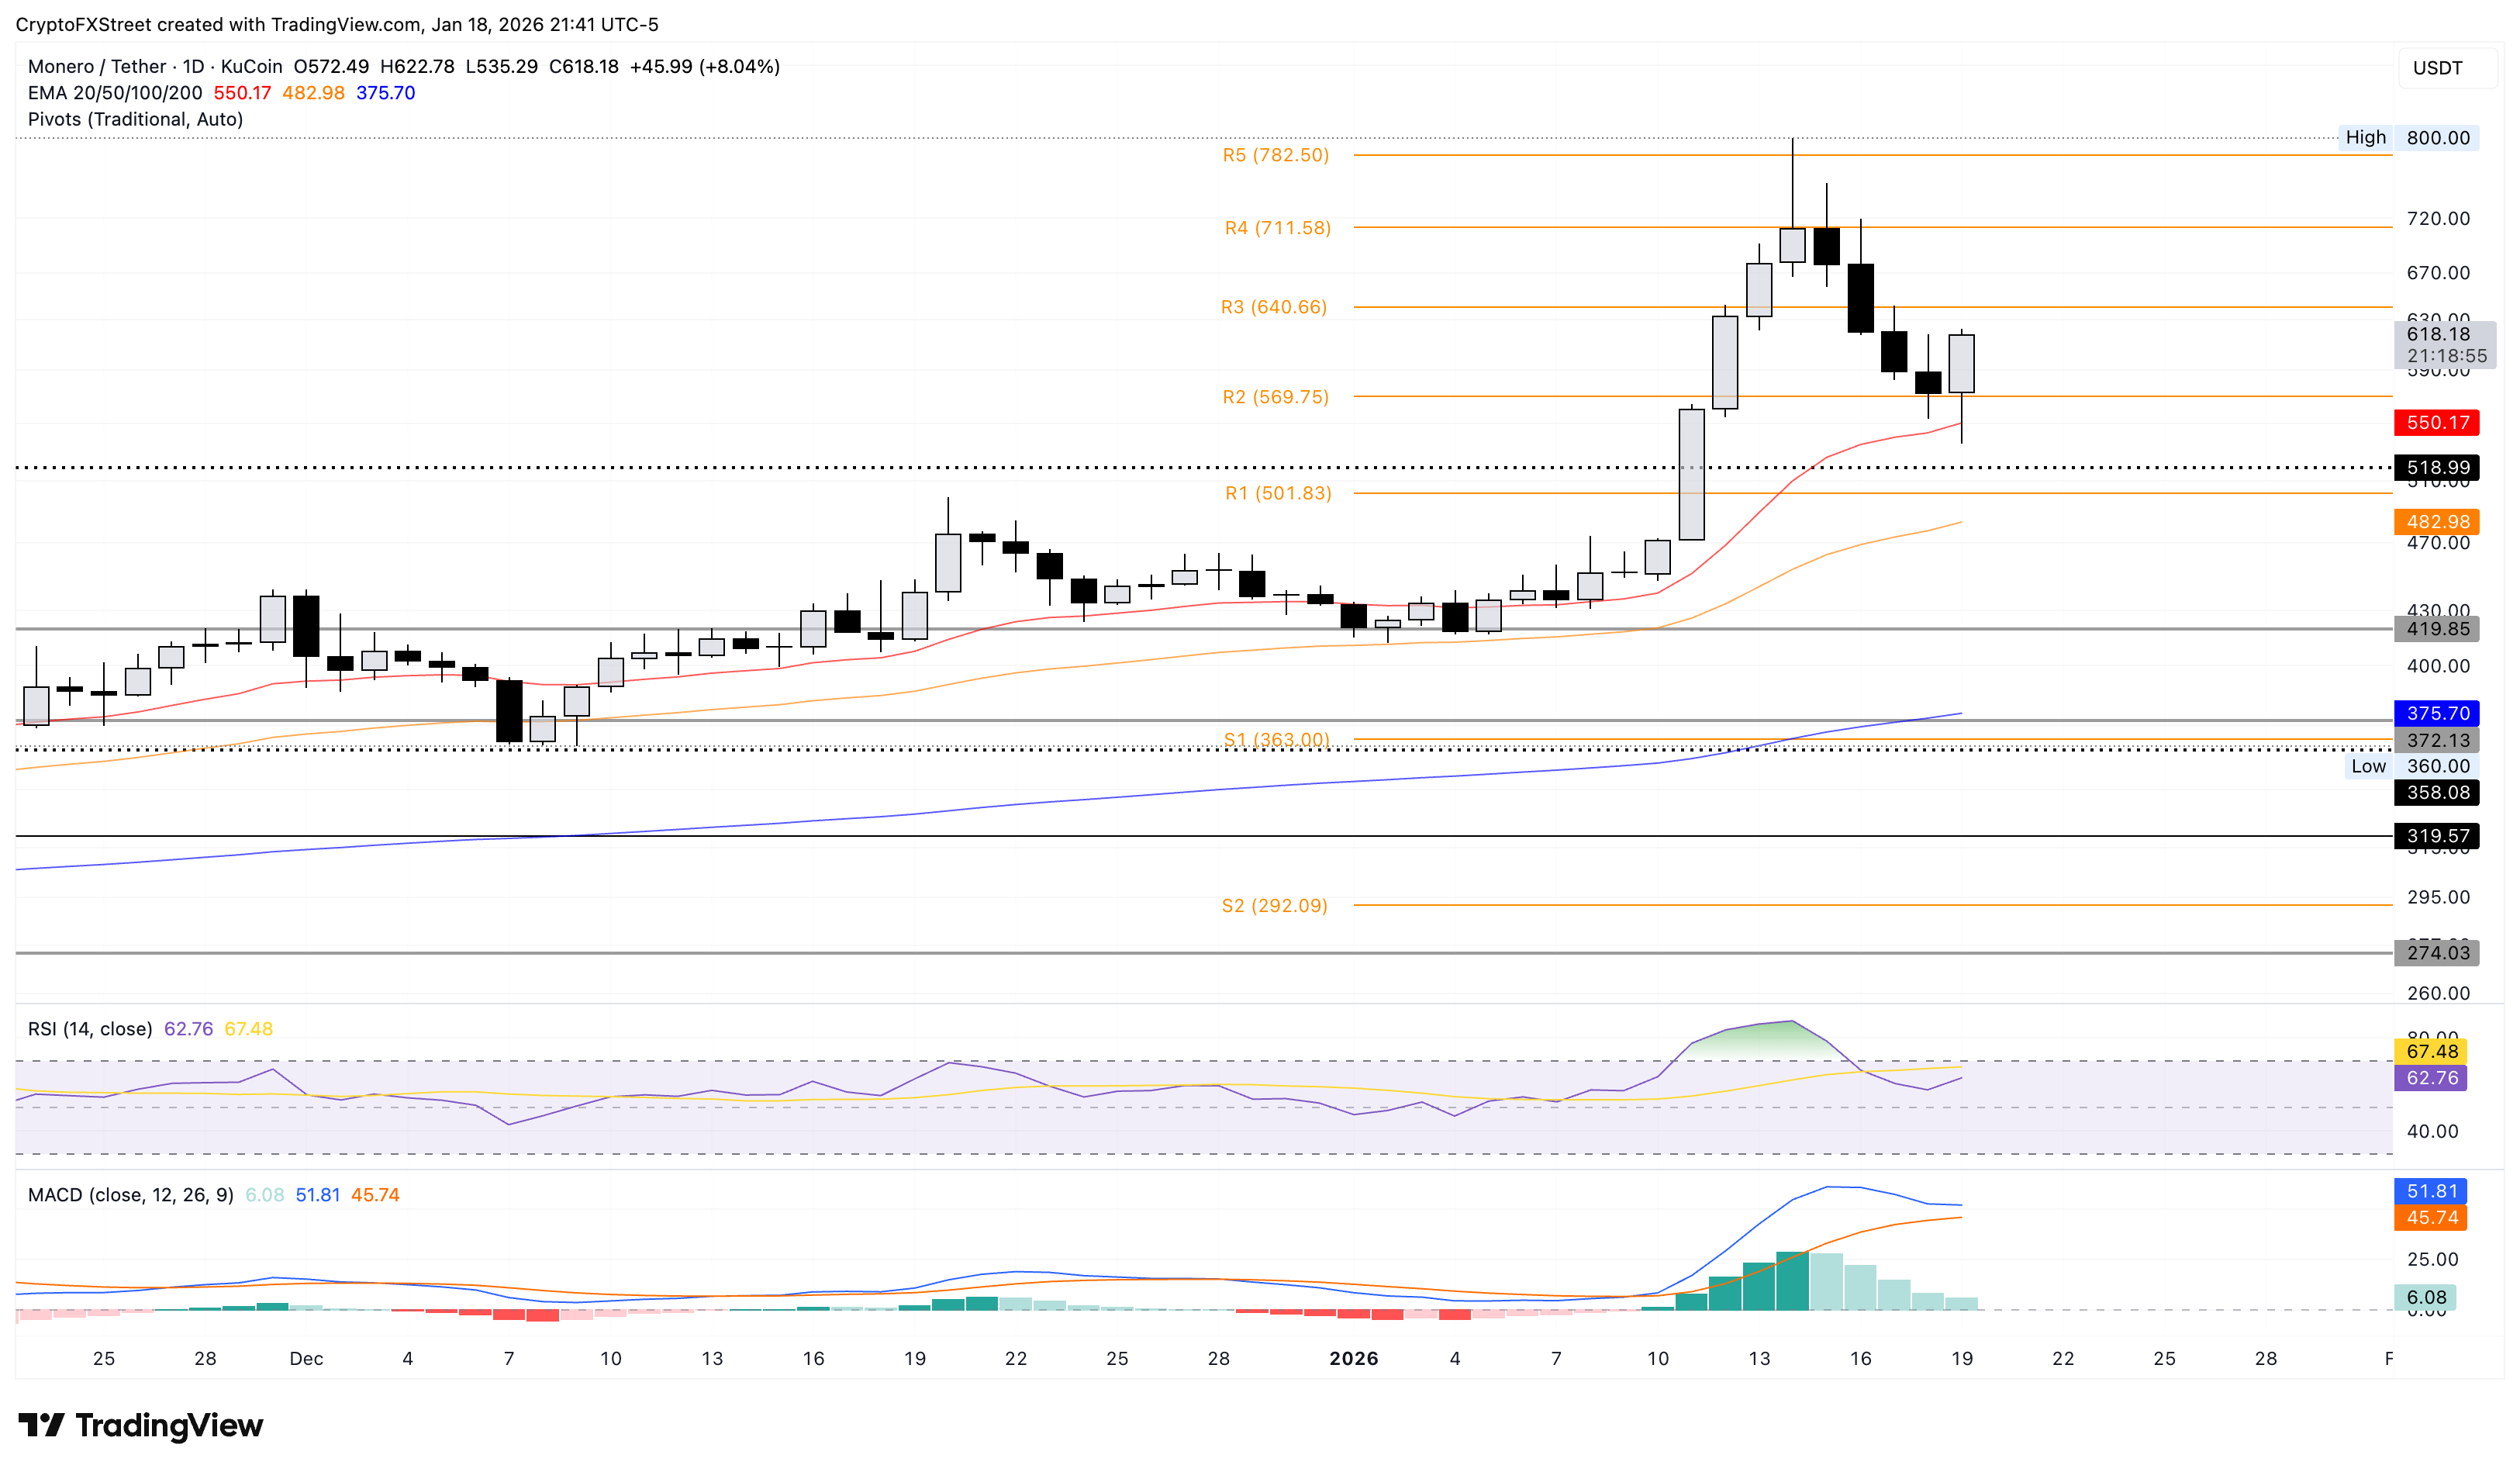
As long as XMR price holds above the R3 Pivot Point at $640, pullbacks would be contained, while a break below could extend toward the $500 psychological support level.
Story consolidates above a crucial support
Story is down roughly 4% at press time on Monday, starting the week on a bearish note after Sunday’s 7% rise. The meme coin consolidates above $2.50, while the rising 20-day EMA converges with the 50-day EMA at $2.47, setting up a potential crossover. Such a crossover would indicate a renewed strength in the short-term recovery.
The momentum indicators on the daily chart suggest a downside bias as the RSI at 53, down from the overbought zone, suggests waning buying pressure, while the MACD inches closer to the signal line for a potential bearish crossover.
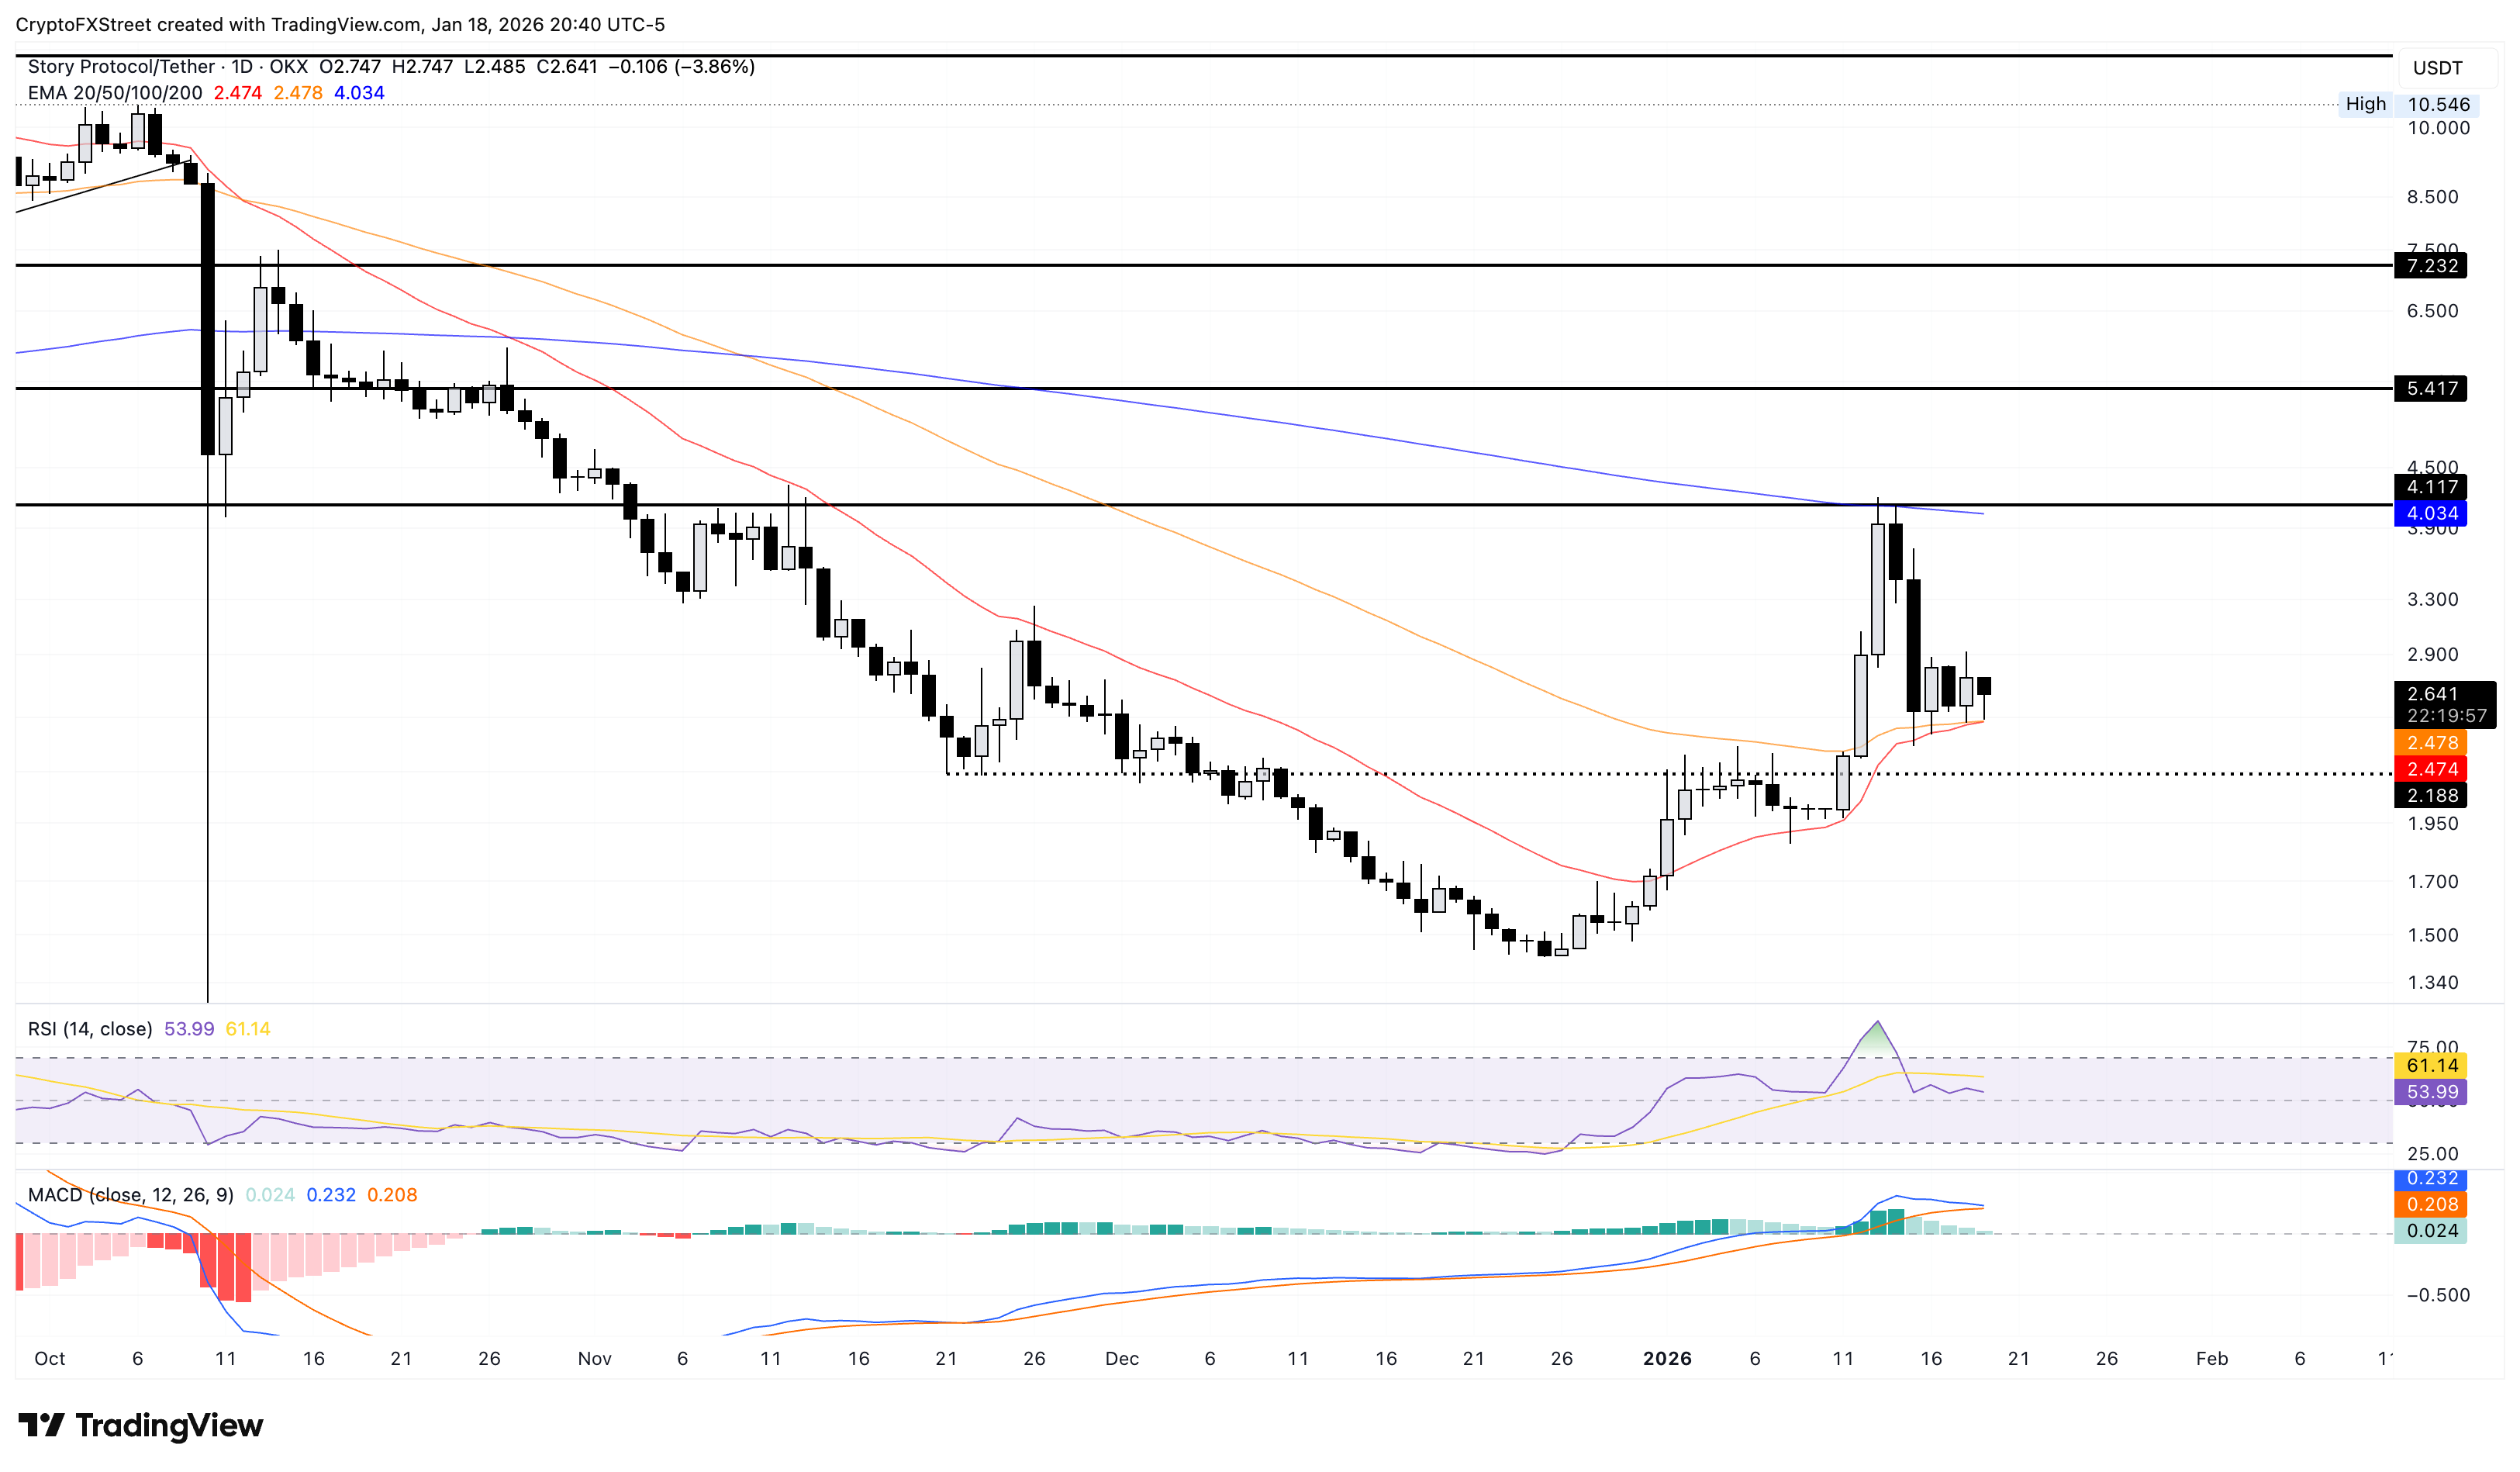
A break below $2.47 could extend the decline to the $2.18 support, marked by the November 21 low, with a deeper zone at the $2.00 psychological level.

Lebih sejuta pengguna bergantung pada FXStreet untuk data pasaran masa nyata, alat carta, pandangan pakar dan berita Forex. Kalendar ekonomi yang komprehensif dan webinar pendidikan mereka membantu pedagang kekal bermaklumat dan membuat keputusan yang dikira. FXStreet disokong oleh pasukan kira-kira 60 profesional di ibu pejabat Barcelona dan pelbagai wilayah global.
Baca Lagi


