
USD/CAD Price Forecast: Sees more downside below 1.3800 amid US-EU tensions
Oleh Sagar Dua
Tarikh Diterbitkan: 21 Jan 2026 | Tarikh Diubah: 21 Jan 2026


ARTIKEL POPULAR

The USD/CAD pair trades in a tight range around 1.3835 during the late Asian trading session on Wednesday, but is close to its over-a-week low of 1.3815.
- USD/CAD trades sideways around 1.3835 ahead of US President Trump’s speech at WEF in Davos.
- Trump imposes 10% tariffs on EU members against their opposition for US control of Greenland.
- US Treasury Secretary Bessent urges countries and companies not to retaliate against US tariffs.
The USD/CAD pair trades in a tight range around 1.3835 during the late Asian trading session on Wednesday, but is close to its over-a-week low of 1.3815. The Loonie pair consolidates as investors await speech from United States (US) President Donald Trump at the World Economic Forum (WEF) in Davos at 13:00 GMT.
As of writing, the US Dollar Index (DXY), which tracks the Greenback’s value against six major currencies, trades cautiously near 98.50.
Investors will pay close attention to Trump’s speech to get fresh cues on what more measures Washington can take against European Union (EU) for opposing US control of Greenland.
Till now, US President Trump has imposed 10% tariffs on several EU members and the United Kingdom (UK), leaving room for further increase, until Washington makes “complete and total” purchase of Greenland.
On Tuesday, US Treasury Secretary Scott Bessent urged countries not to retaliate against US tariffs on Greenland crisis, in his interview at the WEF, adding that countries and companies should pause and “let things play out”, Reuters reported.
USD/CAD technical analysis
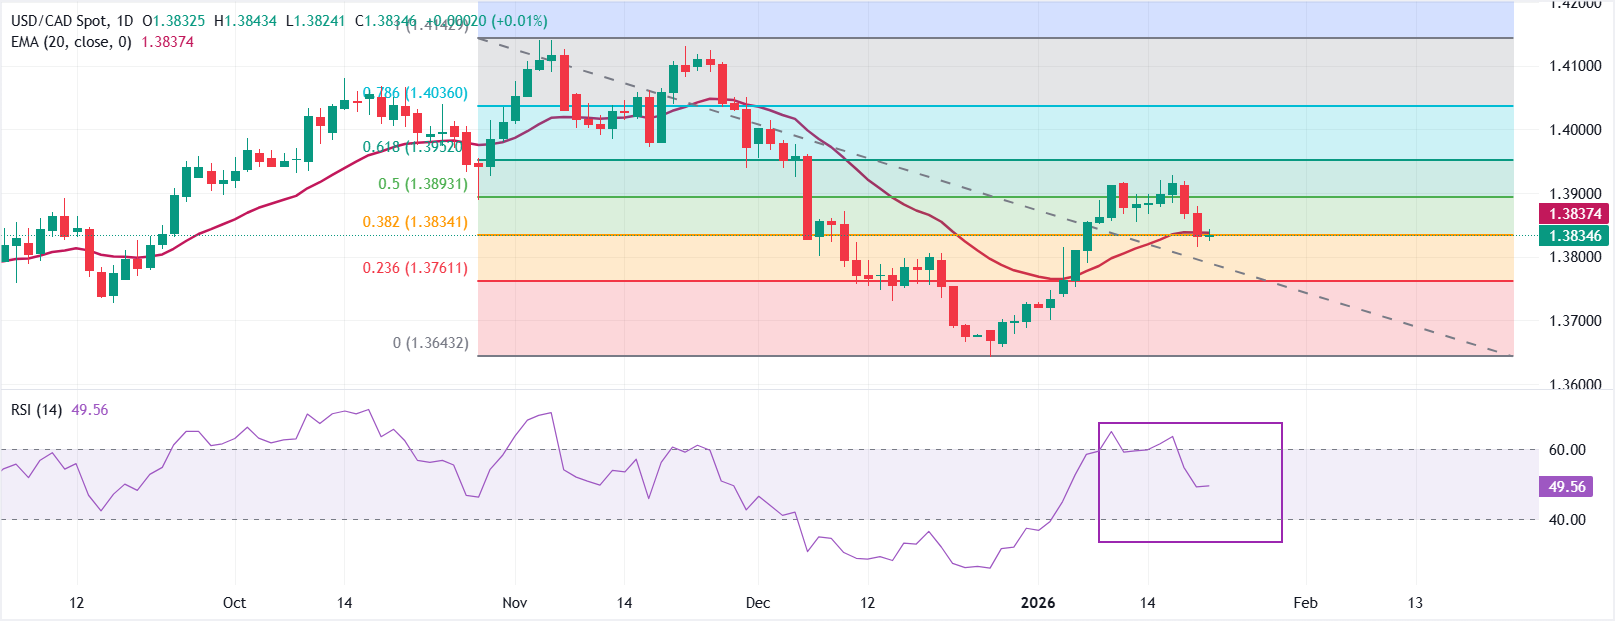
USD/CAD trades flat around 1.3834 as of writing. The 20-Exponential Moving Average (EMA) has flattened near 1.3837 after a steady drift lower and sits marginally above spot, capping rebounds. A close above the 20-day EMA would improve near-term traction, while failure to reclaim it would keep price action choppy.
The 14-day Relative Strength Index (RSI) at 49 (neutral) confirms a balanced momentum profile.
Measured from the 1.4143 high to the 1.3643 low, the 50% Fibonacci retracement at 1.3893 acts as resistance at the current pivot. A push through that barrier could extend gains toward the 61.8% Fibonacci retracement at 1.3952,. On the contrary, the extention of the current decline below 1.3800 could open the room for further downside towards the round-level support of 1.3700.
(The technical analysis of this story was written with the help of an AI tool.)
Economic Indicator
President Trump speech
Donald J. Trump is the 47th and current President of the United States. Before entering politics, he was a businessman and television personality. He became president for the first time in January 2017, representing the Republican party. His second mandate started in January 2025.
Read more.
Lebih sejuta pengguna bergantung pada FXStreet untuk data pasaran masa nyata, alat carta, pandangan pakar dan berita Forex. Kalendar ekonomi yang komprehensif dan webinar pendidikan mereka membantu pedagang kekal bermaklumat dan membuat keputusan yang dikira. FXStreet disokong oleh pasukan kira-kira 60 profesional di ibu pejabat Barcelona dan pelbagai wilayah global.
Baca Lagi


