
Trade The World
USD/CAD Price Forecast: Tests nine-day EMA barrier near 1.4050
Oleh Akhtar Faruqui
Tarikh Diterbitkan: 17 Nov 2025 | Tarikh Diubah: 17 Nov 2025


POPULAR ARTICLES

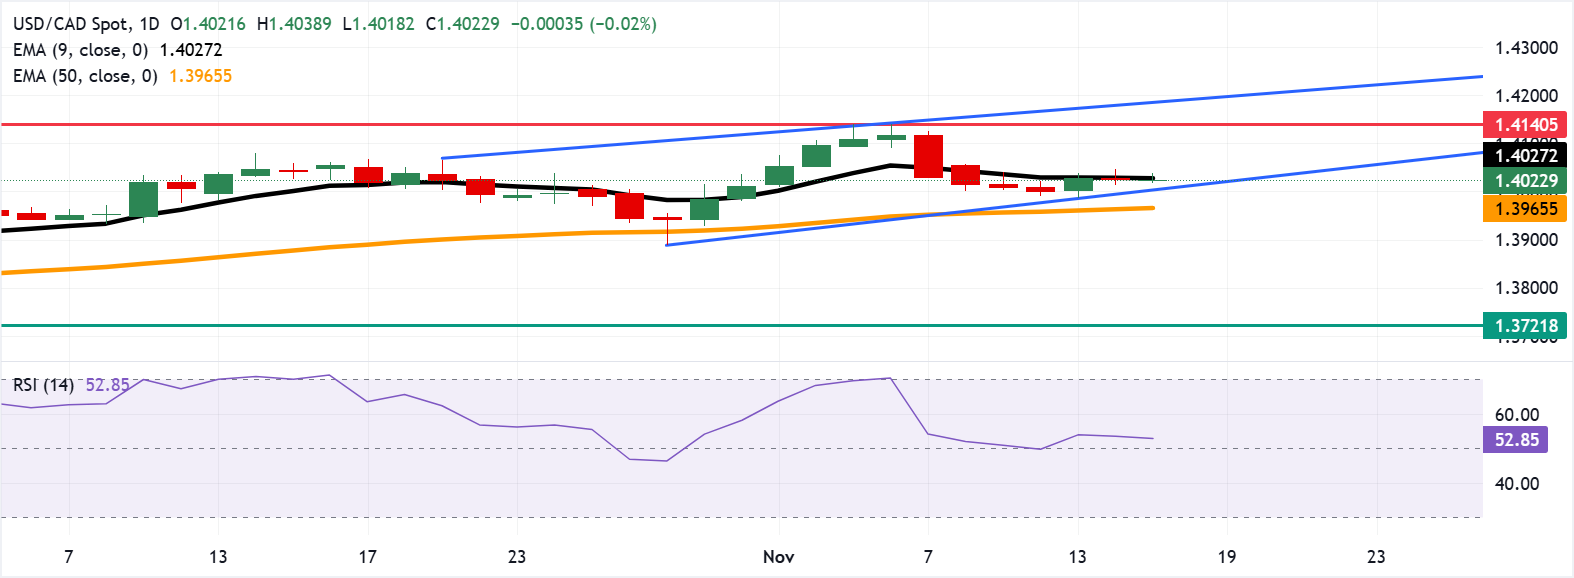
USD/CAD moves little after registering modest losses in the previous session, trading around 1.4020 during the European hours on Monday. The daily chart’s technical setup reflects a sustained bullish bias, with the pair continuing to trade within its ascending channel.
- USD/CAD tests immediate resistance at the nine-day EMA of 1.4027
- The 14-day Relative Strength Index sits above 50, strengthening the bullish bias.
- The immediate support lies at the ascending channel’s lower boundary around 1.4000.
USD/CAD moves little after registering modest losses in the previous session, trading around 1.4020 during the European hours on Monday. The daily chart’s technical setup reflects a sustained bullish bias, with the pair continuing to trade within its ascending channel.
The 14-day Relative Strength Index (RSI) holds just above the 50 mark, supporting a mild bullish bias. However, short-term momentum appears soft as the USD/CAD pair trades below the nine-day Exponential Moving Average (EMA).
The USD/CAD pair is testing its immediate barrier at the nine-day EMA of 1.4027. A break above this level would improve the short-term price momentum and support the USD/CAD pair may test the fresh seven-month high of 1.4140, reached on November 5. Further advance would open the doors for the pair to explore the region around the upper boundary of the ascending channel at 1.4190.
On the downside, the primary support appears at the ascending channel’s lower boundary around the psychological level of 1.4000, followed by the 50-day EMA at 1.3965. A break below this confluence support zone would cause the emergence of the bearish bias and put downward pressure on the USD/CAD pair to navigate the region around the three-month low of 1.3721, recorded on August 7.
Canadian Dollar Price Today
The table below shows the percentage change of Canadian Dollar (CAD) against listed major currencies today. Canadian Dollar was the weakest against the New Zealand Dollar.
| USD | EUR | GBP | JPY | CAD | AUD | NZD | CHF | |
|---|---|---|---|---|---|---|---|---|
| USD | 0.08% | -0.02% | 0.11% | -0.02% | 0.06% | -0.09% | 0.01% | |
| EUR | -0.08% | -0.11% | 0.04% | -0.10% | -0.02% | -0.18% | -0.04% | |
| GBP | 0.02% | 0.11% | 0.14% | -0.00% | 0.08% | -0.08% | 0.04% | |
| JPY | -0.11% | -0.04% | -0.14% | -0.13% | -0.06% | -0.21% | -0.10% | |
| CAD | 0.02% | 0.10% | 0.00% | 0.13% | 0.08% | -0.08% | 0.04% | |
| AUD | -0.06% | 0.02% | -0.08% | 0.06% | -0.08% | -0.16% | -0.01% | |
| NZD | 0.09% | 0.18% | 0.08% | 0.21% | 0.08% | 0.16% | 0.12% | |
| CHF | -0.01% | 0.04% | -0.04% | 0.10% | -0.04% | 0.01% | -0.12% |
The heat map shows percentage changes of major currencies against each other. The base currency is picked from the left column, while the quote currency is picked from the top row. For example, if you pick the Canadian Dollar from the left column and move along the horizontal line to the US Dollar, the percentage change displayed in the box will represent CAD (base)/USD (quote).

FXStreet
Lebih sejuta pengguna bergantung pada FXStreet untuk data pasaran masa nyata, alat carta, pandangan pakar dan berita Forex. Kalendar ekonomi yang komprehensif dan webinar pendidikan mereka membantu pedagang kekal bermaklumat dan membuat keputusan yang dikira. FXStreet disokong oleh pasukan kira-kira 60 profesional di ibu pejabat Barcelona dan pelbagai wilayah global.
Read More


