


What is the Cup and Handle Pattern in Trading?
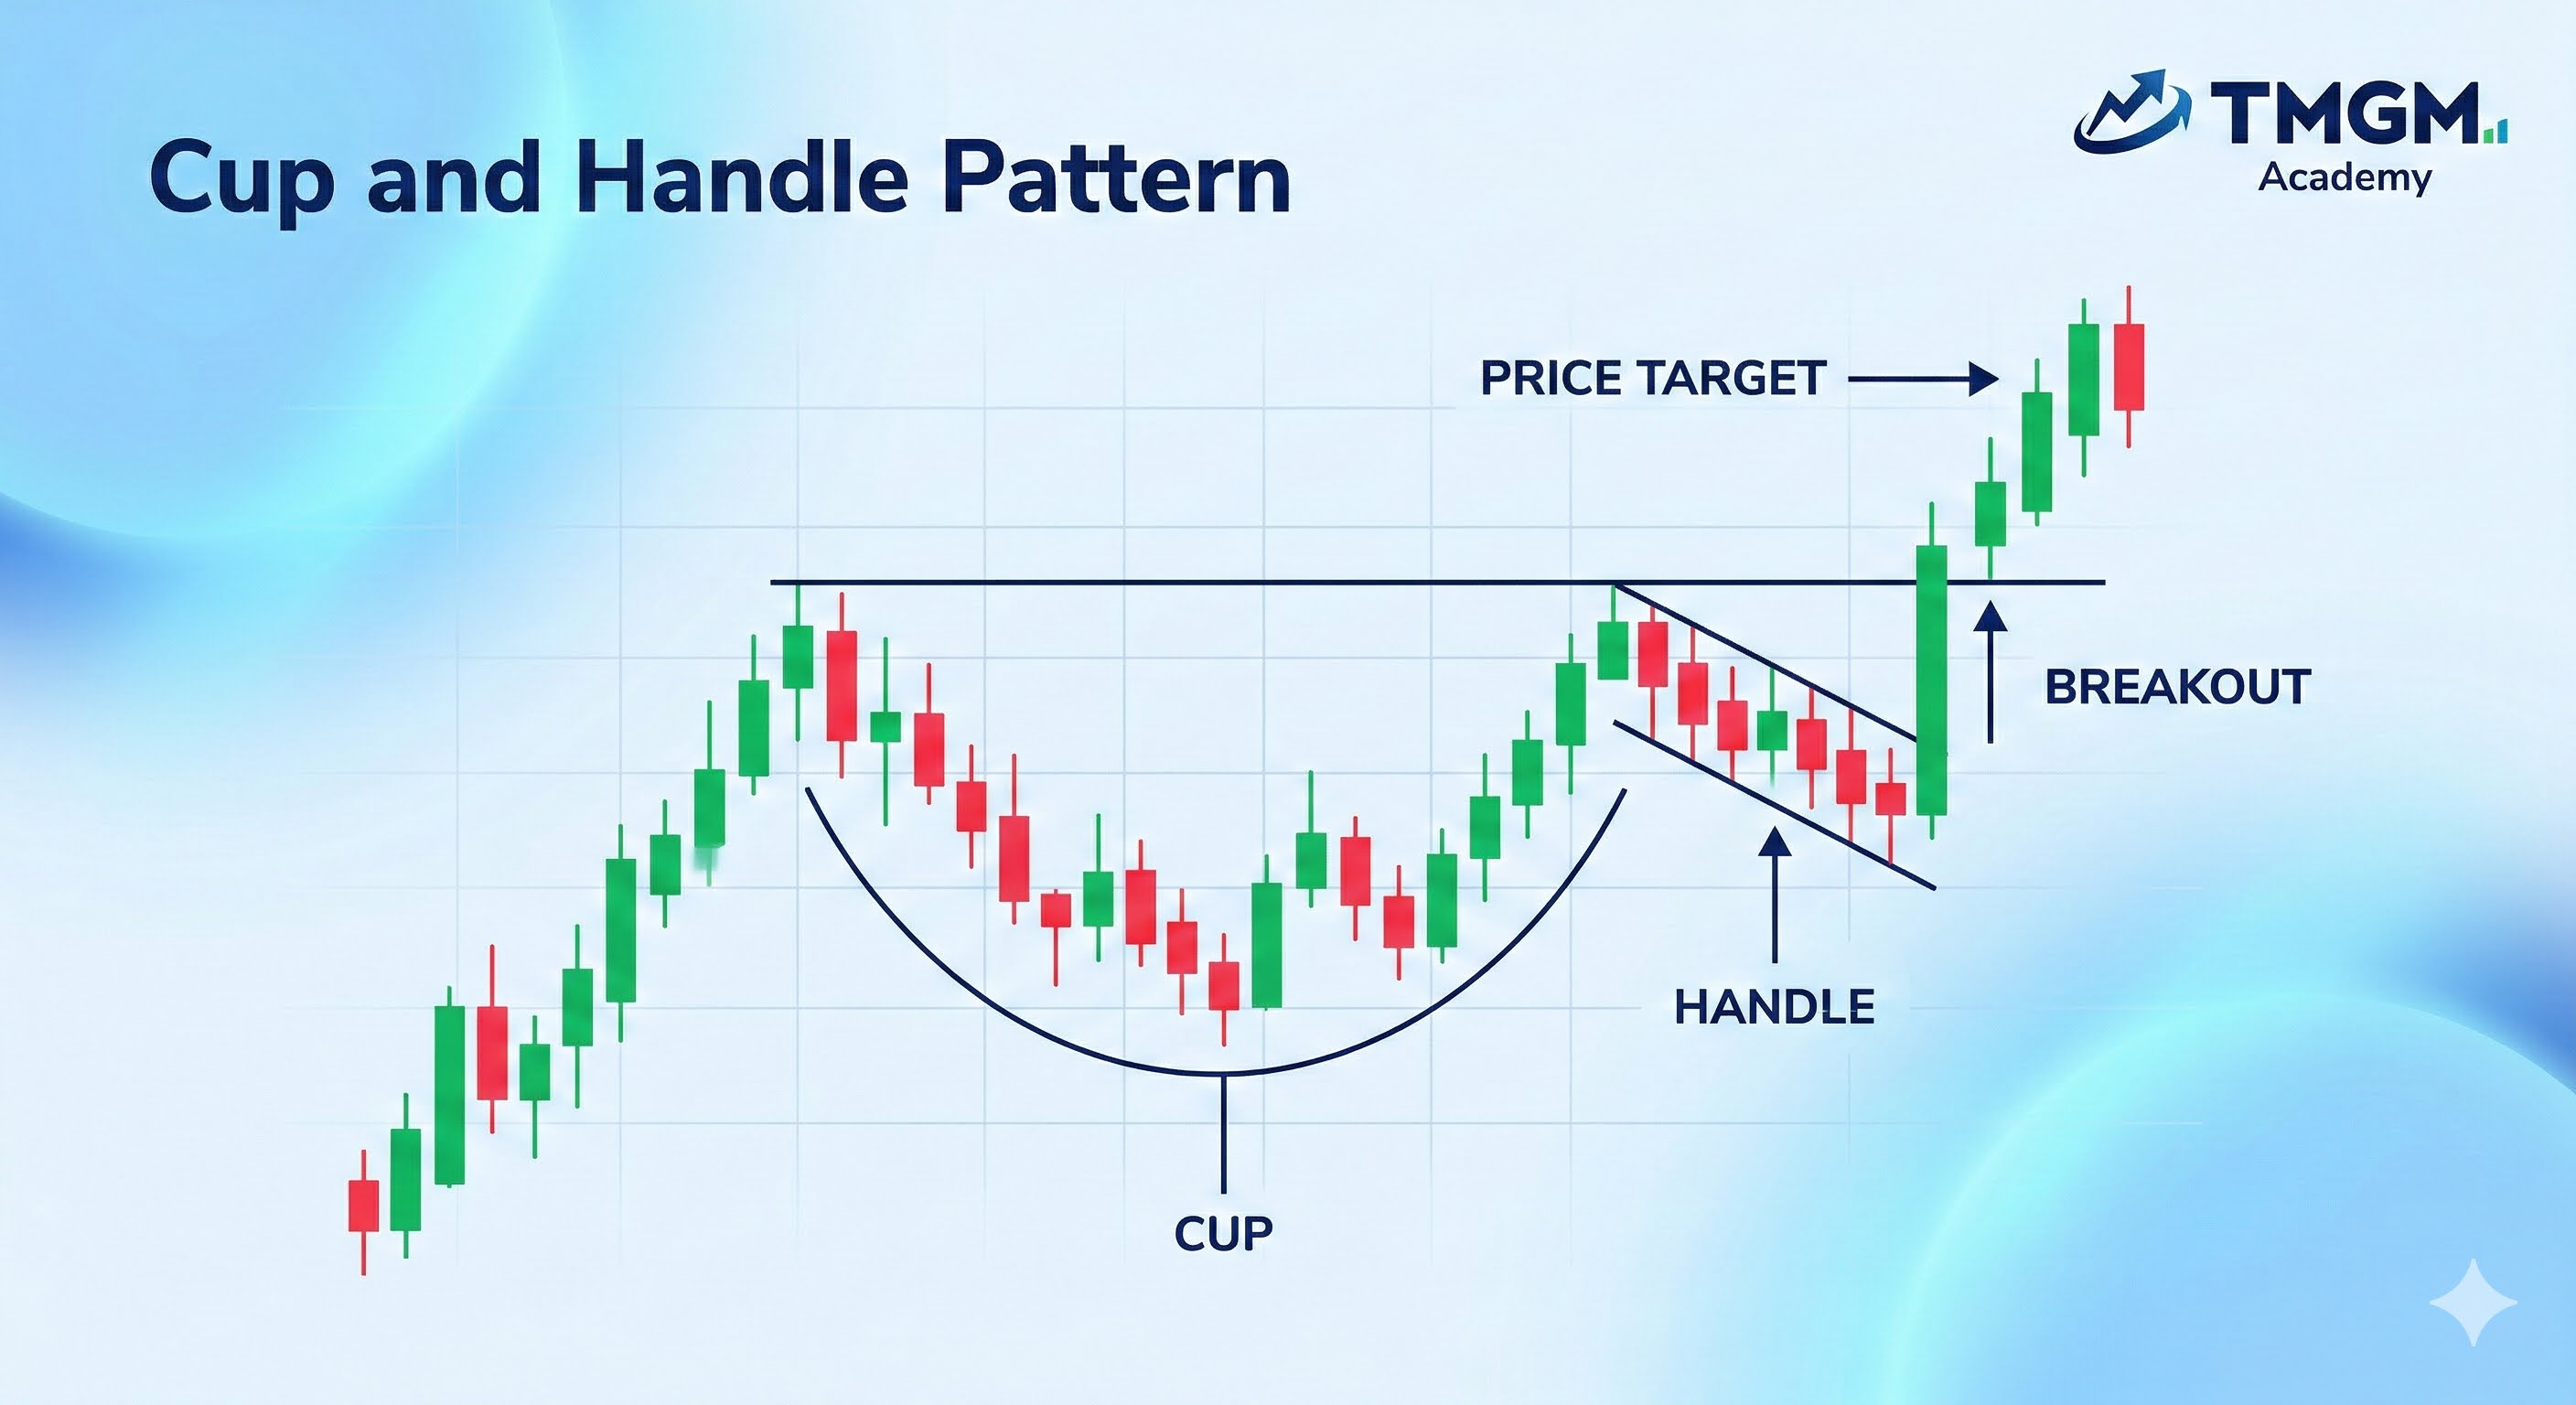
The cup and handle pattern is built around three parts: a prior uptrend, a rounded cup, and a short handle near resistance.
The structure has three core parts.
The Prior Uptrend: Price should already be in an uptrend before the pattern forms.
The Cup: Price pulls back, rounds out, and recovers. The shape should look smooth and curved rather than sharp.
The Handle: Price makes a small pullback again near resistance. This is usually a smaller pullback or sideways drift before the breakout.
The significance is straightforward. The market corrects without fully breaking the trend. Buyers return before price loses the prior structure. A breakout above the handle can confirm trend continuation.
That is why the classic cup and handle pattern is treated as a bullish setup rather than a neutral shape.
How to Read Cup and Handle Pattern on a Price Chart?
You need to look for a clear advance, often 20% to 30%, followed by a rounded cup and a small pullback handle, then confirm the pattern through similar rim highs, a controlled handle, and stronger breakout volume.
These conditions matter because they separate a healthy continuation pattern from a random pullback. Without trend, shape, and confirmation, the setup is weak.
How do traders trade a cup and handle breakout?
A cup and handle setup is usually traded through a breakout entry above the handle, a stop loss below the handle or cup, a projected target based on the cup depth, and a trade duration that often suits swing trading.
Entry point: Traders often place a buy order just above the handle resistance line. That is the breakout level. The goal is to enter only after price clears the pattern.
Stop loss: A common stop loss sits below the lowest point of the handle. This keeps risk tight. A wider stop can sit below the cup, but that increases exposure a lot.
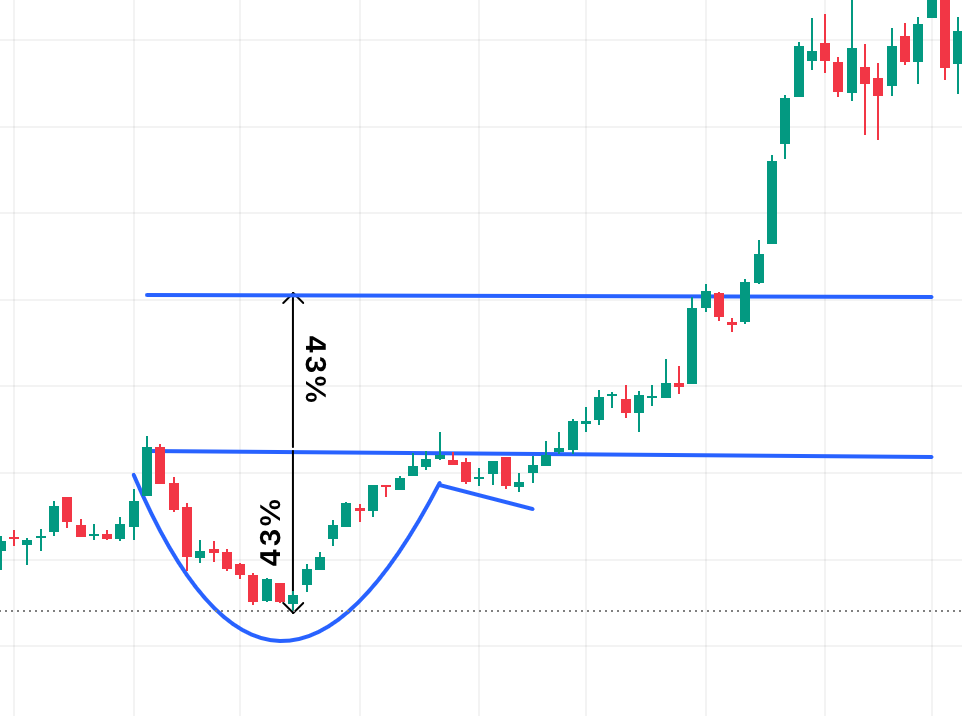
Cup and handle pattern target: A cup and handle pattern target is usually calculated by measuring the distance from the bottom of the cup to the breakout line, then projecting that same distance upward from the breakout point.
Trade duration: Since the cup often takes 1 to 6 months and the handle 1 to 4 weeks, the setup usually fits swing trading better than very short term trading.
Real Cup and Handle trade Example:
Traders use cup and handle chart pattern in all markets like forex, gold, oil and in this case, stocks.
There are several ways to trade a cup and handle pattern, but the most basic approach is to look for a long entry once price breaks above the handle resistance.
In the weekly chart of United States Steel Corporation, the handle resistance sits near $16.70. A stop buy order can be placed slightly above that level, with execution only taking place if price clears the breakout zone. This keeps the entry tied to confirmation, although aggressive breakout entries can still face slippage or a false break.
A more conservative approach is to wait for a weekly close above $16.70, then look for an entry on a retest of the breakout area. This reduces the risk of chasing the move, but it also creates a chance of missing the trade if price continues higher without pulling back, like in this case, the price did not touch the retest level before rallying again.
The measured profit target comes from the depth of the cup. In this example, the distance from the bottom of the cup to the breakout level is about 43%. Projecting that same percentage above the $16.70 breakout gives an initial target near $23.90 to $24.00. Price reached that area and later moved well beyond it. That makes the measured move useful as a first objective, not always the final ceiling. For that reason, partial profit taking near the projected target, while leaving the rest of the position open to follow a stronger trend, can be a practical approach.
A stop loss can be placed below the handle low for tighter risk control, or below the cup low for a wider trade structure.
What can go wrong with a cup and handle pattern?
A cup and handle pattern can fail when the structure no longer supports a clean bullish continuation.
The prior trend is too weak:
This pattern works best after a clear move higher. If price comes from a sideways range or a weak advance, the setup has less continuation strength behind it.
The cup is too sharp:
The cup should form a rounded U shape, not a fast V shaped reversal. A sharp recovery often shows unstable price action rather than a controlled reset.
The cup becomes too deep:
A very deep cup weakens the continuation case. Instead of a temporary pullback, it can suggest that the market is moving into a larger trend break.
The handle drops too deep:
The handle should stay controlled and form in the upper part of the cup. When it falls too far into the structure, the pattern loses quality and the breakout level becomes less reliable.
Breakout volume is weak:
A breakout without stronger volume often lacks real buyer commitment. Price may move above resistance briefly, then stall or reverse.
The breakout fails:
False breakouts are common. Price can break above the handle, fail to hold that level, and then fall back into the pattern. That usually shows that follow through buying was not strong enough.
The pattern forms without enough time or structure:
A strong cup and handle usually takes time to develop. When the shape forms too quickly or looks uneven, the setup is often less reliable.
What are the main cup and handle variations?
The standard version is bullish, but there are bearish variations too.
Bullish cup and handle pattern: This is the classic version. Price rises, rounds out, forms a handle, and breaks upward.
Inverted cup and handle pattern (Bearish): This is the bearish mirror image. Price weakens, forms a rounded top, pauses, and then breaks lower.

Reverse cup and handle pattern (Bearish): Some traders use this name instead of inverted cup and handle pattern. The idea is the same. It is a bearish formation that points to downside continuation.
In practice, inverted cup and handle pattern, reverse cup and handle pattern, and bearish cup and handle pattern are often used to describe closely related downside structures. The exact label can vary, but the trade logic is consistent.


