


Bullish Reversal Patterns
These patterns appear after a downtrend and suggest a potential reversal to the upside.
1. Hammer Candle
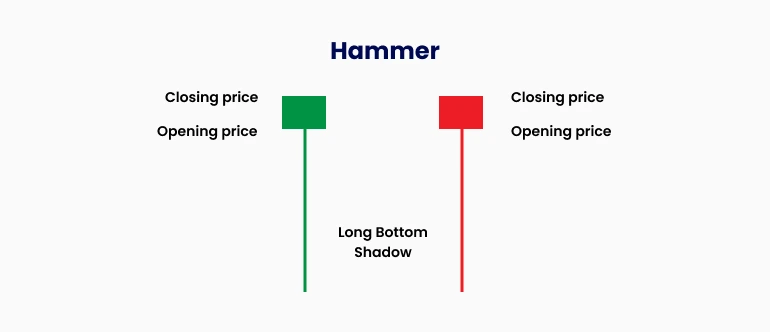
Description: A small body at the top with a long lower shadow that’s typically twice the size of the body.
Meaning: Indicates rejection of lower prices and signals potential buying pressure.
Context: Appears after a downtrend and often acts as the first sign of a bullish reversal.
2. Inverted Hammer Candle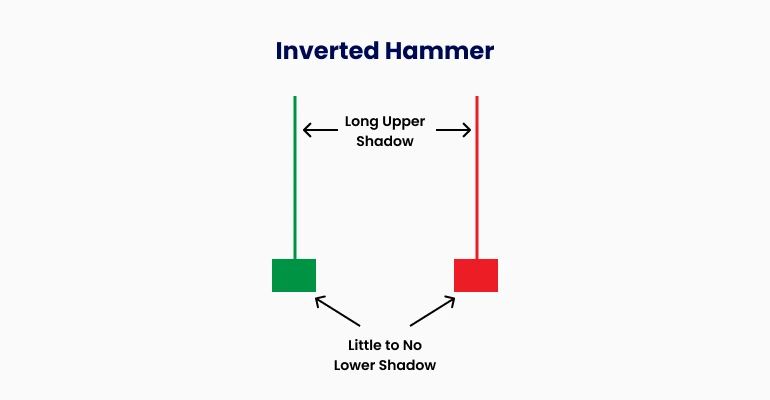
Description: A small body at the bottom with a long upper shadow.
Meaning: Suggests potential for a bullish reversal, as selling pressure diminishes near the end of a downtrend.
Confirmation: Requires a follow-up bullish candle to confirm the reversal.
3. Bullish Engulfing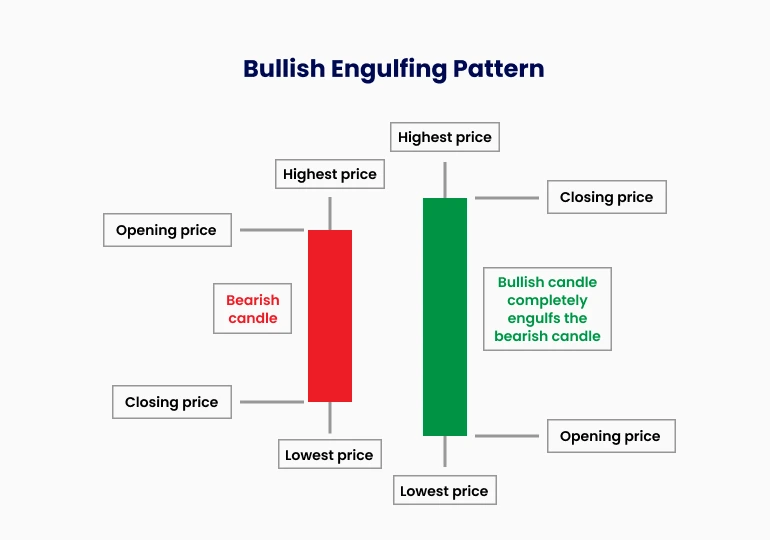
Description: A green (bullish) candle completely engulfs the previous red (bearish) candle.
Meaning: Shows strong buying momentum, often leading to further upward movement.
4. Piercing Line
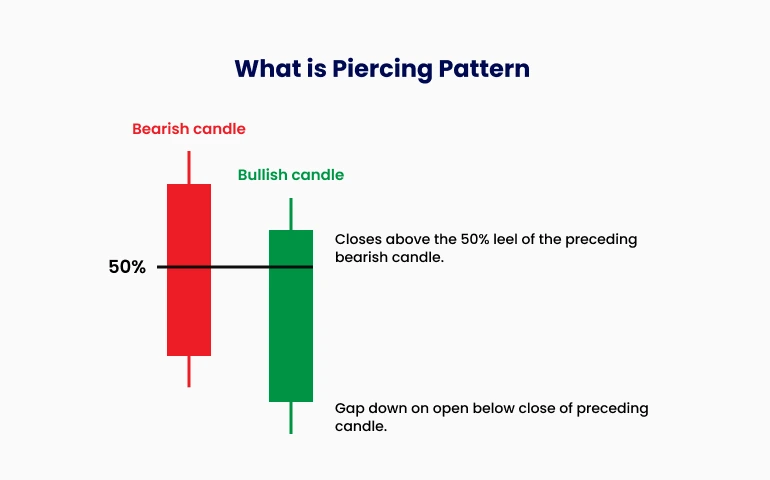
Description: A two-candle pattern where the second candle opens lower but closes above the midpoint of the first bearish candle.
Meaning: Signals strong buyer intervention, hinting at a possible trend reversal.
5. Morning Star
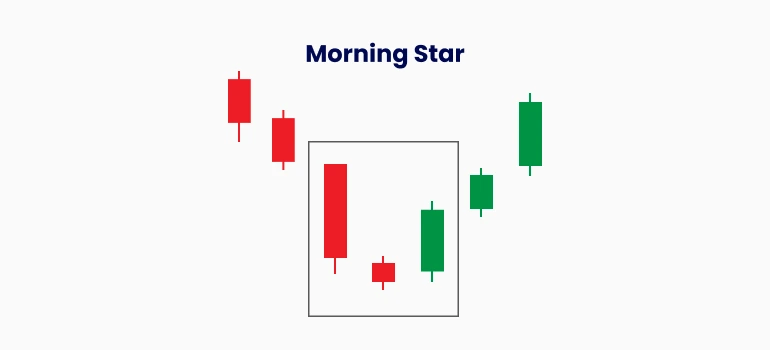
Description: A three-candle pattern consisting of:
A long bearish candle.
A small-bodied indecisive candle (gap down).
A bullish candle that closes into the body of the first bearish candle.
Meaning: Indicates a shift in momentum from sellers to buyers.
6. Three White Soldiers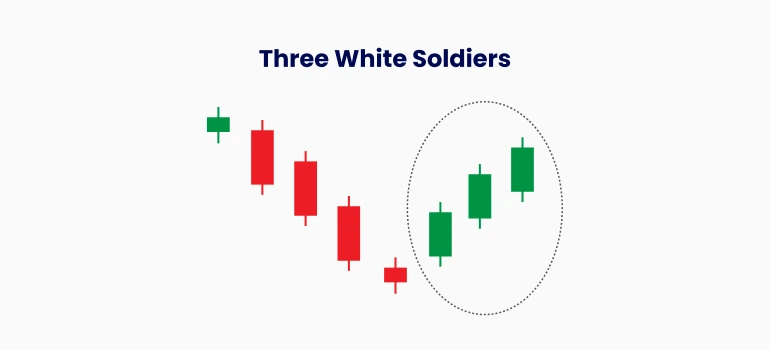
Description: Three consecutive bullish candles with progressively higher closes.
Meaning: Reflects strong and consistent buying pressure, signalling a robust uptrend.
Bearish Reversal Patterns
These patterns occur after an uptrend and indicate potential downward price movement.
1. Shooting Star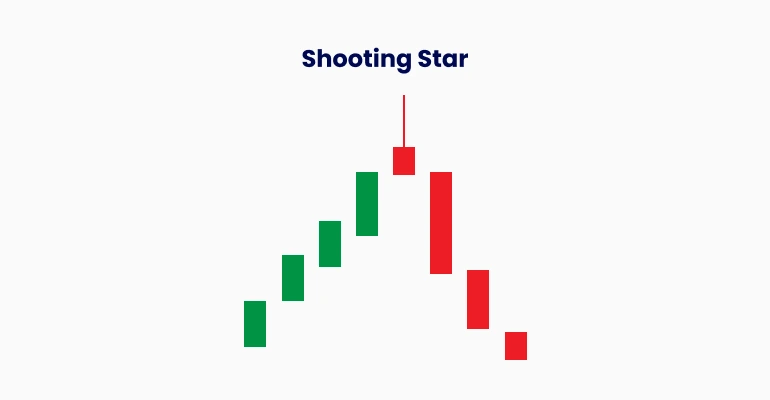
Description: A small body near the bottom with a long upper shadow.
Meaning: Suggests rejection of higher prices, often signalling a reversal to the downside.
2. Hanging Man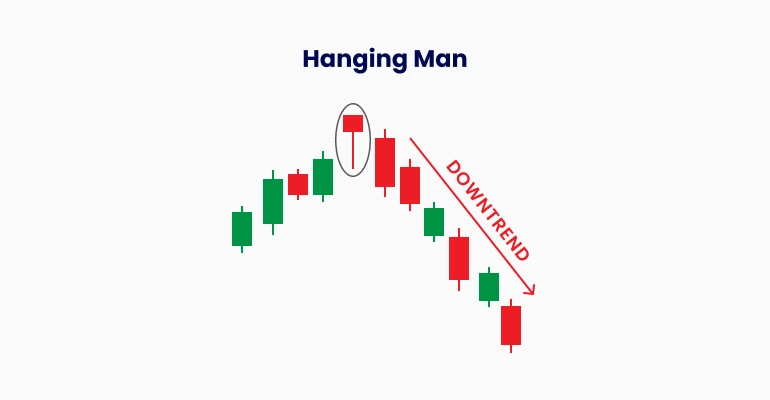
Description: Similar in appearance to the Hammer but occurs at the top of an uptrend.
Meaning: Warns of potential bearish reversal as buying pressure weakens.
3. Bearish Engulfing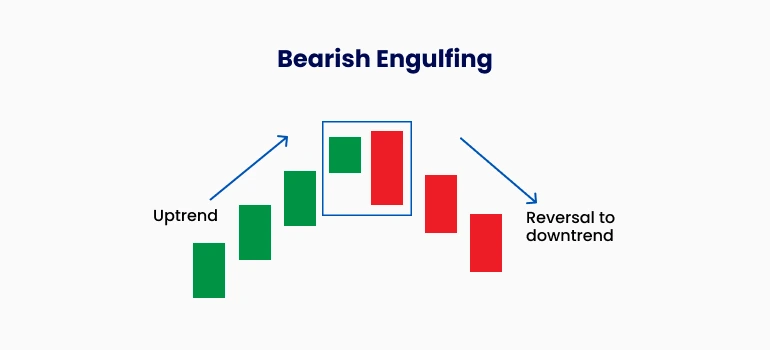
Description: A red (bearish) candle completely engulfs the previous green (bullish) candle.
Meaning: Indicates strong selling momentum and potential trend reversal.
4. Dark Cloud Cover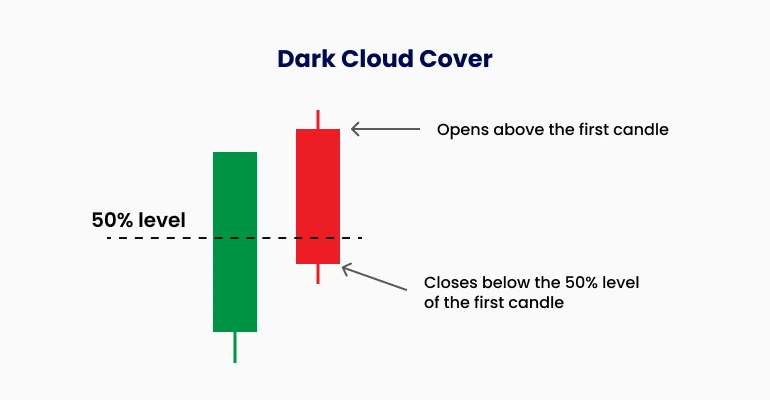
Description: A two-candle pattern where the second candle opens higher but closes below the midpoint of the first bullish candle.
Meaning: Signals aggressive selling pressure, hinting at a reversal.
5. Evening Star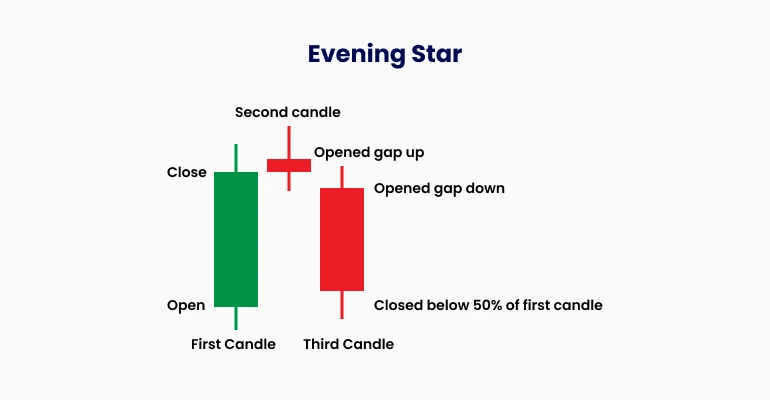
Description: A three-candle pattern consisting of:
A long bullish candle.
A small-bodied indecisive candle (gap up).
A bearish candle that closes into the body of the first bullish candle.
Meaning: Shows a transition from buying to selling dominance.
6. Three Black Crows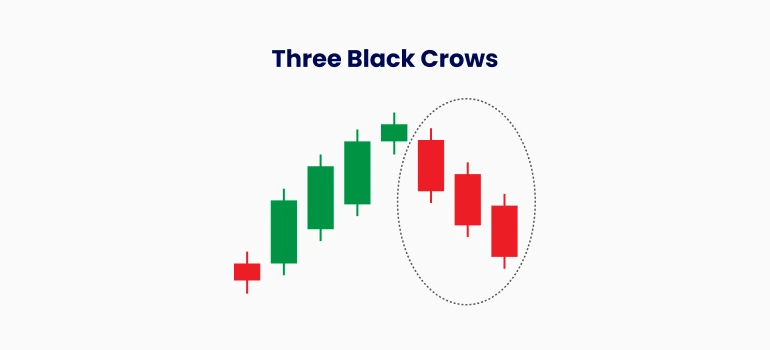
Description: Three consecutive bearish candles with progressively lower closes.
Meaning: Reflects strong and consistent selling pressure, signalling the start of a downtrend.
Neutral/Continuation Patterns
These patterns indicate market indecision or a continuation of the existing trend.
1. Doji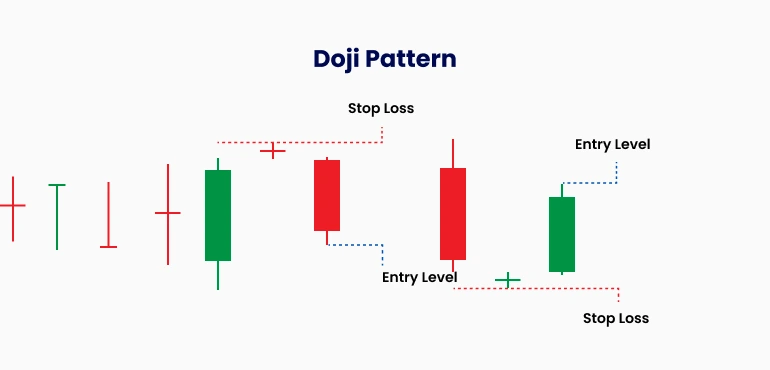
Description: A candle with little to no body, where the open and close prices are nearly equal.
Meaning: Reflects market indecision. Depending on the context, it can signal a reversal or continuation.
2. Spinning Top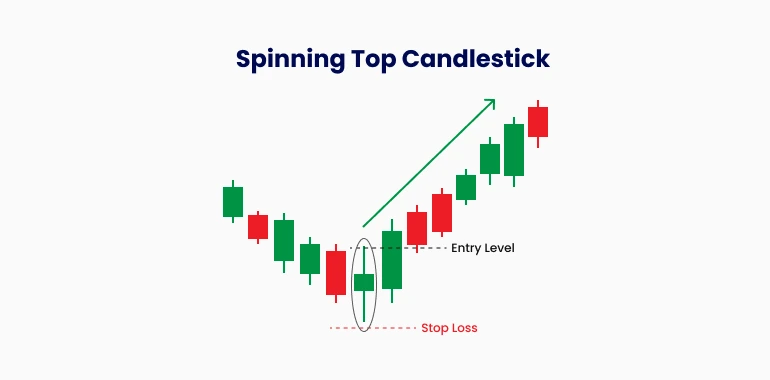
Description: A small body with long upper and lower shadows.
Meaning: Indicates market indecision, often found during periods of consolidation.
3. Marubozu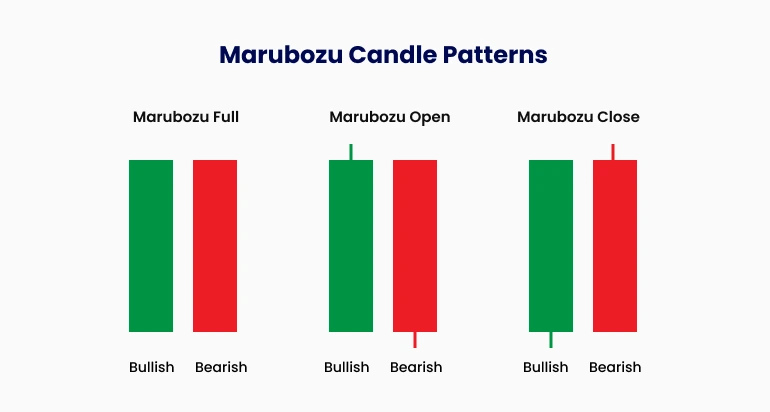
Description: A candle with no shadows, where the opening and closing occur at the extremes.
Bullish Marubozu: Shows strong buying momentum.
Bearish Marubozu: Indicates strong selling pressure.
4. Harami
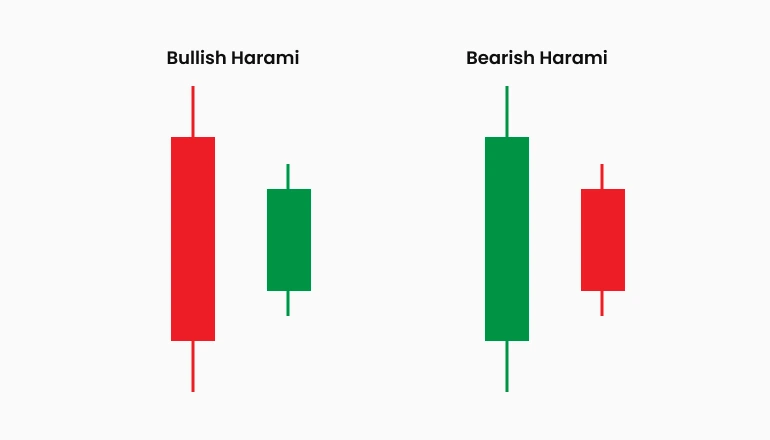
Description: A two-candle pattern where the second candle is smaller and contained within the body of the first.
Bullish Harami: Found at the bottom of a downtrend, signalling a potential reversal.
Bearish Harami: Found at the top of an uptrend, signalling a potential reversal.
Usage Tips
Combine Indicators: For better accuracy, use candlestick patterns alongside other tools like volume, RSI, or moving averages
Higher Timeframes: Patterns tend to be more reliable on higher timeframes.
Wait for Confirmation: Always look for additional signals (e.g., a follow-up candle) before acting.


