


Key Takeaways
Bearish Reversal: The classic head and shoulders setup is a bearish reversal most reliable after a clear uptrend, while the inverted variant is typically bullish after a downtrend.
How to trade Head and Shoulders: Clean structure like symmetry of formation helps, but the real edge comes from neckline behavior, breakout confirmation rules, and understanding where liquidity sits via volume price analysis.
Targets are usually derived from the head to neckline distance, but professionals rely on filters like solid support zones, volatility behaviour, liquidity and event risk.
The inverse head and shoulders pattern and inverted head and shoulders pattern are not “different patterns” mechanically, just the mirrored psychology.
Confluence tools (neckline breaking, candlestick close beyond support, multi timeframe levels, momentum, volume profile) increase signal quality, but they do not replace strict risk control.
What is Head and Shoulder Pattern in Chart Pattern Trading?
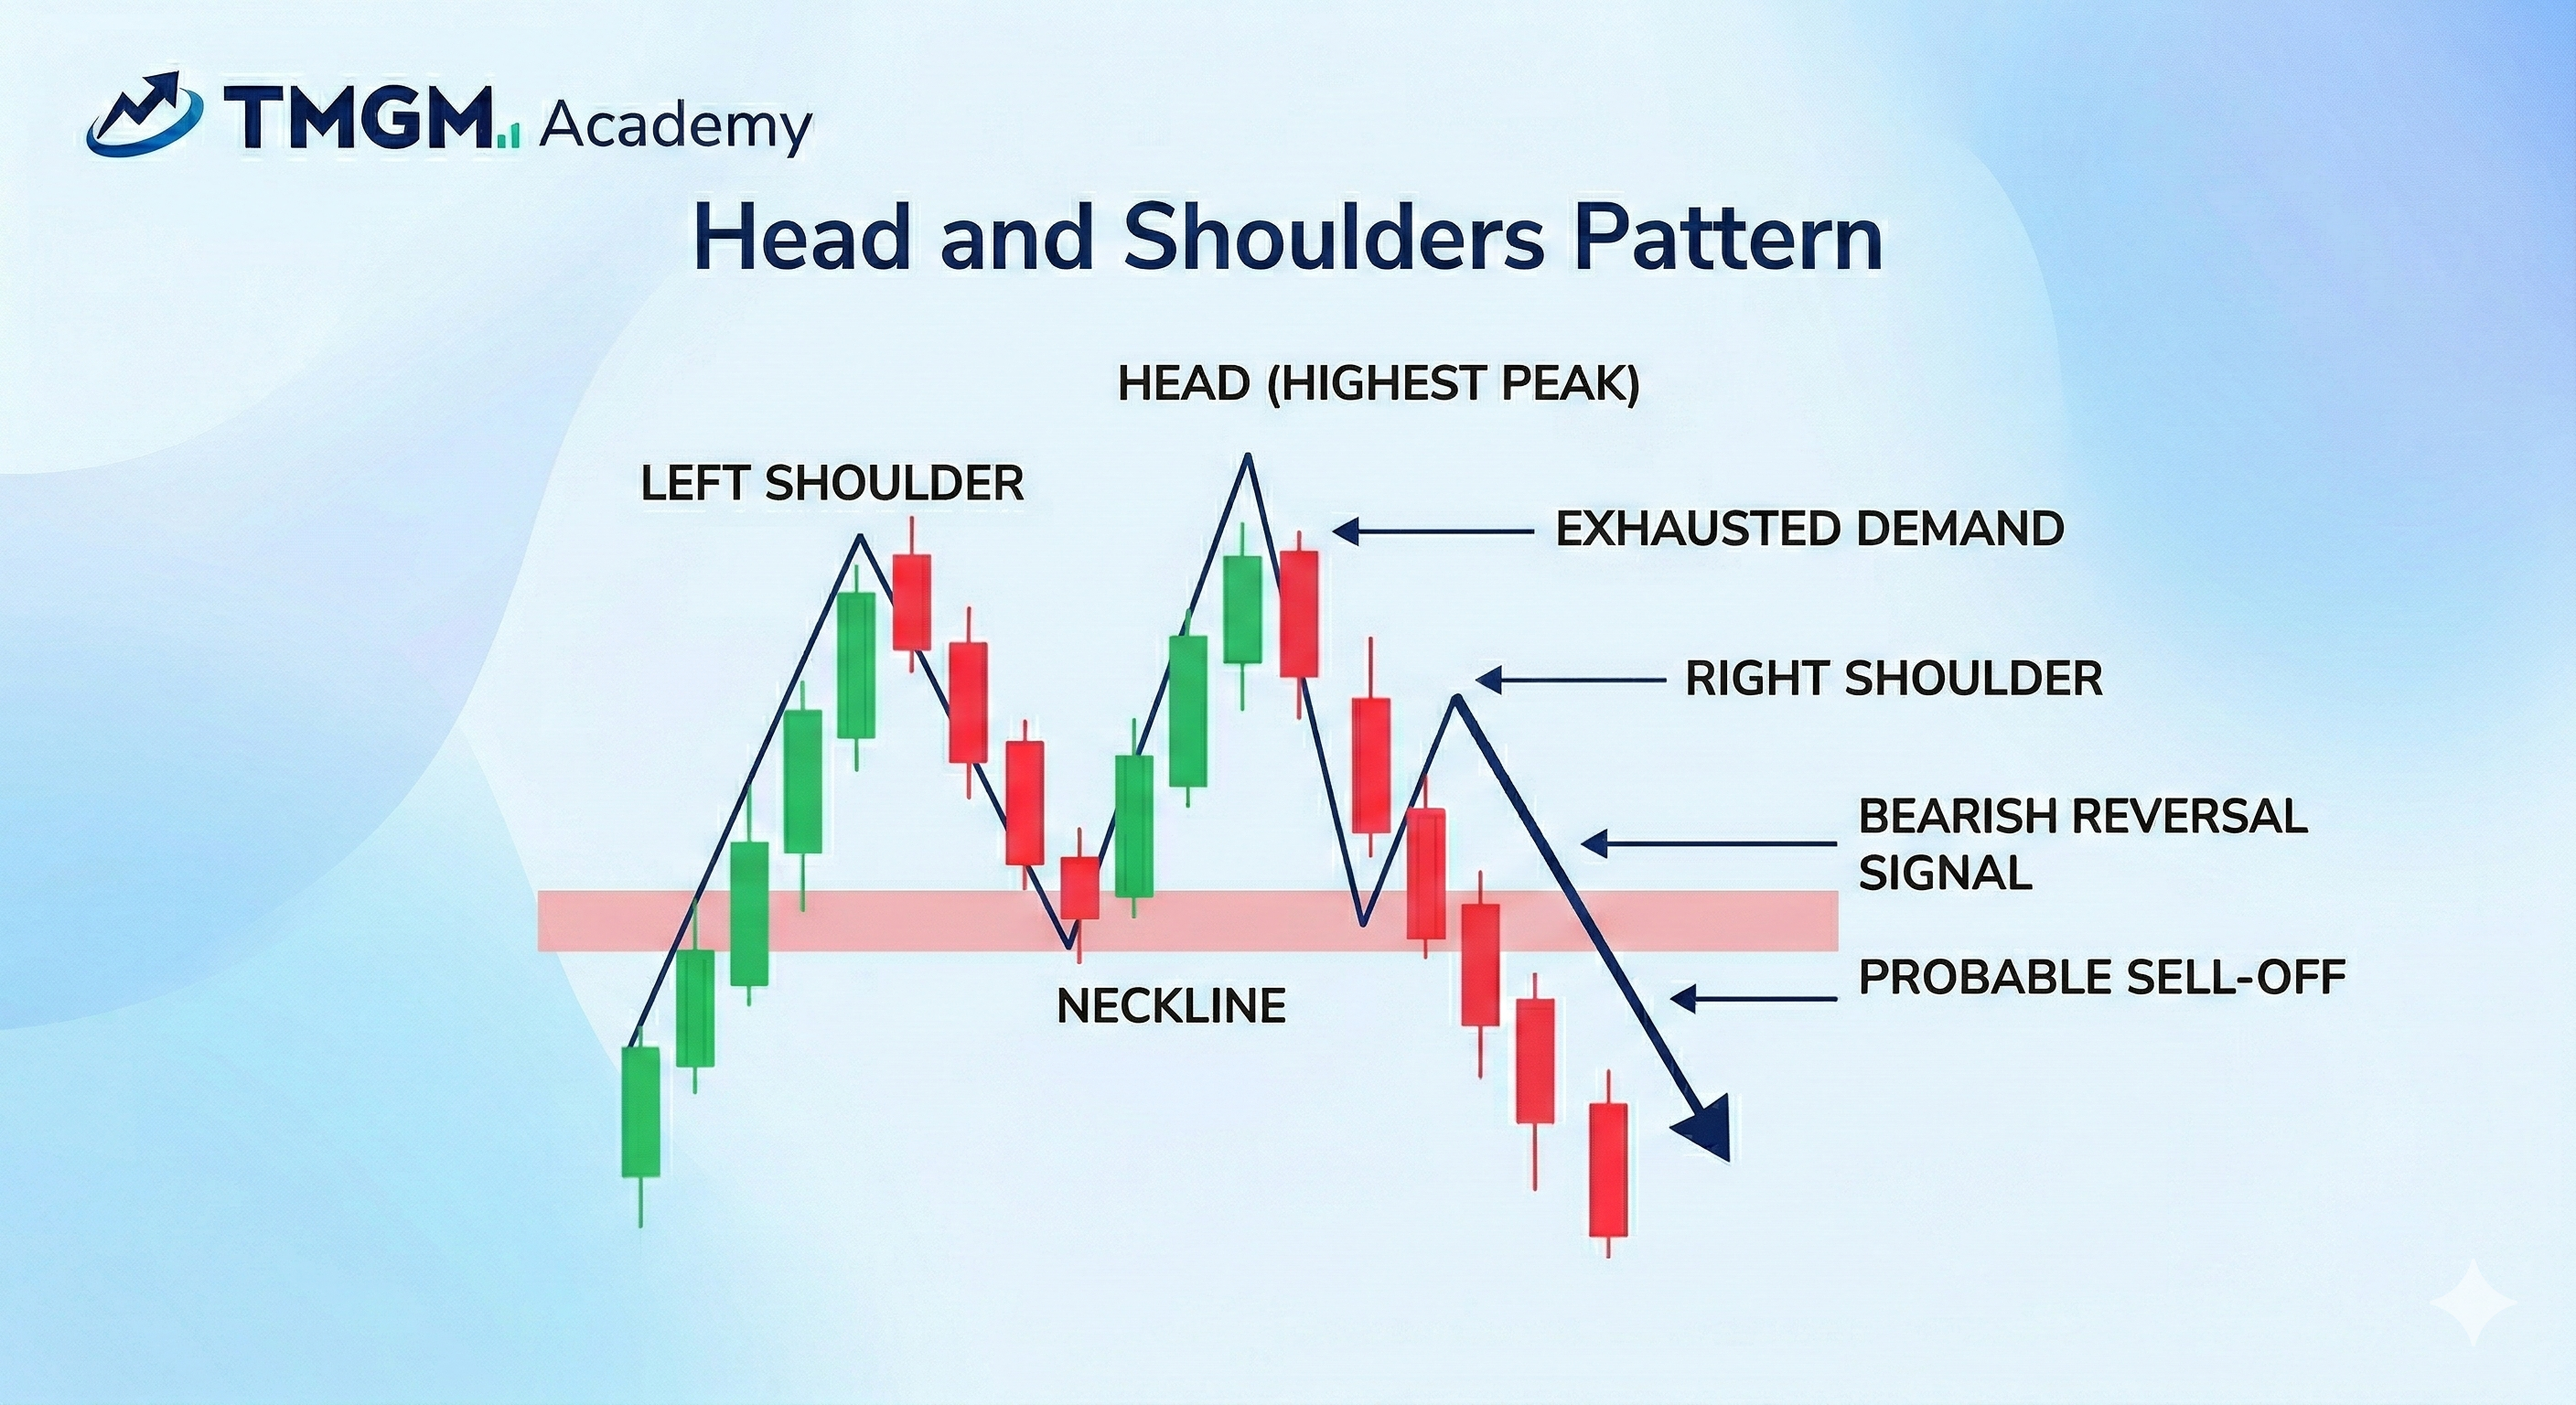
A head and shoulders pattern forms when an uptrend loses momentum: price makes a peak (left shoulder), pushes to a higher peak (head), then fails to exceed that high (right shoulder), and finally breaks the neckline. Traders treat the neckline break as the “decision point” where control shifts from buyers to sellers.
Important: A head and shoulders is not confirmed until there is a break and close beyond the neckline, otherwise it is just a visual guess.
How to Trade using Head and Shoulders Pattern? Original Research: Case Study
This step by step case study uses real price data from a live chart to show how a disciplined trader can confirm a head and shoulders setup, then plan entry, stop loss, target, and position risk.
Identify:
Clear 3 peaks (1 head, 2 shoulders), with a clear neckline support.
Confluence:
There are multiple confirmation signals here, from earliest signal to latest:
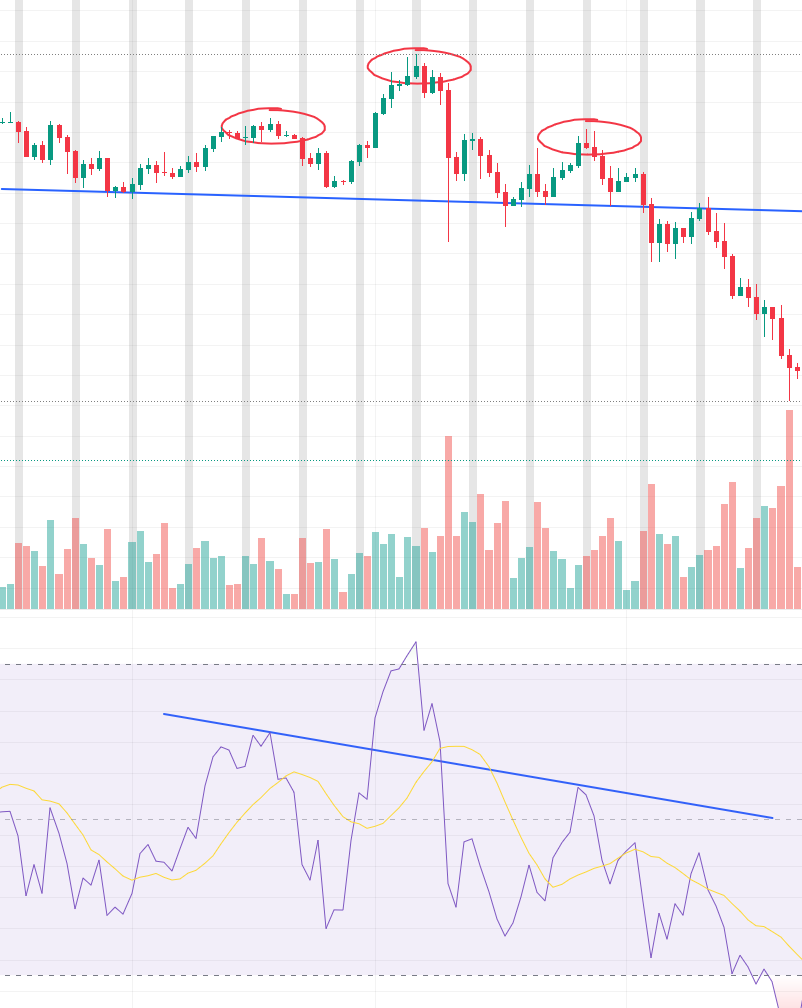
Price Action: The momentum on the right shoulder has obviously slowed down with the lower highs and lower lows
Volume: The momentum can be confirmed to be slowing down by observing the substantially more sell volumes on the right side after the head peak
Indicator Confluence: RSI showed that the momentum has a significantly lower head
Neckline Break & Candlestick Close: The candlestick that broke below the neckline, very clearly closed beyond the support and at the same it broke the neckline.
Entry
A conservative entry trigger can be palced when price closes below the neckline and the break is not immediately reclaimed on the next candle.
A more selective entry waits for a retest of the neckline that rejects (wick into the neckline, close back below).
Target Price:
A beginner’s way of placing the target price can be measuring the distance from the head to the neckline, and using the same distance from the neckline break point.
A more advanced practical approach is to use previous major support, accounting the volatility of the particular product.
RRR should be one of the important guidance on the distance of profit and stop-loss ratio.
Stop Loss
Common stop placement is above the right shoulder high, often with a small volatility buffer (for example, an ATR fraction) to reduce stop hunts.
Aggressive entries (right shoulder failure) require tighter invalidation and faster exit rules if price reclaims the shoulder.
Risk Management
Size the position so the stop represents a fixed risk unit (for example, profit to loss, 2R to 1R).
A more advanced move is once you hit your first R (1R, 50% profit target), you can reduce your trade size (say 30%-50%) and use a trailing stop behind lower highs. If spreads widen or liquidity thins (news windows, rollover), assume slippage is possible and reduce leverage.
Head and Shoulders Pattern Components and Pattern Anatomy
Pre-Requisite: Prior Trend
The pattern is more reliable when it appears after a well established uptrend with extended positioning (multiple impulsive legs up, rising moving averages, strong prior momentum). In choppy ranges, head and shoulders shapes appear frequently, behaving like noise and is less reliable.
Component: Pattern Structure
A clean structure is three peaks with the head clearly higher than the shoulders and a neckline that is identifiable across multiple touches. Symmetry is helpful, but the true reliable tell is that the right shoulder fails to attract fresh buyers at the same intensity as the left side.
Peaks:
The anatomy requires three distinct peaks: a Left Shoulder (an initial high), a Head (a higher high showing a final thrust of buying pressure), and a Right Shoulder (a lower high). This sequence demonstrates a critical failure to maintain the bullish market structure.
Neckline:
The neckline acts as the structural foundation, drawn by connecting the swing lows between the three peaks. A definitive close below this dynamic support line is the ultimate trigger that confirms the pattern's completion.
Volume:
Volume analysis is non-negotiable for professional traders validating this setup. You should observe peak volume on the left shoulder, slightly lower volume on the head, and a significant drop in buying volume on the right shoulder, or even significant sell volume as bullish participation evaporates.
Pro Tip: True pattern validation requires a noticeable volume contraction during the right shoulder's formation, indicating that aggressive buyers are entirely exhausted.
Double-Checking Pattern Structure
Useful Checks includes:
Neckline aligning with a key horizontal level,
Momentum divergence at the head
Rejection wicks at the right shoulder
A break that aligns with higher timeframe structure.
Standard vs. Inverted Head and Shoulders Pattern
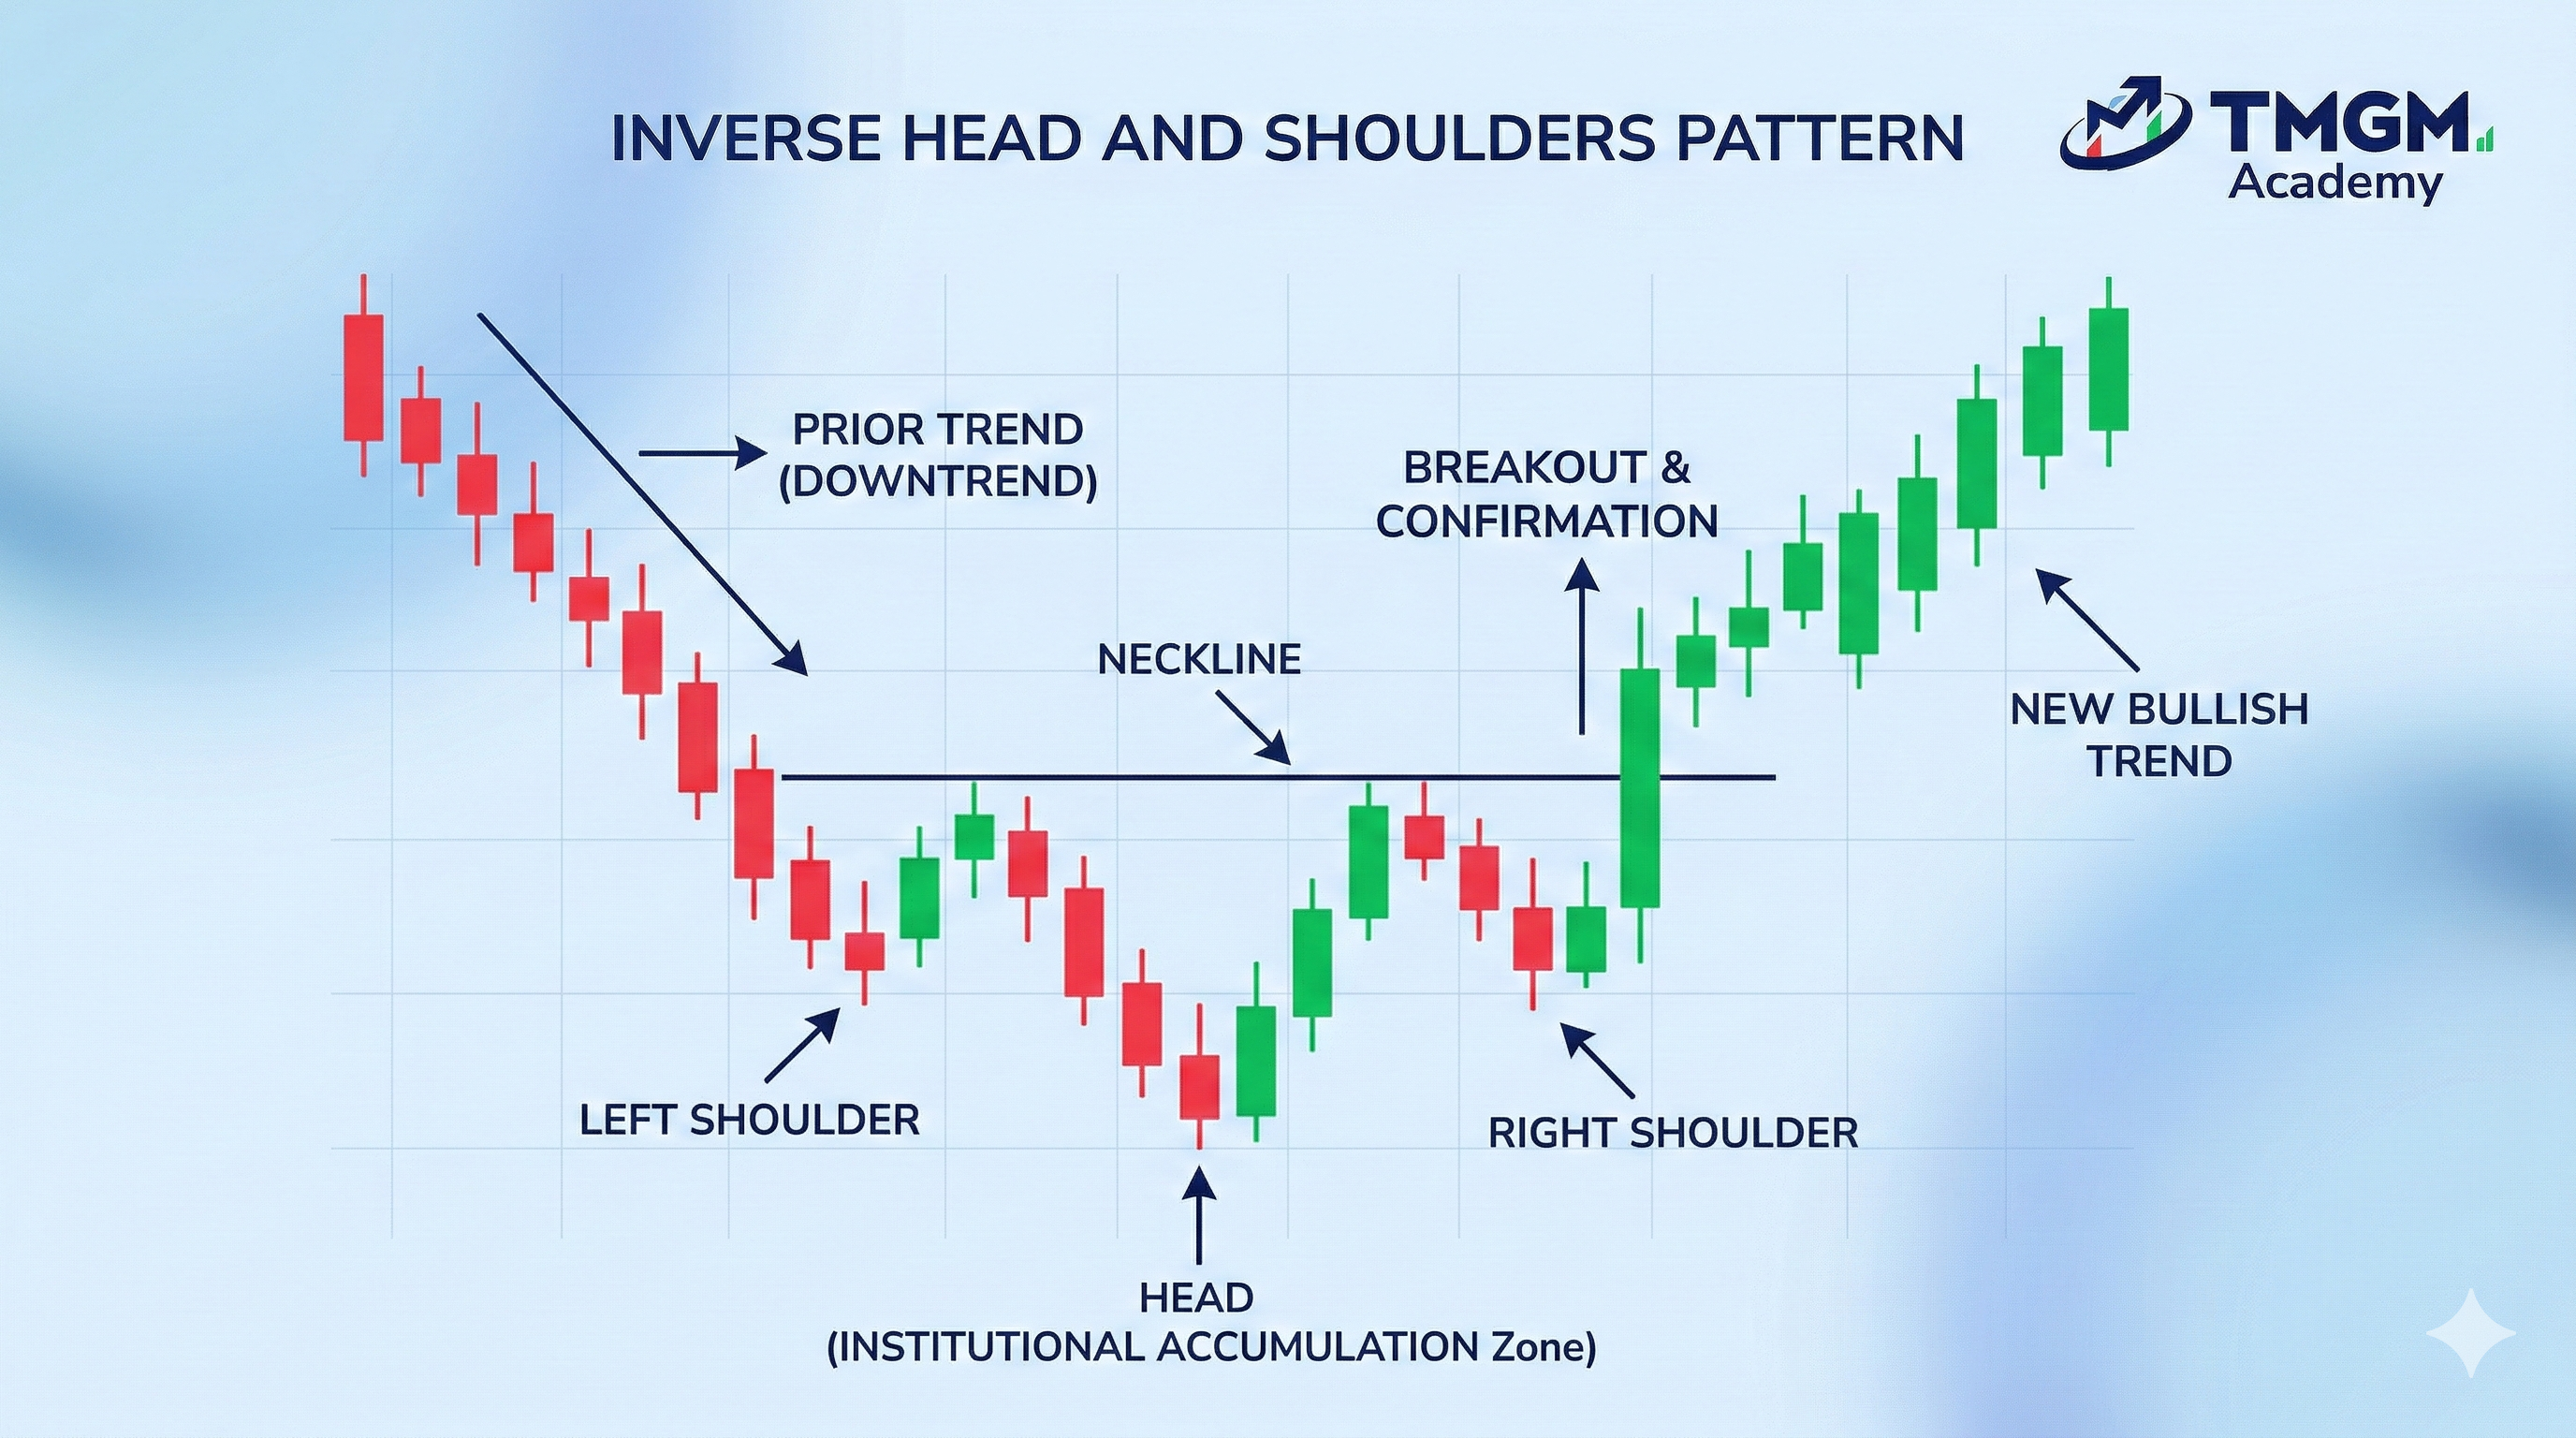
While the standard pattern is a topping signal, the inverted head and shoulders pattern forms at the bottom of a downtrend, hence signaling a trend reversal turning bullish.
Also commonly referred to as the inverse head and shoulders pattern, this bullish structure represents Investors accumulation. The psychology mirrors the standard pattern but in reverse: sellers fail to push prices into a lower low on the right shoulder, signaling that the supply overhang has been absorbed by enough buyers.
Multiple Heads and Shoulders & Confluence
In complex market environments, you may encounter formations with multiple left or right shoulders. When trading these complex structures, Confluence becomes critical; confirming signals like RSI bearish divergence or a bearish MACD crossover are extremely helpful to help filter out false breakdowns.
Market Behaviour & Psychology Behind Head & Shoulders Pattern
At its core, the pattern describes a shift from trend continuation buying to inventory distribution and eventual breakdown of support. The market transitions from “buyers comfortably lifting offers” to “buyers hesitating while sellers absorb.”
Price Action: Failed Attempts as Higher High (Resistance Holding)
The head is the final higher high attempt, but the right shoulder fails to repeat it, showing that resistance is holding and bids are weakening.
What's Happening behind Head and Shoulders Pattern? Market Psychology
The pattern forms because participants change behavior: early longs take profits, late buyers get trapped, and sellers gain confidence as the market cannot sustain new highs.
Once the neckline breaks, many stop losses, systematic sell triggers and trading bots add momentum in the same direction.
Below are a few scenarios where different market behaviour and psychology can explain what is happening behind the scene for head and shoulders pattern. It can be one of the scenarios happening, or multiple of it happening at once.
Institutional Distribution
Larger participants often reduce exposure into an uptrend to secure good selling prices. This can create the head and shoulder sequence as buy side demand gets exhausted around the top and right shoulder.
Traders Taking Profit, while Buyers are no longer Entering
As the trend matures, profit taking increases and new buyers become more selective due to a worse risk reward ratio (RRR) at elevated prices. The right shoulder reflects this: fewer buyers are willing to chase, so the seller side starts to take control.
Selling Pressure from Previously Trapped Investors
If price breaks the neckline after the right shoulder, it creates fear for any trapped long positions. Traders then often immediately exit on any bounceback, creating supply overhead. That supply can further turn the neckline retest into a strong rejection zone and accelerate the downward move.
Fundamental has changed (News, Earnings, etc)
Fundamentals like earnings expectations, sell the news behaviour, major news can cause traders to react to an uptrend negatively, forming the head and shoulders pattern.
FAQ (People Also Ask)
1) Is the head and shoulders pattern reliable for trading?
It can be, but reliability depends on confirmation (neckline break and close), context (prior trend), and whether the break happens into major support or open space.
2) How do you calculate the head and shoulders target?
The common method measures the distance from the head to the neckline and projects it from the neckline break, then adjusts for nearby higher timeframe levels.
3) What is the difference between an inverse and inverted head and shoulders pattern?
They are used interchangeably by most traders: both describe the bullish mirrored version that typically forms after a downtrend and confirms on an upside neckline break.