
Trade The World
Aerodrome Finance Price Forecast: AERO rebounds as Open Interest jumps
Por Vishal Dixit
Data de Publicação: 5 Sep 2025 | Data de Modificação: 5 Sep 2025


POPULAR ARTICLES

Aerodrome Finance (AERO) appreciates over 4% at press time on Friday, bouncing off the 50-day Exponential Moving Average (EMA). The technical and derivative data uphold a bullish outlook, suggesting extended gains ahead.
- Aerodrome Finance rebounds after a retest of the 50-day EMA.
- The AERO Open Interest records a double-digit rise, signaling higher activity among traders.
- The technical outlook holds a bullish bias, suggesting a potential run to $1.48.
Aerodrome Finance (AERO) appreciates over 4% at press time on Friday, bouncing off the 50-day Exponential Moving Average (EMA). The technical and derivative data uphold a bullish outlook, suggesting extended gains ahead.
Optimism sparks in AERO derivatives
CoinGlass data shows that the AERO Open Interest (OI) has increased over 10% in the last 24 hours, reaching $85.92 million. This sudden increase in capital inflow, fueling the active positions of AERO futures and option active contracts, displays a risk-on shift among derivatives traders.
Adding to the increased optimism, the OI-weighted funding rate has flipped positive to 0.0116%, up from -0.0026% earlier on the day. This implies a buy-side dominance as bulls pay the premium to align swap and spot prices.
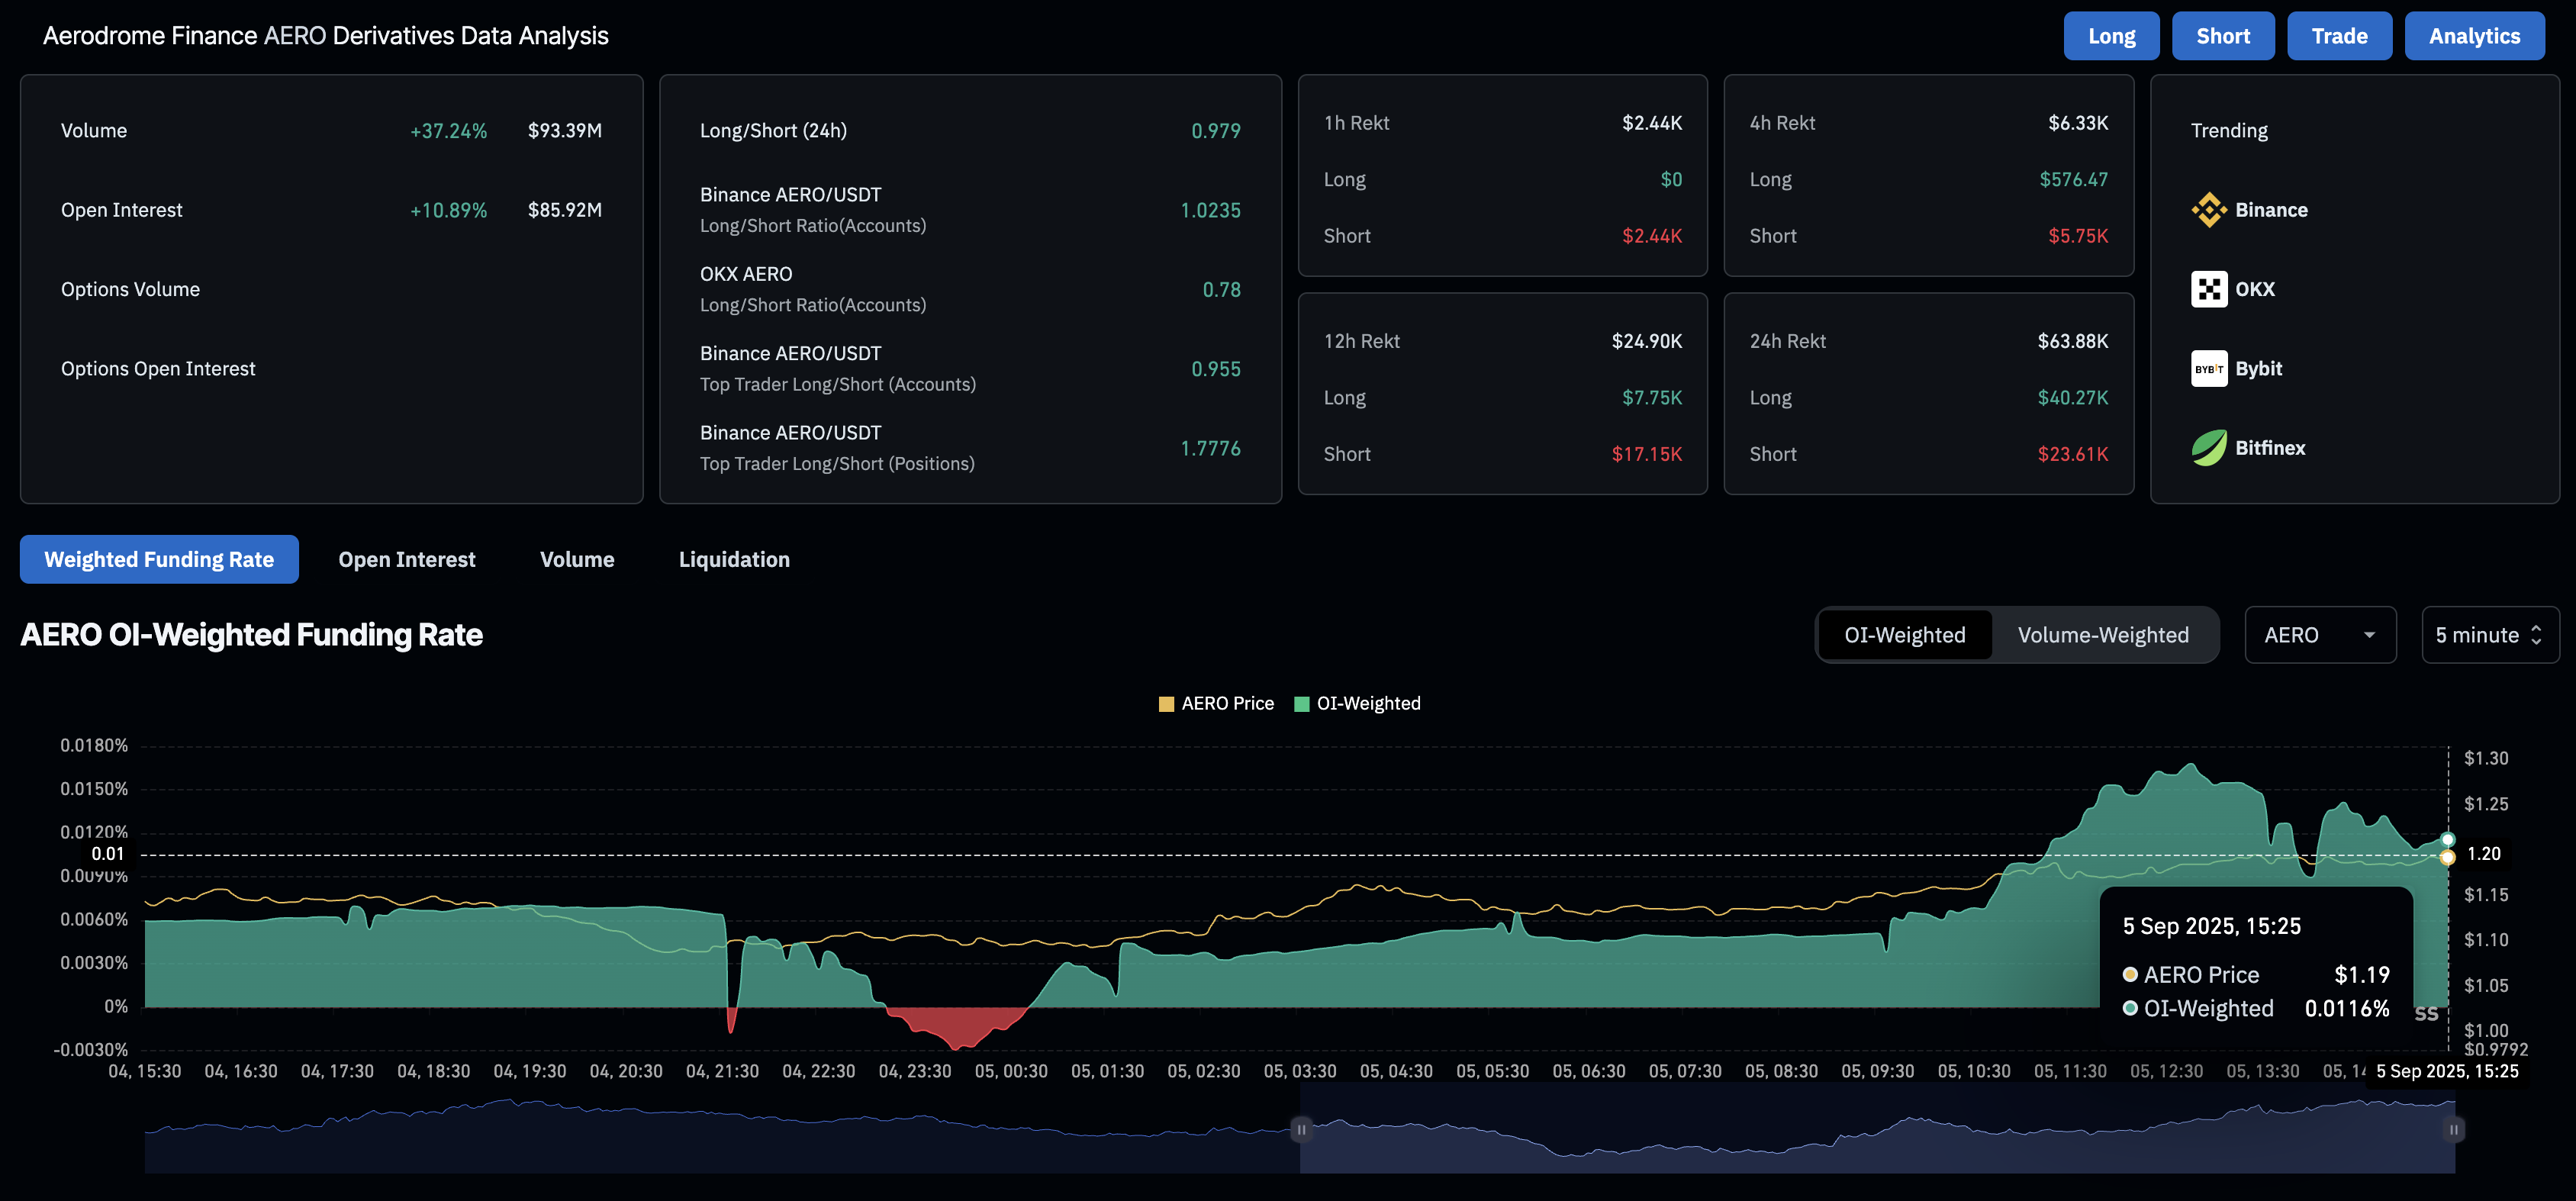
Aerodrome Finance derivatives. Source: Coinglass
Aerodrome Finance prepares to lift off, targeting key resistance
Aerodrom edges higher by over 4% so far on Friday, holding above the 61.8% Fibonacci retracement, drawn from the $2.33 high of December 12 to the $0.28 low from April 7, at $1.04. The recovery run targets the 78.6% Fibonacci retracement at $1.48 as the 50-day EMA provided dynamic support, increasing upside chances.
The technical indicators on the daily chart signal a potential shift in trend momentum. The Moving Average Convergence Divergence (MACD) shows a declining intensity of the red histogram bars. Sidelined investors could consider the MACD crossing above its signal line as a buy signal, as it will confirm a bullish shift in trend momentum.
Additionally, the Relative Strength Index (RSI) at 50 on the same chart remains neutral. If the RSI edges above the halfway line, it will signal a bullish tilt with further room for growth.
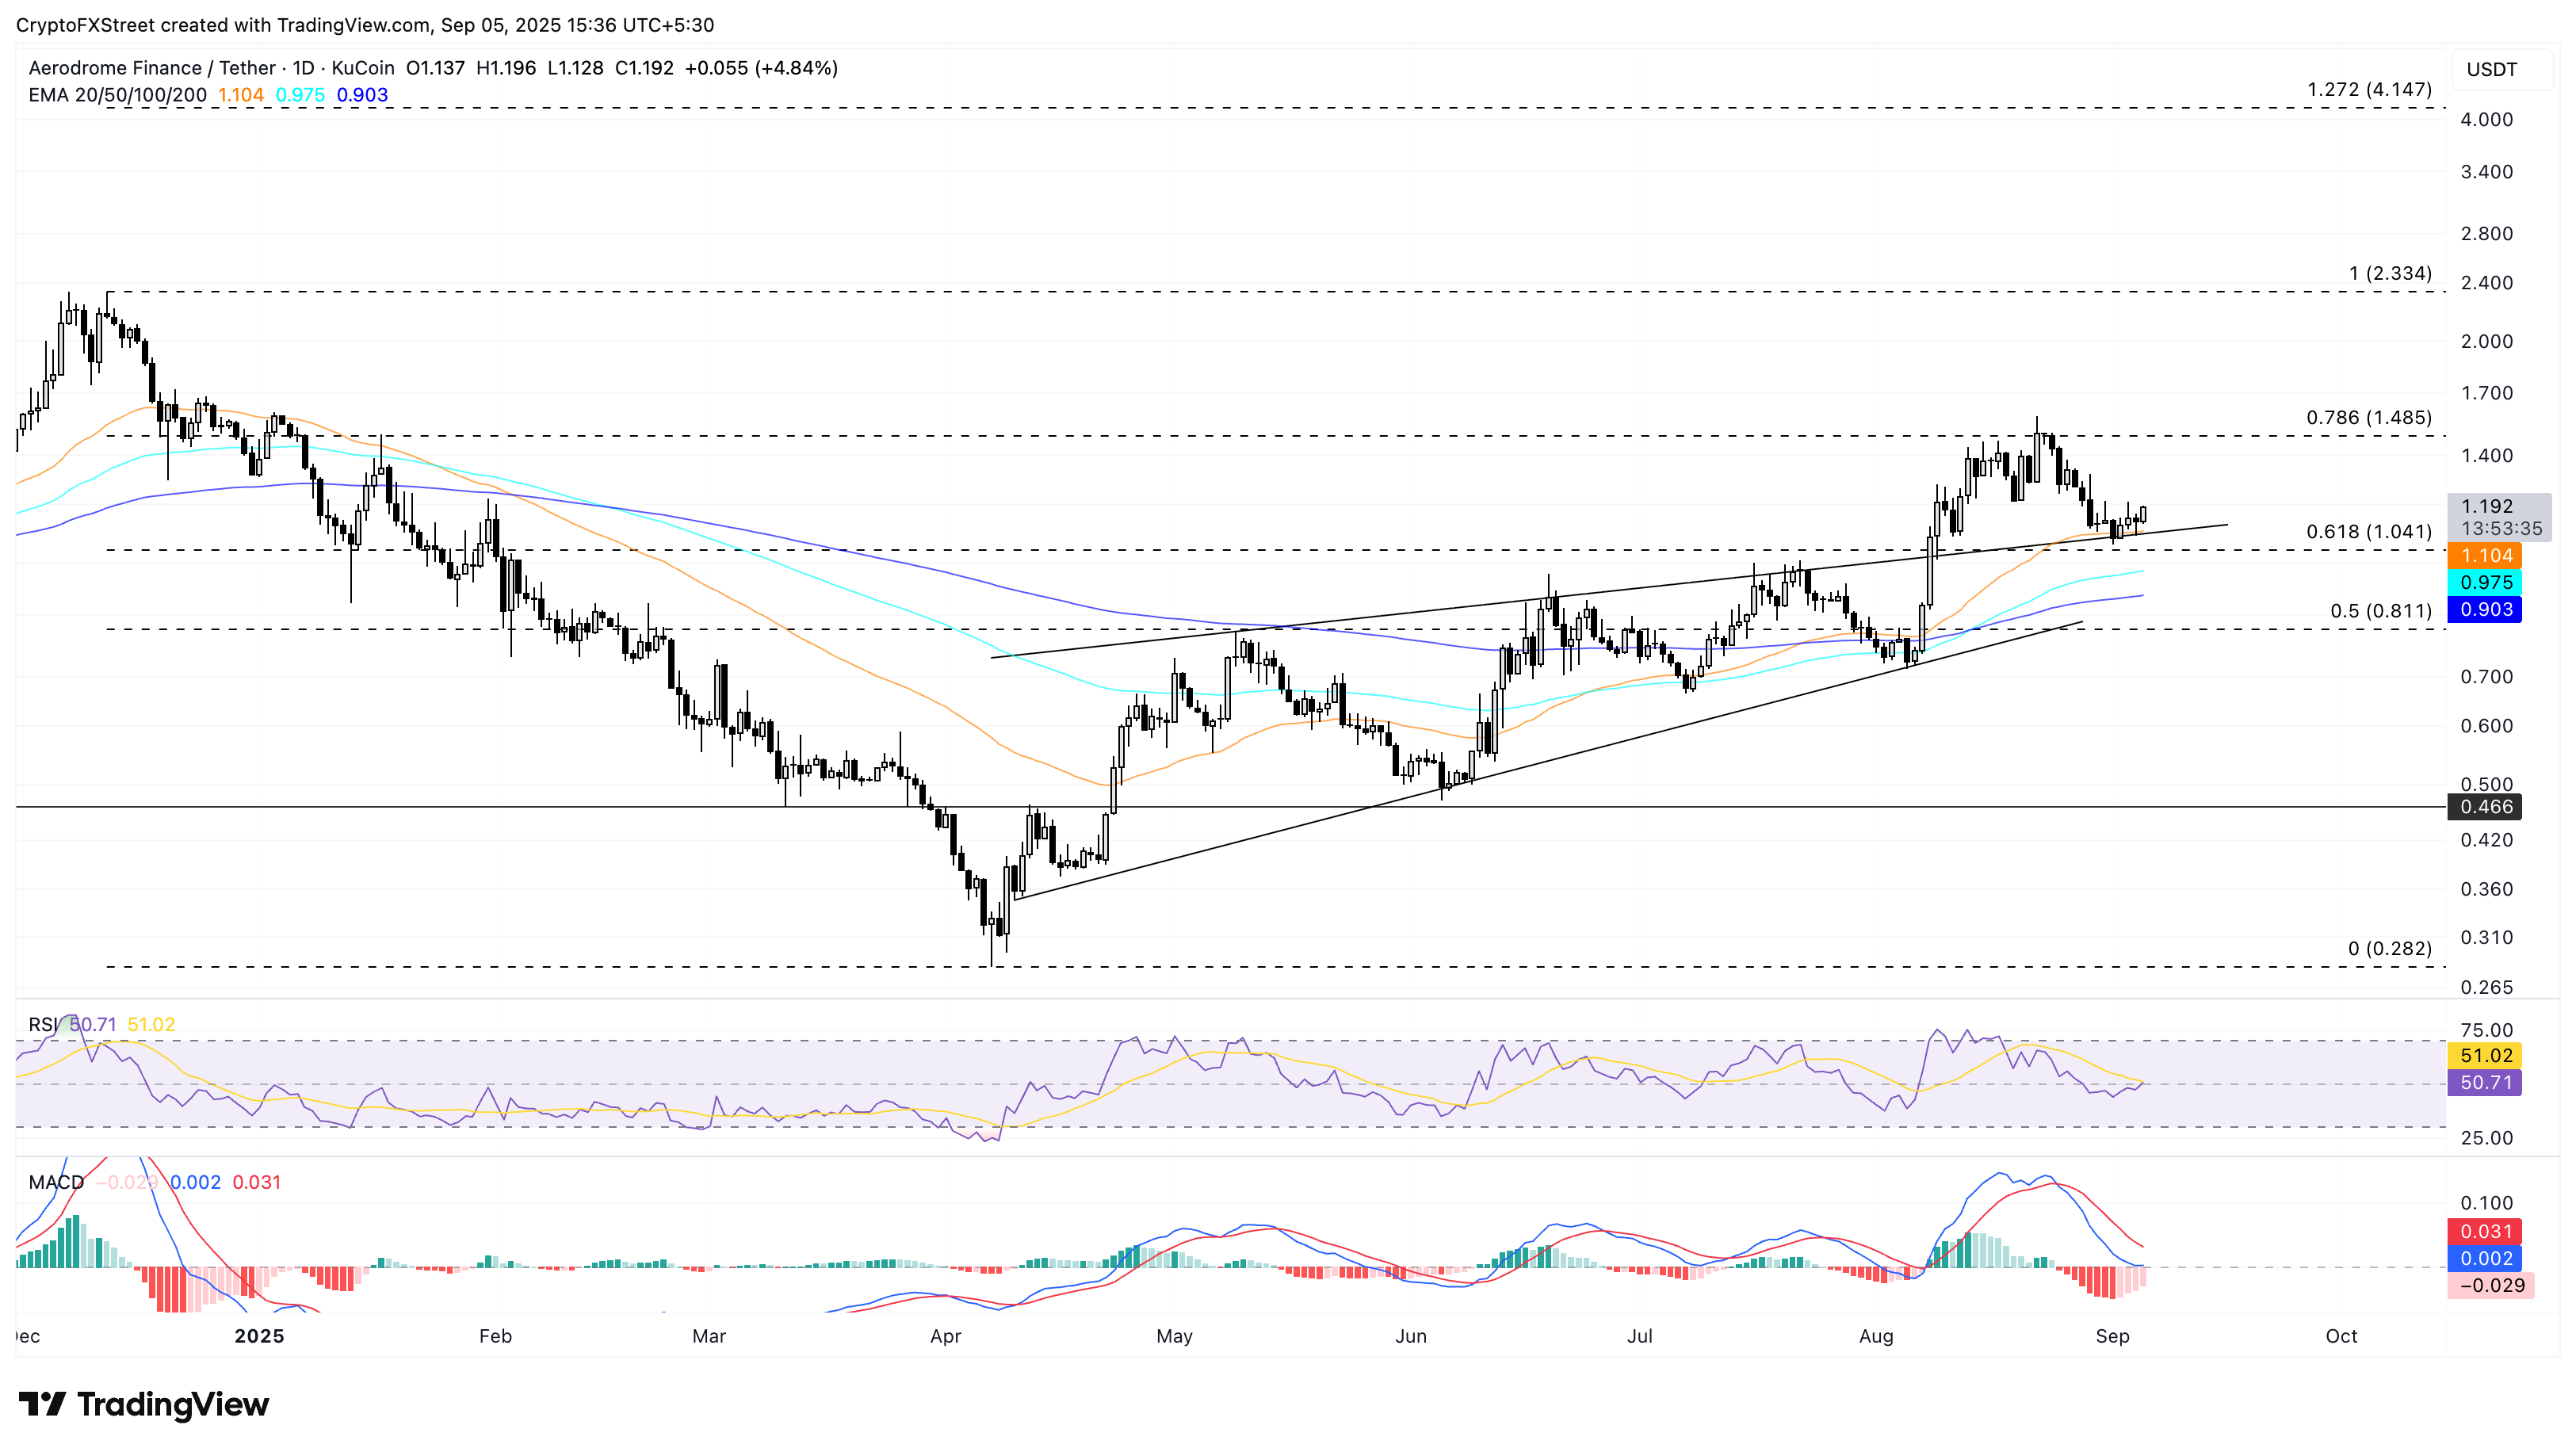
AERO/USDT daily price chart.
On the contrary, a potential reversal below the 50-day EMA at $1.10 could result in a drop to the 100-day EMA at $0.97.

FXStreet
Mais de um milhão de usuários confiam na FXStreet para dados de mercado em tempo real, ferramentas de gráficos, insights de especialistas e notícias de Forex. Seu calendário econômico abrangente e webinars educacionais ajudam os traders a se manterem informados e tomarem decisões calculadas. A FXStreet conta com uma equipe de cerca de 60 profissionais, divididos entre a sede em Barcelona e diversas regiões globais.
Read More


