
$4,000: Major level comes into focus as stronger US Dollar weighs on Gold
Por Vishal Chaturvedi
Atualizado: 23 Jun 2026


ARTIGOS POPULARES

Gold (XAU/USD) trades on the back foot on Monday, pressured by a stronger US Dollar (USD) and rising expectations that the Federal Reserve (Fed) could raise interest rates later this year.
- Gold weakens as a stronger US Dollar and rising Fed rate hike bets weigh on sentiment.
- Traders price in a 70% chance of a September Fed rate hike as focus shifts to the US PCE inflation report.
- XAU/USD's technical outlook remains bearish, with price action gravitating toward lower Bollinger Band support near $4,044.
Gold (XAU/USD) trades on the back foot on Monday, pressured by a stronger US Dollar (USD) and rising expectations that the Federal Reserve (Fed) could raise interest rates later this year. Traders are also closely monitoring ongoing US-Iran negotiations after both sides signed a 60-day Memorandum of Understanding (MoU) last week.
At the time of writing, XAU/USD is trading around $4,123 after briefly slipping below the $4,100 mark earlier in the day.
Gold bulls remain on the sidelines as prospects of higher interest rates in the US is driving demand for the US Dollar and Treasury yields, even as easing tensions in the Middle East have sent Oil prices lower, reducing fears of a sustained inflationary shock.
At last week's meeting, Fed Chair Kevin Warsh reaffirmed the central bank's commitment to bringing inflation back to its 2% target, with a majority of Federal Open Market Committee (FOMC) members leaning toward a tighter monetary policy stance.
The US Dollar Index (DXY), which tracks the Greenback's value against a basket of six major currencies, is hovering around 101.24, its highest level since May 2025.
The combination of a firmer US Dollar and higher Treasury yields is keeping the precious metal in a correction phase after a remarkable two-year rally fueled by geopolitical tensions, central bank buying and Fed rate cuts.
What's next for Gold?
Attention now turns to this week's US Personal Consumption Expenditures (PCE) inflation data and the final estimate of first-quarter Gross Domestic Product (GDP), which could provide fresh guidance on the Fed's policy path.
Unless the Fed's hawkish stance shifts meaningfully, higher-for-longer interest rate expectations are likely to remain a headwind for Gold, which tends to perform best in a low-interest-rate environment. The CME FedWatch Tool shows traders are pricing in a 70% chance of a rate hike at the September meeting.
According to the World Gold Council's Weekly Markets Monitor, if the US Dollar Index (DXY) sustains its rally above the 100 mark, it could signal an extension of Gold's downtrend.
The council said, "Support would then be seen next at US$3,887/oz-US$3,857/oz, which includes the 38.2% retracement of the entire rise in Gold from the 2015 low where we would look for fresh signs of a potential floor here. Should weakness extend, we would see next major support at the October 2025 high at US$3,500/oz."
Technical Analysis:
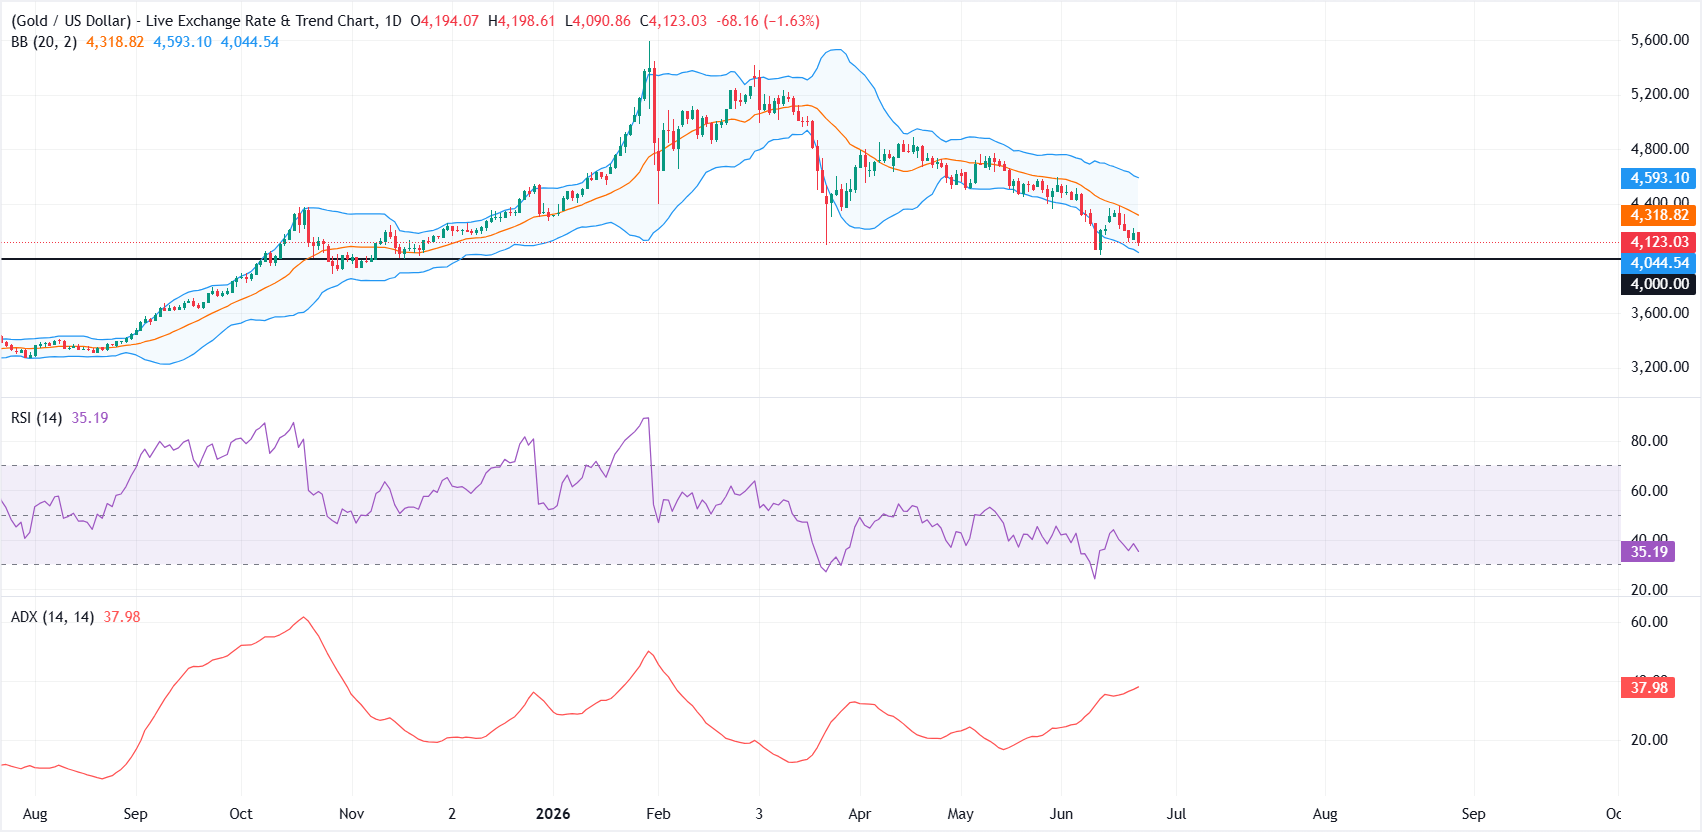
XAU/USD retains a bearish near-term tone as it sits beneath the 20-day Bollinger Simple Moving Average around $4,318.64.
Price action is gravitating toward the lower band support near $4,043.85, while the Relative Strength Index (RSI) on the daily chart lingers in the mid-30s, hinting at persistent downside pressure rather than a decisive oversold capitulation. A rising Average Directional Index (ACX) near 38 suggests the prevailing downtrend remains relatively strong.
On the topside, initial resistance is now aligned with the 20-day Bollinger SMA at roughly $4,318.82, with the upper band near $4,593.10 offering a more distant cap should a corrective bounce develop.
On the downside, the lower Bollinger band around $4,044.54 acts as the first notable floor, ahead of the more psychological and structural horizontal support at $4,000.00, where sellers could be tempted to lock in profits and trigger a short-term pause in the decline.
(The technical analysis of this story was written with the help of an AI tool.)
US Dollar Price Today
The table below shows the percentage change of US Dollar (USD) against listed major currencies today. US Dollar was the strongest against the Australian Dollar.
| USD | EUR | GBP | JPY | CAD | AUD | NZD | CHF | |
|---|---|---|---|---|---|---|---|---|
| USD | 0.33% | 0.24% | -0.06% | 0.21% | 0.94% | 0.61% | 0.12% | |
| EUR | -0.33% | -0.10% | -0.42% | -0.15% | 0.56% | 0.26% | -0.22% | |
| GBP | -0.24% | 0.10% | -0.30% | -0.03% | 0.68% | 0.37% | -0.11% | |
| JPY | 0.06% | 0.42% | 0.30% | 0.26% | 0.99% | 0.67% | 0.17% | |
| CAD | -0.21% | 0.15% | 0.03% | -0.26% | 0.74% | 0.42% | -0.08% | |
| AUD | -0.94% | -0.56% | -0.68% | -0.99% | -0.74% | -0.29% | -0.80% | |
| NZD | -0.61% | -0.26% | -0.37% | -0.67% | -0.42% | 0.29% | -0.51% | |
| CHF | -0.12% | 0.22% | 0.11% | -0.17% | 0.08% | 0.80% | 0.51% |
The heat map shows percentage changes of major currencies against each other. The base currency is picked from the left column, while the quote currency is picked from the top row. For example, if you pick the US Dollar from the left column and move along the horizontal line to the Japanese Yen, the percentage change displayed in the box will represent USD (base)/JPY (quote).

Mais de um milhão de usuários confiam na FXStreet para dados de mercado em tempo real, ferramentas de gráficos, insights de especialistas e notícias de Forex. Seu calendário econômico abrangente e webinars educacionais ajudam os traders a se manterem informados e tomarem decisões calculadas. A FXStreet conta com uma equipe de cerca de 60 profissionais, divididos entre a sede em Barcelona e diversas regiões globais.
Ler mais


