
AUD/USD Price Forecast: Turns upside down as market sentiment turns risk-off
Por Sagar Dua
Atualizado: 23 Apr 2026


ARTIGOS POPULARES

The AUD/USD pair gives up its early gains and trades 0.24% lower around 0.7145 during the Asian trading session on Thursday.
- AUD/USD surrenders early gains and turns negative as investors turn risk-averse after Iranian attacks on three ships in Hormuz.
- Higher oil prices due to the Hormuz closure remain a key concern for global markets.
- Australian Composite PMI returns above 50.0 in April.
The AUD/USD pair gives up its early gains and trades 0.24% lower around 0.7145 during the Asian trading session on Thursday. The Aussie pair faces selling pressure as the market sentiment turns risk-averse, following Iranian attacks on three ships in the Strait of Hormuz, a vital passage to almost 20% of global energy supply.
Australian Dollar Price Today
The table below shows the percentage change of Australian Dollar (AUD) against listed major currencies today. Australian Dollar was the weakest against the US Dollar.
| USD | EUR | GBP | JPY | CAD | AUD | NZD | CHF | |
|---|---|---|---|---|---|---|---|---|
| USD | 0.06% | 0.11% | 0.03% | 0.02% | 0.25% | 0.29% | 0.12% | |
| EUR | -0.06% | 0.07% | -0.04% | -0.04% | 0.16% | 0.23% | 0.04% | |
| GBP | -0.11% | -0.07% | -0.09% | -0.11% | 0.11% | 0.17% | -0.03% | |
| JPY | -0.03% | 0.04% | 0.09% | -0.02% | 0.22% | 0.24% | 0.08% | |
| CAD | -0.02% | 0.04% | 0.11% | 0.02% | 0.24% | 0.27% | 0.08% | |
| AUD | -0.25% | -0.16% | -0.11% | -0.22% | -0.24% | 0.06% | -0.16% | |
| NZD | -0.29% | -0.23% | -0.17% | -0.24% | -0.27% | -0.06% | -0.20% | |
| CHF | -0.12% | -0.04% | 0.03% | -0.08% | -0.08% | 0.16% | 0.20% |
The heat map shows percentage changes of major currencies against each other. The base currency is picked from the left column, while the quote currency is picked from the top row. For example, if you pick the Australian Dollar from the left column and move along the horizontal line to the US Dollar, the percentage change displayed in the box will represent AUD (base)/USD (quote).
As of writing, S&P 500 futures trade 0.53% lower to near 7,100, reflecting a weak risk appetite of investors. The US Dollar Index (DXY), which tracks the Greenback’s value against six major currencies, is up 0.1% to near 98.70, the highest level seen in over a week.
According to a report from The Wall Street Journal (WSJ), Tehran fired on three ships in the Hormuz and escorted two of them to Iranian waters, and is bringing those ships to Iran.
Though the US-Iran ceasefire extension has diminished fears of military activities, higher oil prices due to the Hormuz closure are keeping currencies from economies that rely on oil imports to meet their energy needs under pressure.
On the economic data front, Australian flash S&P Global Purchasing Managers’ Index (PMI) data for April has come in stronger than the previous reading. The Composite PMI returns above 50.0, a figure that separates expansion from contraction. The overall business activity improved to 50.1 from 46.6 in March due to higher output from both the manufacturing and the services sectors.
AUD/USD technical analysis
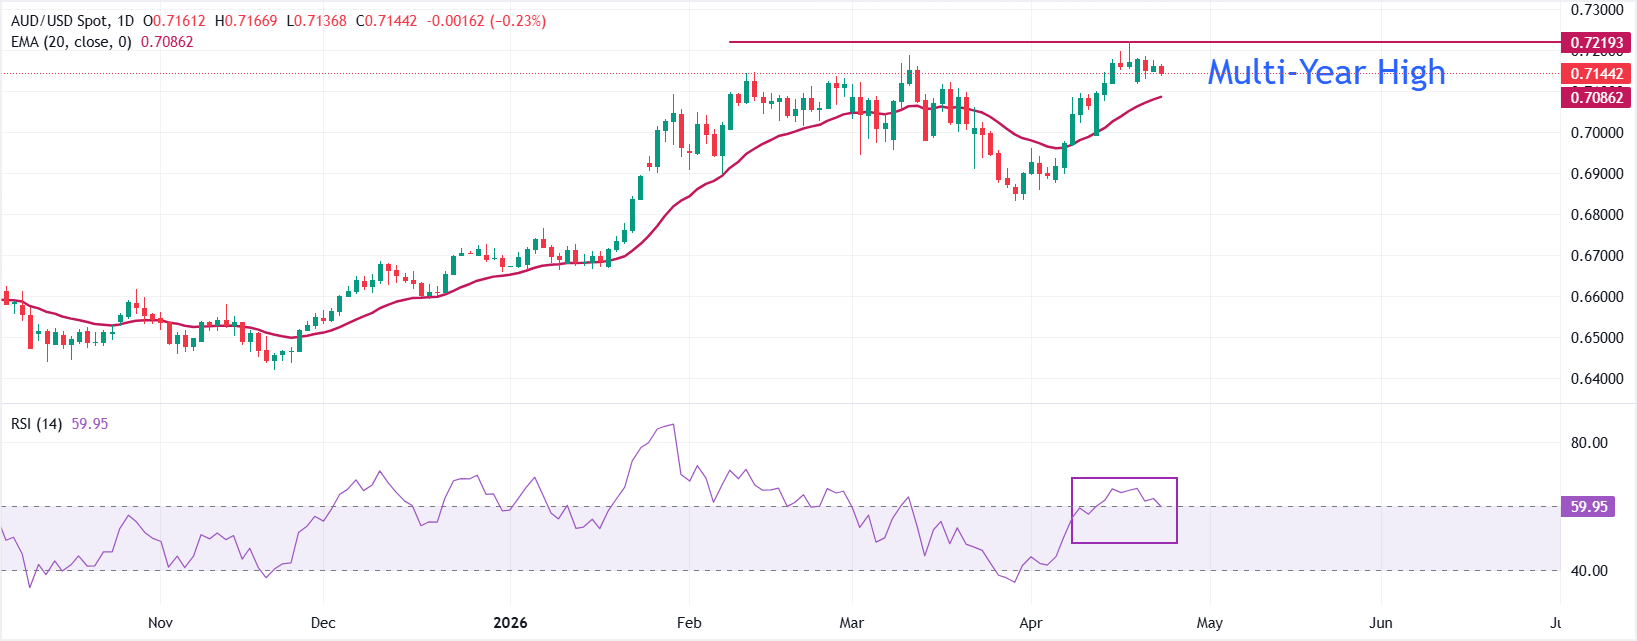
IAUD/USD trades lower at around 0.7145 as of writing; however, the pair holds a constructive near‑term bullish bias as spot remains above the 20-period Exponential Moving Average (EMA) at 0.7086, keeping the short-term trend supported after its recent recovery from sub-0.70 levels.
The Relative Strength Index (RSI) at about 60 stays in positive territory without entering overbought conditions, hinting that upside momentum is still present but not yet stretched.
On the downside, immediate support is defined by the 20-period EMA at 0.7086, where a break would signal fading bullish pressure and expose a deeper pullback toward recent lows. As long as AUD/USD defends this moving average on closing bases, the technical picture favors dip-buying strategies and keeps scope open for further gains in the sessions ahead.
Looking up, the multi-year high at 0.7222 is the major barrier for the pair; however, a breakout above the same would open the scope of extending the rally towards 0.7300.
Risk sentiment FAQs
In the world of financial jargon the two widely used terms “risk-on” and “risk off'' refer to the level of risk that investors are willing to stomach during the period referenced. In a “risk-on” market, investors are optimistic about the future and more willing to buy risky assets. In a “risk-off” market investors start to ‘play it safe’ because they are worried about the future, and therefore buy less risky assets that are more certain of bringing a return, even if it is relatively modest.
Typically, during periods of “risk-on”, stock markets will rise, most commodities – except Gold – will also gain in value, since they benefit from a positive growth outlook. The currencies of nations that are heavy commodity exporters strengthen because of increased demand, and Cryptocurrencies rise. In a “risk-off” market, Bonds go up – especially major government Bonds – Gold shines, and safe-haven currencies such as the Japanese Yen, Swiss Franc and US Dollar all benefit.
The Australian Dollar (AUD), the Canadian Dollar (CAD), the New Zealand Dollar (NZD) and minor FX like the Ruble (RUB) and the South African Rand (ZAR), all tend to rise in markets that are “risk-on”. This is because the economies of these currencies are heavily reliant on commodity exports for growth, and commodities tend to rise in price during risk-on periods. This is because investors foresee greater demand for raw materials in the future due to heightened economic activity.
The major currencies that tend to rise during periods of “risk-off” are the US Dollar (USD), the Japanese Yen (JPY) and the Swiss Franc (CHF). The US Dollar, because it is the world’s reserve currency, and because in times of crisis investors buy US government debt, which is seen as safe because the largest economy in the world is unlikely to default. The Yen, from increased demand for Japanese government bonds, because a high proportion are held by domestic investors who are unlikely to dump them – even in a crisis. The Swiss Franc, because strict Swiss banking laws offer investors enhanced capital protection.
(The technical analysis of this story was written with the help of an AI tool.)

Mais de um milhão de usuários confiam na FXStreet para dados de mercado em tempo real, ferramentas de gráficos, insights de especialistas e notícias de Forex. Seu calendário econômico abrangente e webinars educacionais ajudam os traders a se manterem informados e tomarem decisões calculadas. A FXStreet conta com uma equipe de cerca de 60 profissionais, divididos entre a sede em Barcelona e diversas regiões globais.
Ler mais


