
Cardano Price Forecast: ADA whale accumulation and derivatives data flag cautious recovery
Por Manish Chhetri
Atualizado: 30 Mar 2026


ARTIGOS POPULARES
Cardano (ADA) price recovers mildly, trading above $0.24 as of writing on Monday, after a two-week correction. Improving on-chain data and strengthening derivatives data support a possible recovery ahead for ADA.
- Cardano price recovers slightly on Monday after a two-week correction.
- On-chain and derivatives data back a recovery as whale accumulation rises alongside increasing long bets.
- Traders should remain cautious, as momentum indicators continue to signal a bearish outlook.
Cardano (ADA) price recovers mildly, trading above $0.24 as of writing on Monday, after a two-week correction. Improving on-chain data and strengthening derivatives data support a possible recovery ahead for ADA. However, traders should remain cautious, as momentum indicators continue to signal a bearish outlook.
Cardano’s whale exposure rises
Santiment data shows that certain whales have started accumulating ADA.
The Supply Distribution metric chart below indicates that whales holding between 100,000 and 1 million ADA tokens (red line) and 10 million and 100 million ADA tokens (blue line) have accumulated a total of 230 million tokens from Wednesday to Monday. During the same period, wallets holding between 1 million and 10 million ADA tokens (yellow line) have shed 30 million tokens.
This shows that the second cohort of whales could have fallen prey to a capitulation event. In contrast, the first set of wallets seized the opportunity and accumulated Cardano at a discount. Moreover, if this buying actively continues, the ADA price could extend the recovery.
 [08-1774842903642-1774842903642.18.27, 30 Mar, 2026].png)
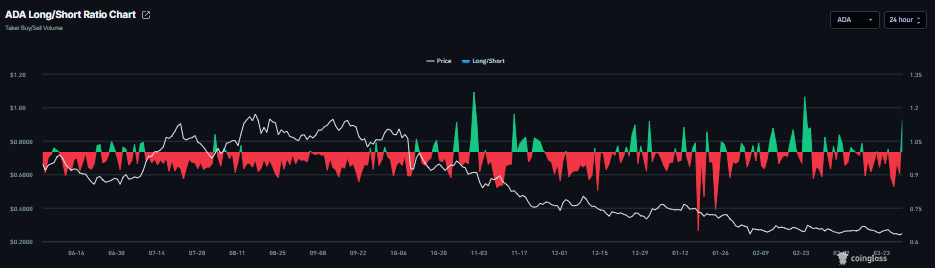
On the derivatives side, CoinGlass’s ADA long-to-short ratio, currently at 1.14 on Monday, is near its highest level in over a month. This ratio, above one, reflects bullish sentiment in the markets, as more traders are betting on the asset price to rise.
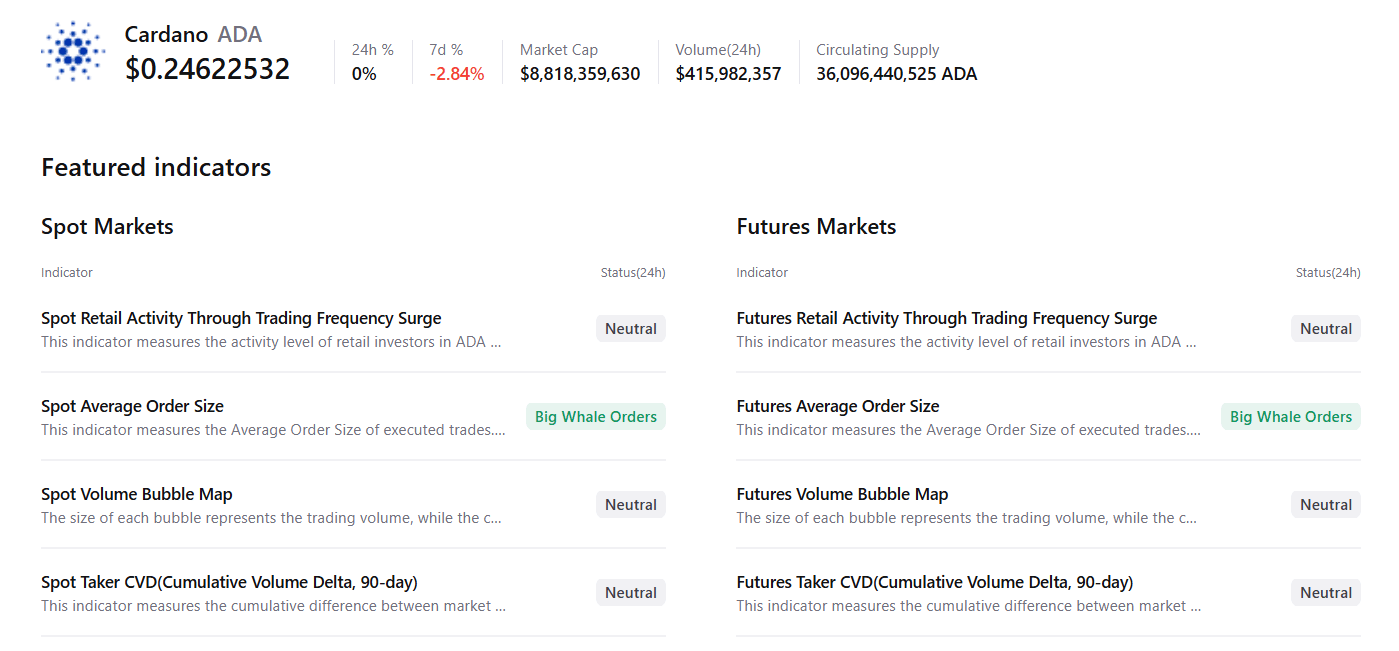
CryptoQuant summary data shows a neutral condition with a slight bullish tilt. ADA’s spot and futures markets show large whale orders with mostly neutral conditions across other metrics, suggesting a potential upside move.
Cardano Price Forecast: ADA momentum indicators show bearish bias
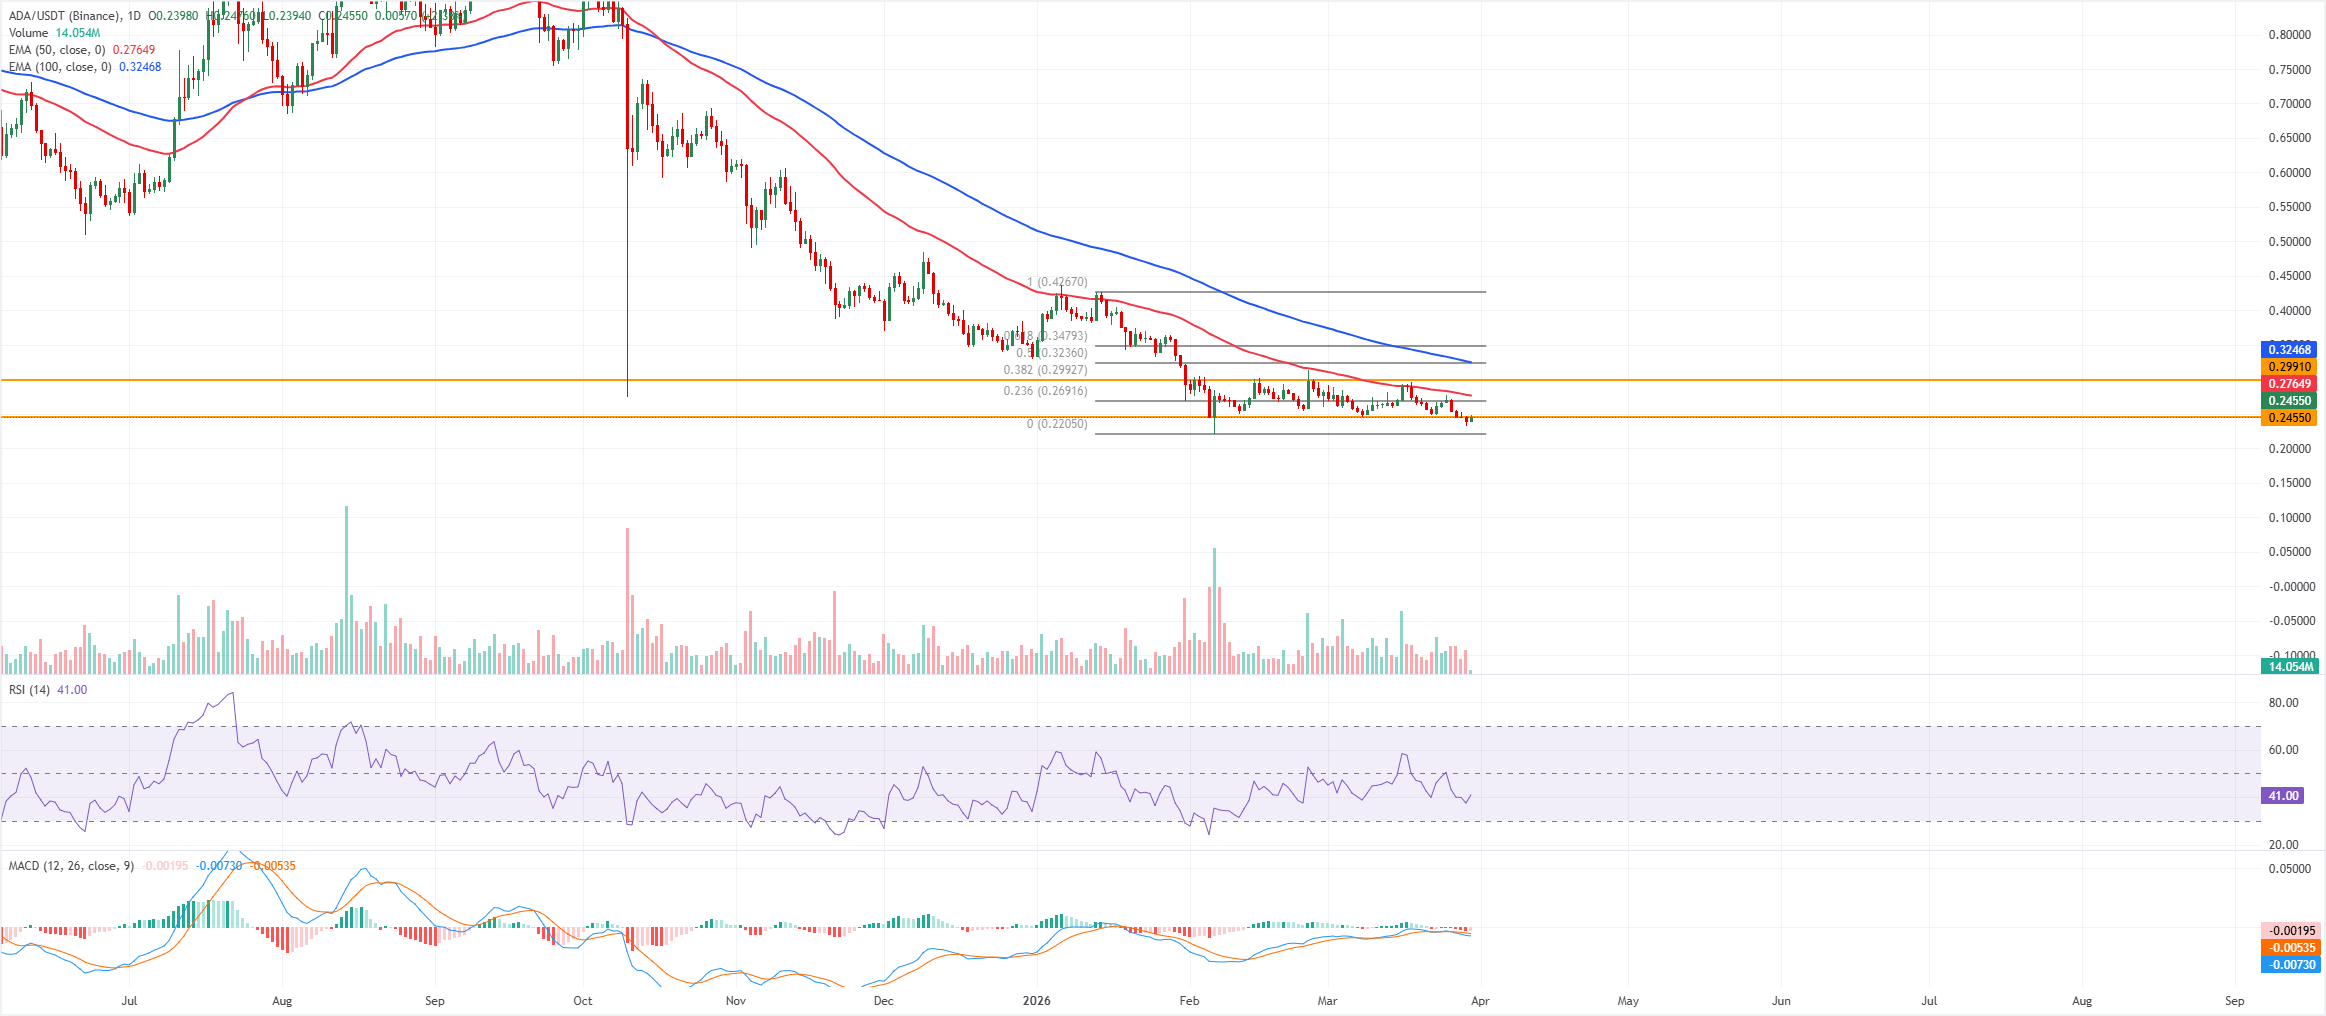
Cardano price is trading at $0.24 on Monday, down more than 4% in the previous week. The near-term bias is mildly bearish as price holds below the 50-day and 100-day Exponential Moving Averages (EMAs), which remain in a downtrend and cap rebounds.
The Relative Strength Index (RSI) on the daily chart at 41 underscores weak momentum, with sellers retaining the initiative while avoiding oversold extremes. The Moving Average Convergence Divergence (MACD) line remains below the signal line and has slipped back under the zero mark, and the negative histogram expansion suggests downside pressure is rebuilding after a brief stabilization phase.
Immediate support is located at the horizontal level near $0.23, and a clear break below it would extend control, opening space for a deeper slide toward the $0.22 area.
On the upside, initial resistance stands at $0.26, under the 23.6% retracement measured from the $0.42 high to the $0.22 low, followed by the horizontal barrier and prior congestion around $0.29, which aligns with the 38.2% retracement and the underside of the declining 50-day EMA. A daily close above $0.29 would be needed to challenge the current bearish tone and signal a more meaningful recovery.
(The technical analysis of this story was written with the help of an AI tool.)

Mais de um milhão de usuários confiam na FXStreet para dados de mercado em tempo real, ferramentas de gráficos, insights de especialistas e notícias de Forex. Seu calendário econômico abrangente e webinars educacionais ajudam os traders a se manterem informados e tomarem decisões calculadas. A FXStreet conta com uma equipe de cerca de 60 profissionais, divididos entre a sede em Barcelona e diversas regiões globais.
Ler mais


