

Crypto Market Overview: Bitcoin recovers on easing US-Iran tensions – DeXe, Arbitrum rally
- Bitcoin extends gains above $63,000 on Friday as bullish momentum holds steady.
- Risk-off sentiment eases in the crypto market as US-Iran tensions cool.
- DeXe and Arbitrum are leading gains over the last 24 hours.
Bitcoin (BTC) price rises above $63,000 at press time on Friday, extending its recovery as tensions between the US and Iran ease following missile strikes earlier this week. DeXe (DEXE) and Arbitrum (ARB) are leading gains over the last 24 hours as the broader market risk-off sentiment eases.

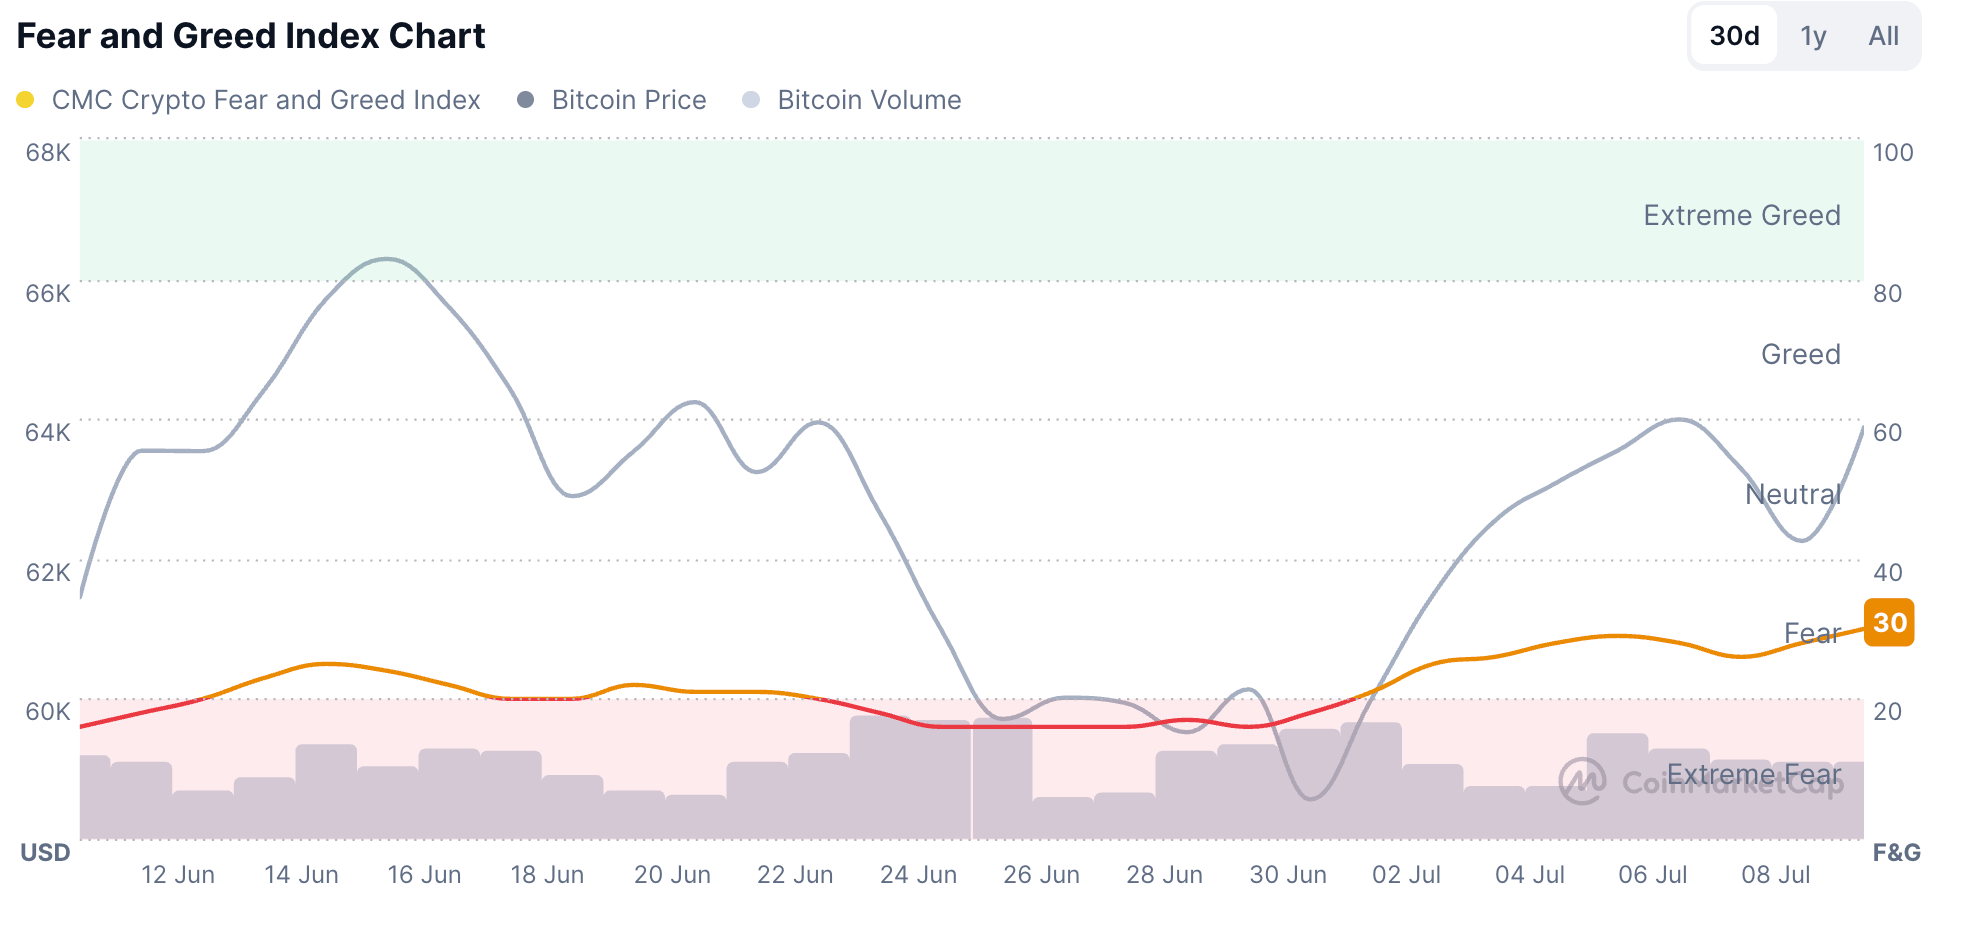
CoinMarketCap’s Fear and Greed Index is at 30 on Friday, up from 26 on Wednesday, reaffirming a mild increase in risk appetite among traders.
Bitcoin targets the 50-day EMA
Bitcoin maintains a mixed near-term bias as the short-term recovery approaches the 50-day Exponential Moving Average (EMA) at $65,398 and remains well under the 200-day EMA at $75,025. The pair is attempting to stabilize after recent losses, while the long-term moving averages reflect a broader bearish trend.
From a technical perspective, BTC must clear the 50-day EMA at $65,398, which could extend its recovery to $70,000.
The Relative Strength Index (RSI) at 52 on the daily chart ticks up from the midline, hinting at mildly improving momentum, while the Moving Average Convergence Divergence (MACD) rises with its signal line toward the zero line, suggesting that downside pressure may be easing even as price remains structurally capped.
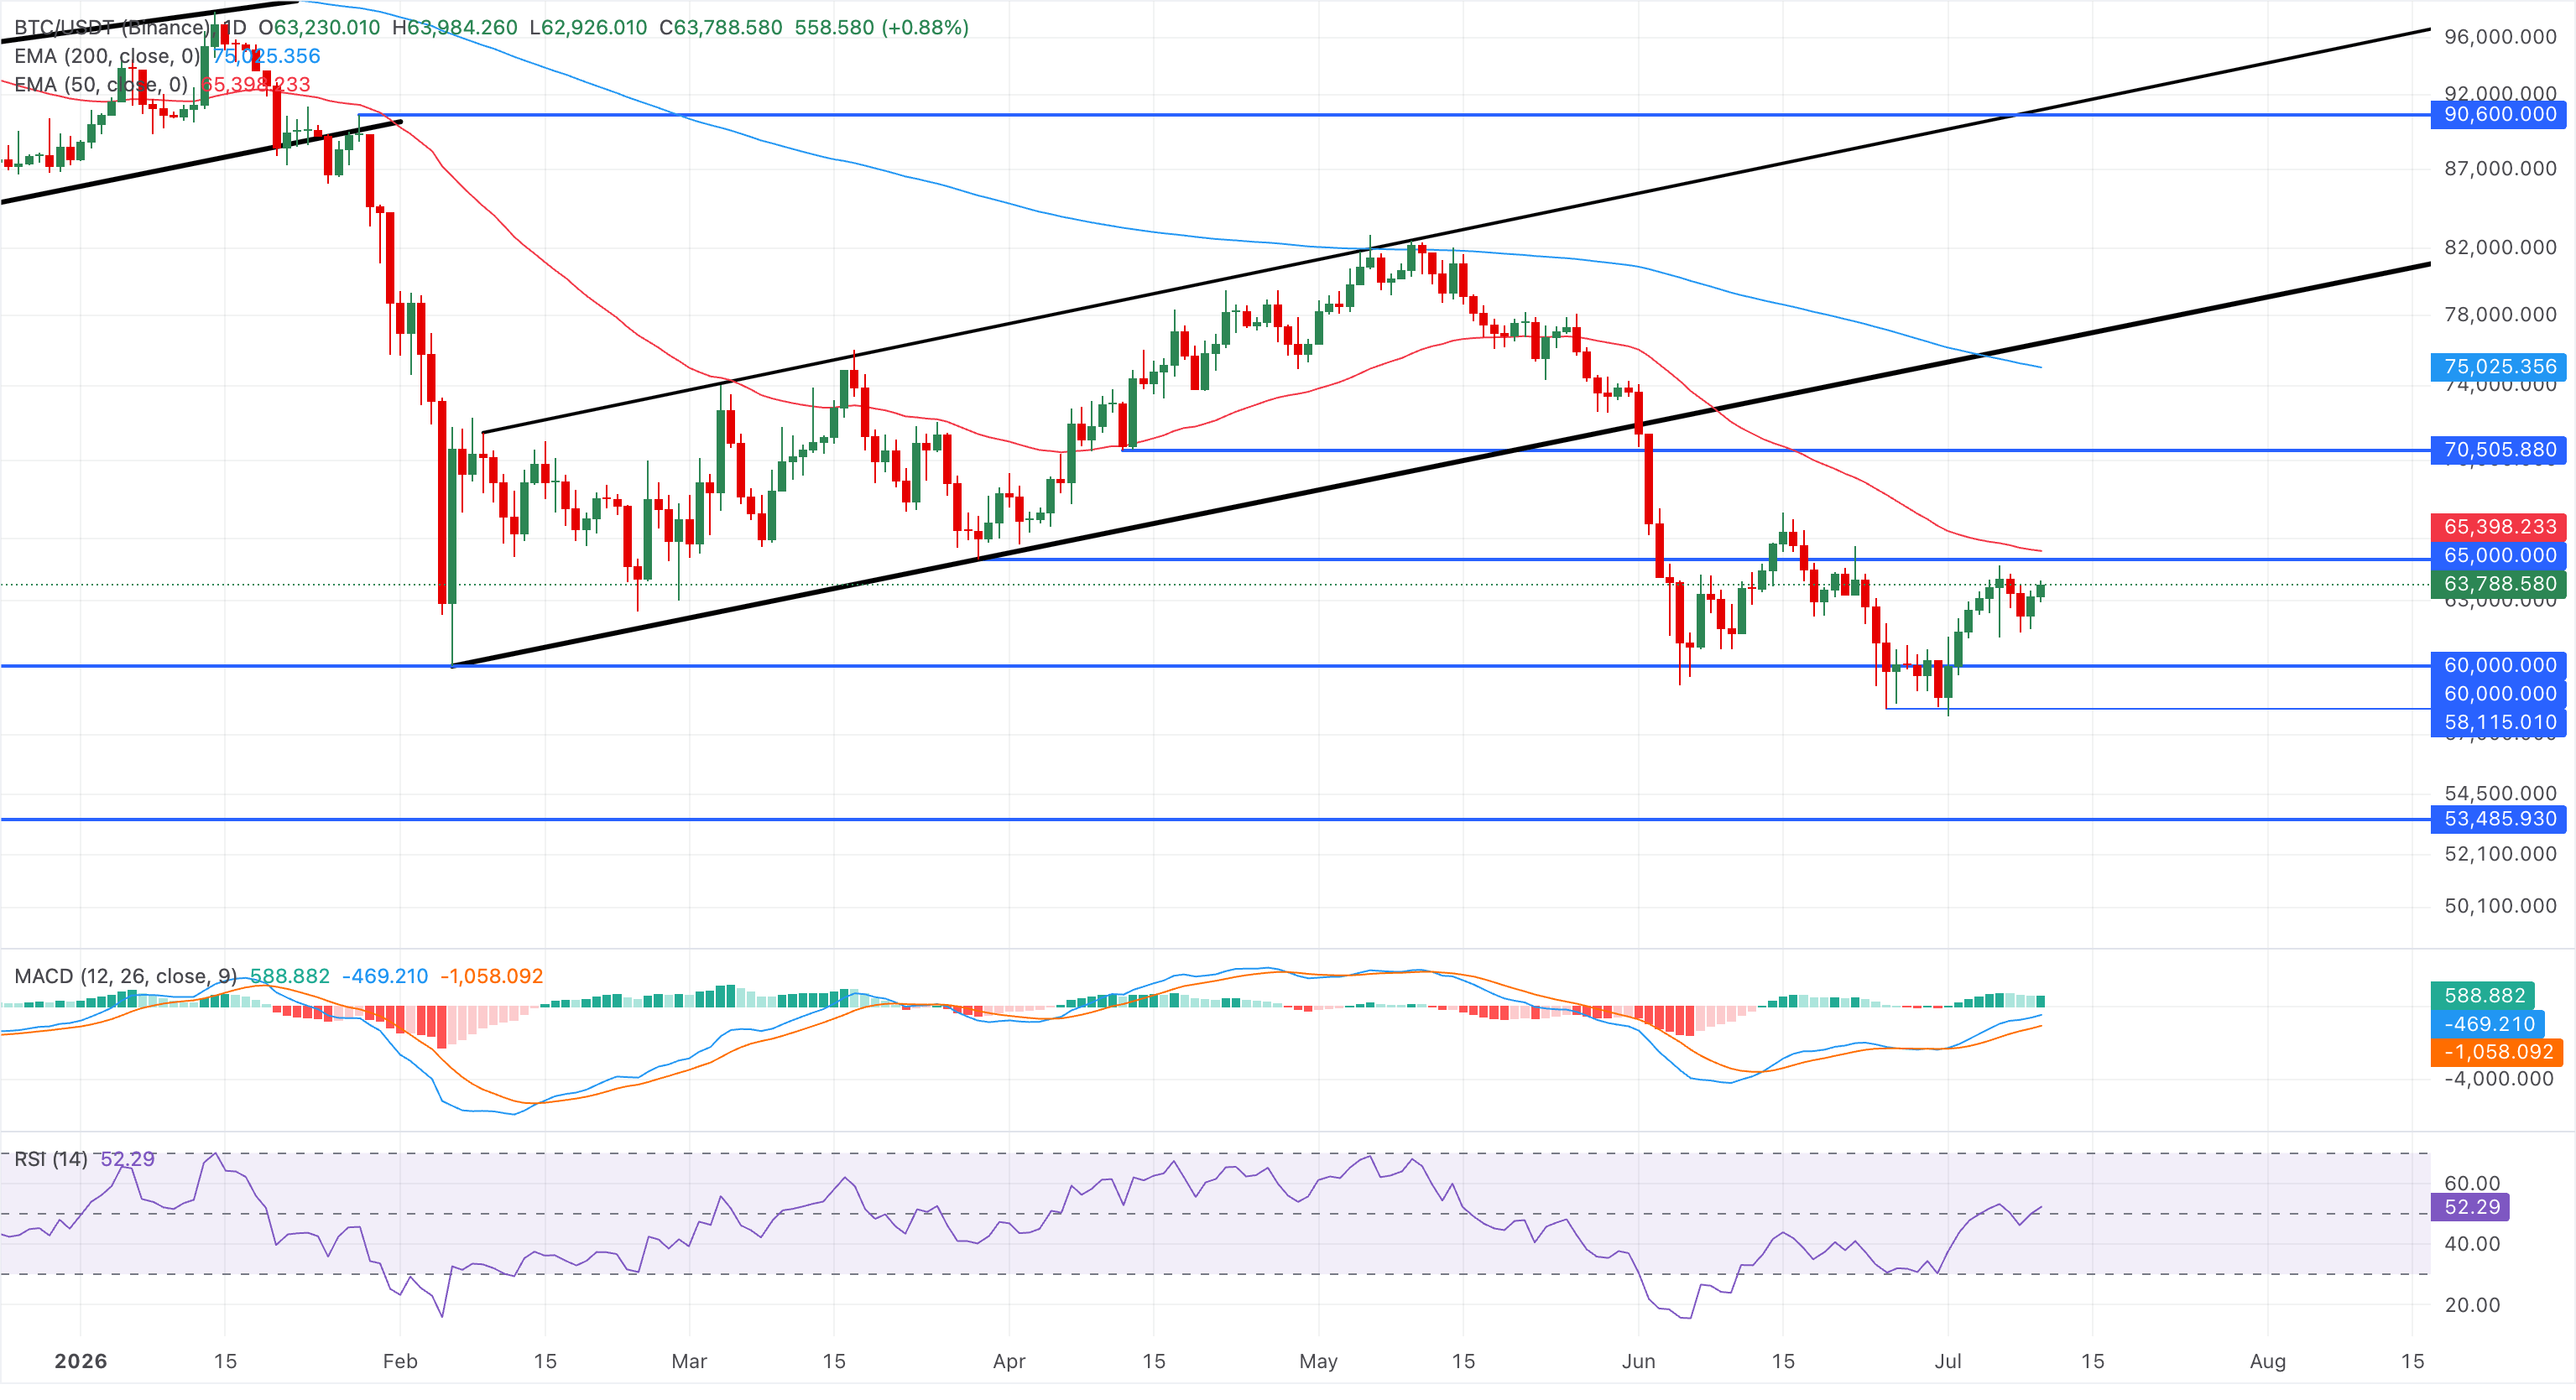
On the downside, key support is clustered around the $60,000 region, where a horizontal level aligns with an underlying trendline base; a decisive drop through this zone would reopen the path toward deeper corrective losses.
DeXe and Arbitrum eye breakout rally
DeXe is up over 20% on Friday, testing an ascending resistance trendline near $34.50. The token extends a strong bullish phase, trading well above the 50-day EMA near $20.71 and the 200-day EMA near $12.91. This wide separation between spot and the key EMAs suggests an entrenched uptrend.
That said, the RSI at 77 sits in overbought territory, hinting that upside momentum remains robust but increasingly stretched. Meanwhile, the MACD and signal line are rising into positive territory, with an expanding positive histogram, reinforcing the dominant upward bias despite the risk of a corrective pause.
A decisive close above the trendline could test the R3 and R4 Pivot levels at $40.52 and $48.04, respectively.
Initial support is seen at the 50-day EMA around $20.71, where any deeper pullback could test trend-following buyers’ appetite, before stronger structural demand emerges near the 200-day EMA at about $12.91.
Arbitrum is up 5% on Friday, extending the 13% gains from the previous day. ARB price trades above the 50-day EMA at roughly $0.0882, where a decisive close could confirm a bullish tilt while it still remains well below the 200-day EMA near $0.1479, keeping the broader trend capped.
Momentum is improving, with the RSI hovering around 62 and the MACD line holding in positive territory, which together suggest buyers are gaining control without reaching overbought conditions.
Looking up, the R1 and R2 Pivot levels at $0.0967 and $0.1174, respectively, emerge as key resistance levels.
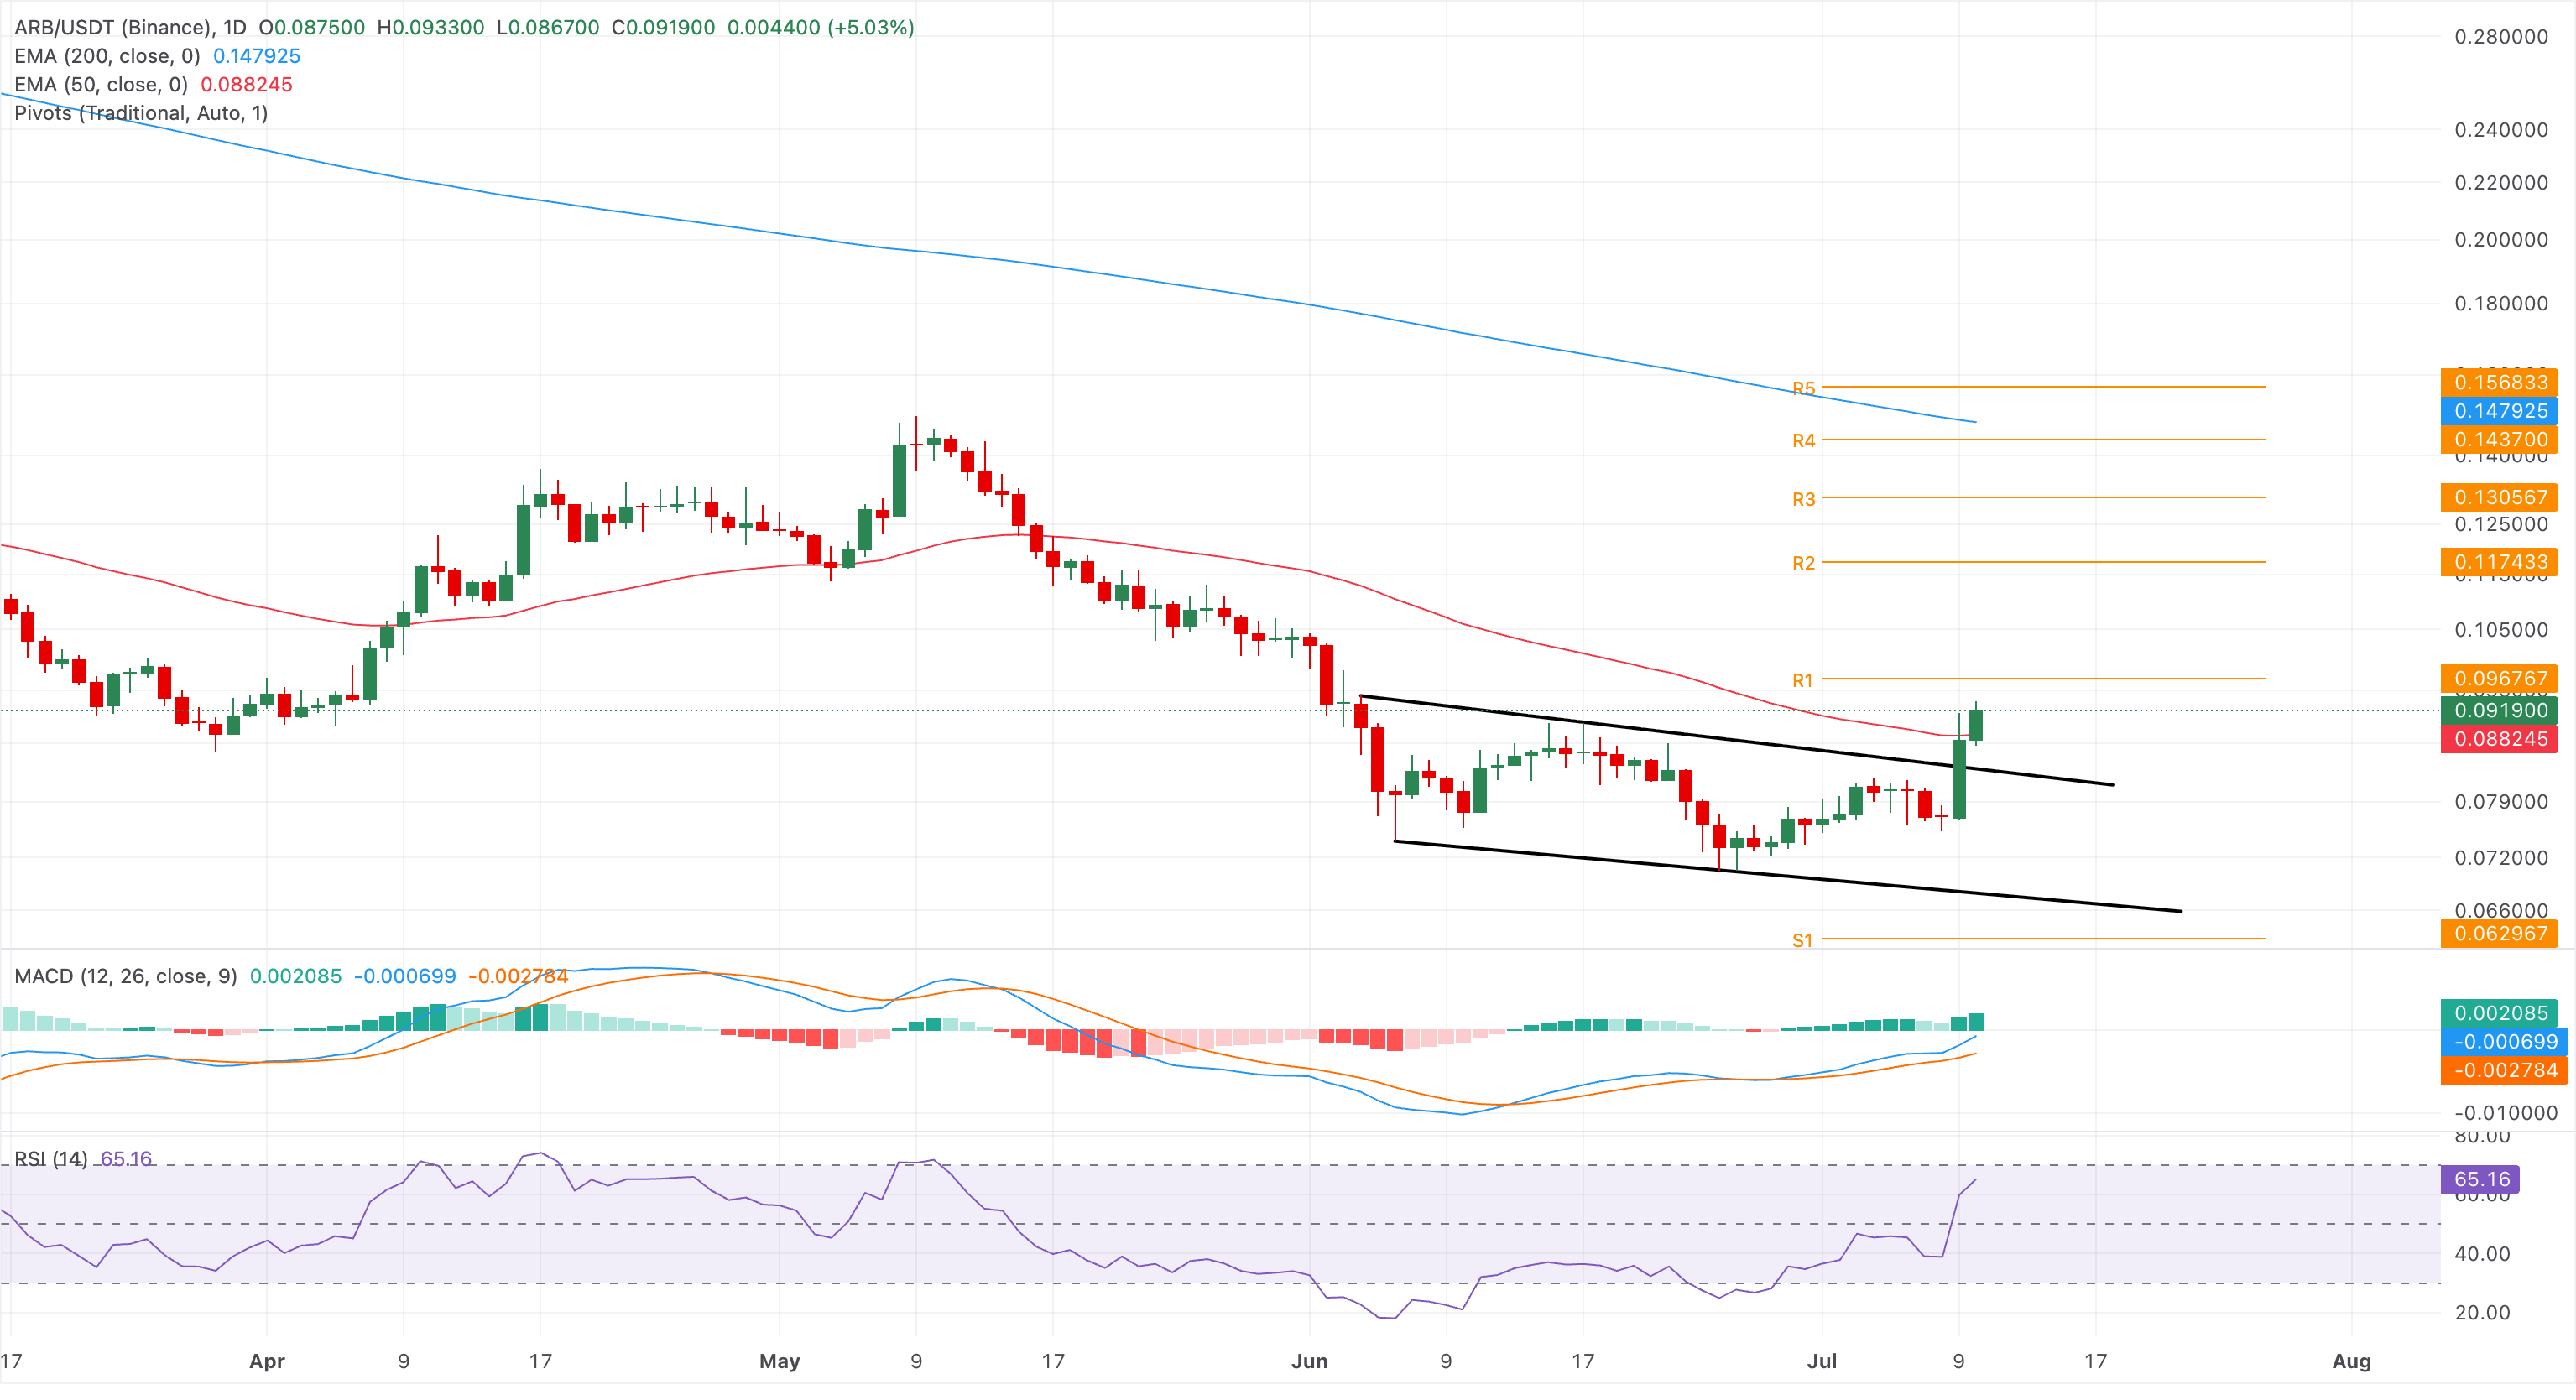
Looking down, immediate support is at the 50-day EMA at $0.0882, while a deeper pullback toward the prior breakout area at $0.0835 would need to hold to preserve the nascent bullish bias.
(The technical analysis of this story was written with the help of an AI tool. Know more.)














