
Crypto Market Overview: Bitcoin, Zcash and Bittensor rebound, but are these gains sustainable?
Por John Isige
Atualizado: 22 Jun 2026


ARTIGOS POPULARES

Bitcoin (BTC) upholds a subtle recovery outlook on Monday, trading above $64,000 as investors reengage amid easing geopolitical tensions, particularly in the Middle East. Altcoins are broadly rising, led by Zcash (ZEC) and Bittensor (TAO), indicating a positive short-term turnaround.
- Bitcoin rises and holds above $64,000 after the US and Iran have made progress in the first round of talks toward a lasting peace deal.
- Zcash rebounds by nearly 5%, trading above the 50-day EMA, but declining retail interest could weigh on the token's short-term outlook.
- Bittensor edges higher from support at $225 amid a broader bearish outlook defined by downtrending major moving averages.
Bitcoin (BTC) upholds a subtle recovery outlook on Monday, trading above $64,000 as investors reengage amid easing geopolitical tensions, particularly in the Middle East. Altcoins are broadly rising, led by Zcash (ZEC) and Bittensor (TAO), indicating a positive short-term turnaround.
Still, a broader scope reveals that the prevailing risk-off sentiment, as reflected in the derivatives market, may limit recovery potential.
US-Iran peace talks drive Bitcoin’s recovery
High-stakes talks between the United States (US) and Iran aimed at achieving a lasting peace agreement began over the weekend. Both nations reportedly agreed on a preliminary framework under which the US would grant a waiver to ease sanctions on Iranian Oil exports, a key prerequisite for advancing nuclear discussions.
The negotiations, which took place in Switzerland, brought together US Vice President JD Vance, Iranian officials and Qatari mediators. Vance downplayed the impact of recent Israeli strikes in Lebanon, emphasizing that negotiations are yielding tangible results toward de-escalation.
Despite mediators describing the talks as making “encouraging progress,” with both countries agreeing on a roadmap toward a final agreement within 60 days, US President Donald Trump said that “Iran must immediately stop their highly paid PROXIES in Lebanon from causing trouble,” or risk fresh attacks.
It is worth mentioning that Iranian negotiators unexpectedly paused the peace talks following a series of verbal threats from Trump.
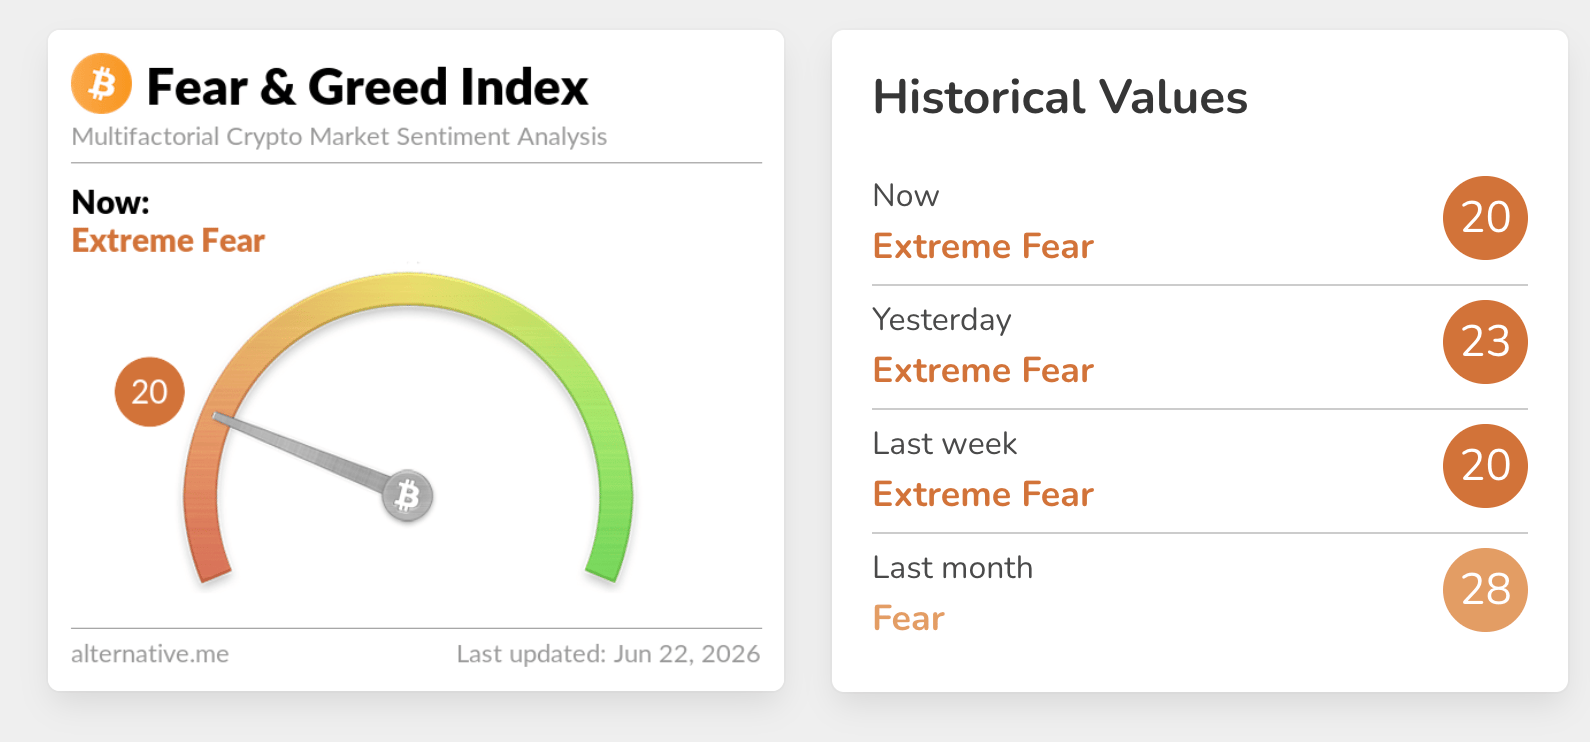
Despite Bitcoin’s subtle rebound, the crypto market remains on edge, weighed down by deteriorating sentiment. The crypto Fear & Greed Index, which holds at 20 in the Extreme Fear territory on Monday, down from 23 the day before, signals that risk-averse sentiment is an overhang.
Meanwhile, Bitcoin trades above the $64,000 short-term support, advancing from last week’s low at $62,272. The 50-day Exponential Moving Average (EMA) at roughly $69,093, the 100-day EMA near $72,120 and the 200-day EMA around $77,631 line up as a layered cap above the market, suggesting rallies are likely to face supply while the Relative Strength Index (RSI) hovers in the low-40s on the daily chart.
A positive Moving Average Convergence Divergence (MACD) histogram suggests downside momentum is not aggressive, but it does little to alter the overarching capped structure, while spot trades under these key trend averages.
On the topside, immediate resistance lies at the 50-day EMA around $69,093, with further barriers at the 100-day EMA near $72,120 and the 200-day EMA close to $77,631, forming a broad supply band that would need to be reclaimed to ease the current bearish tone.
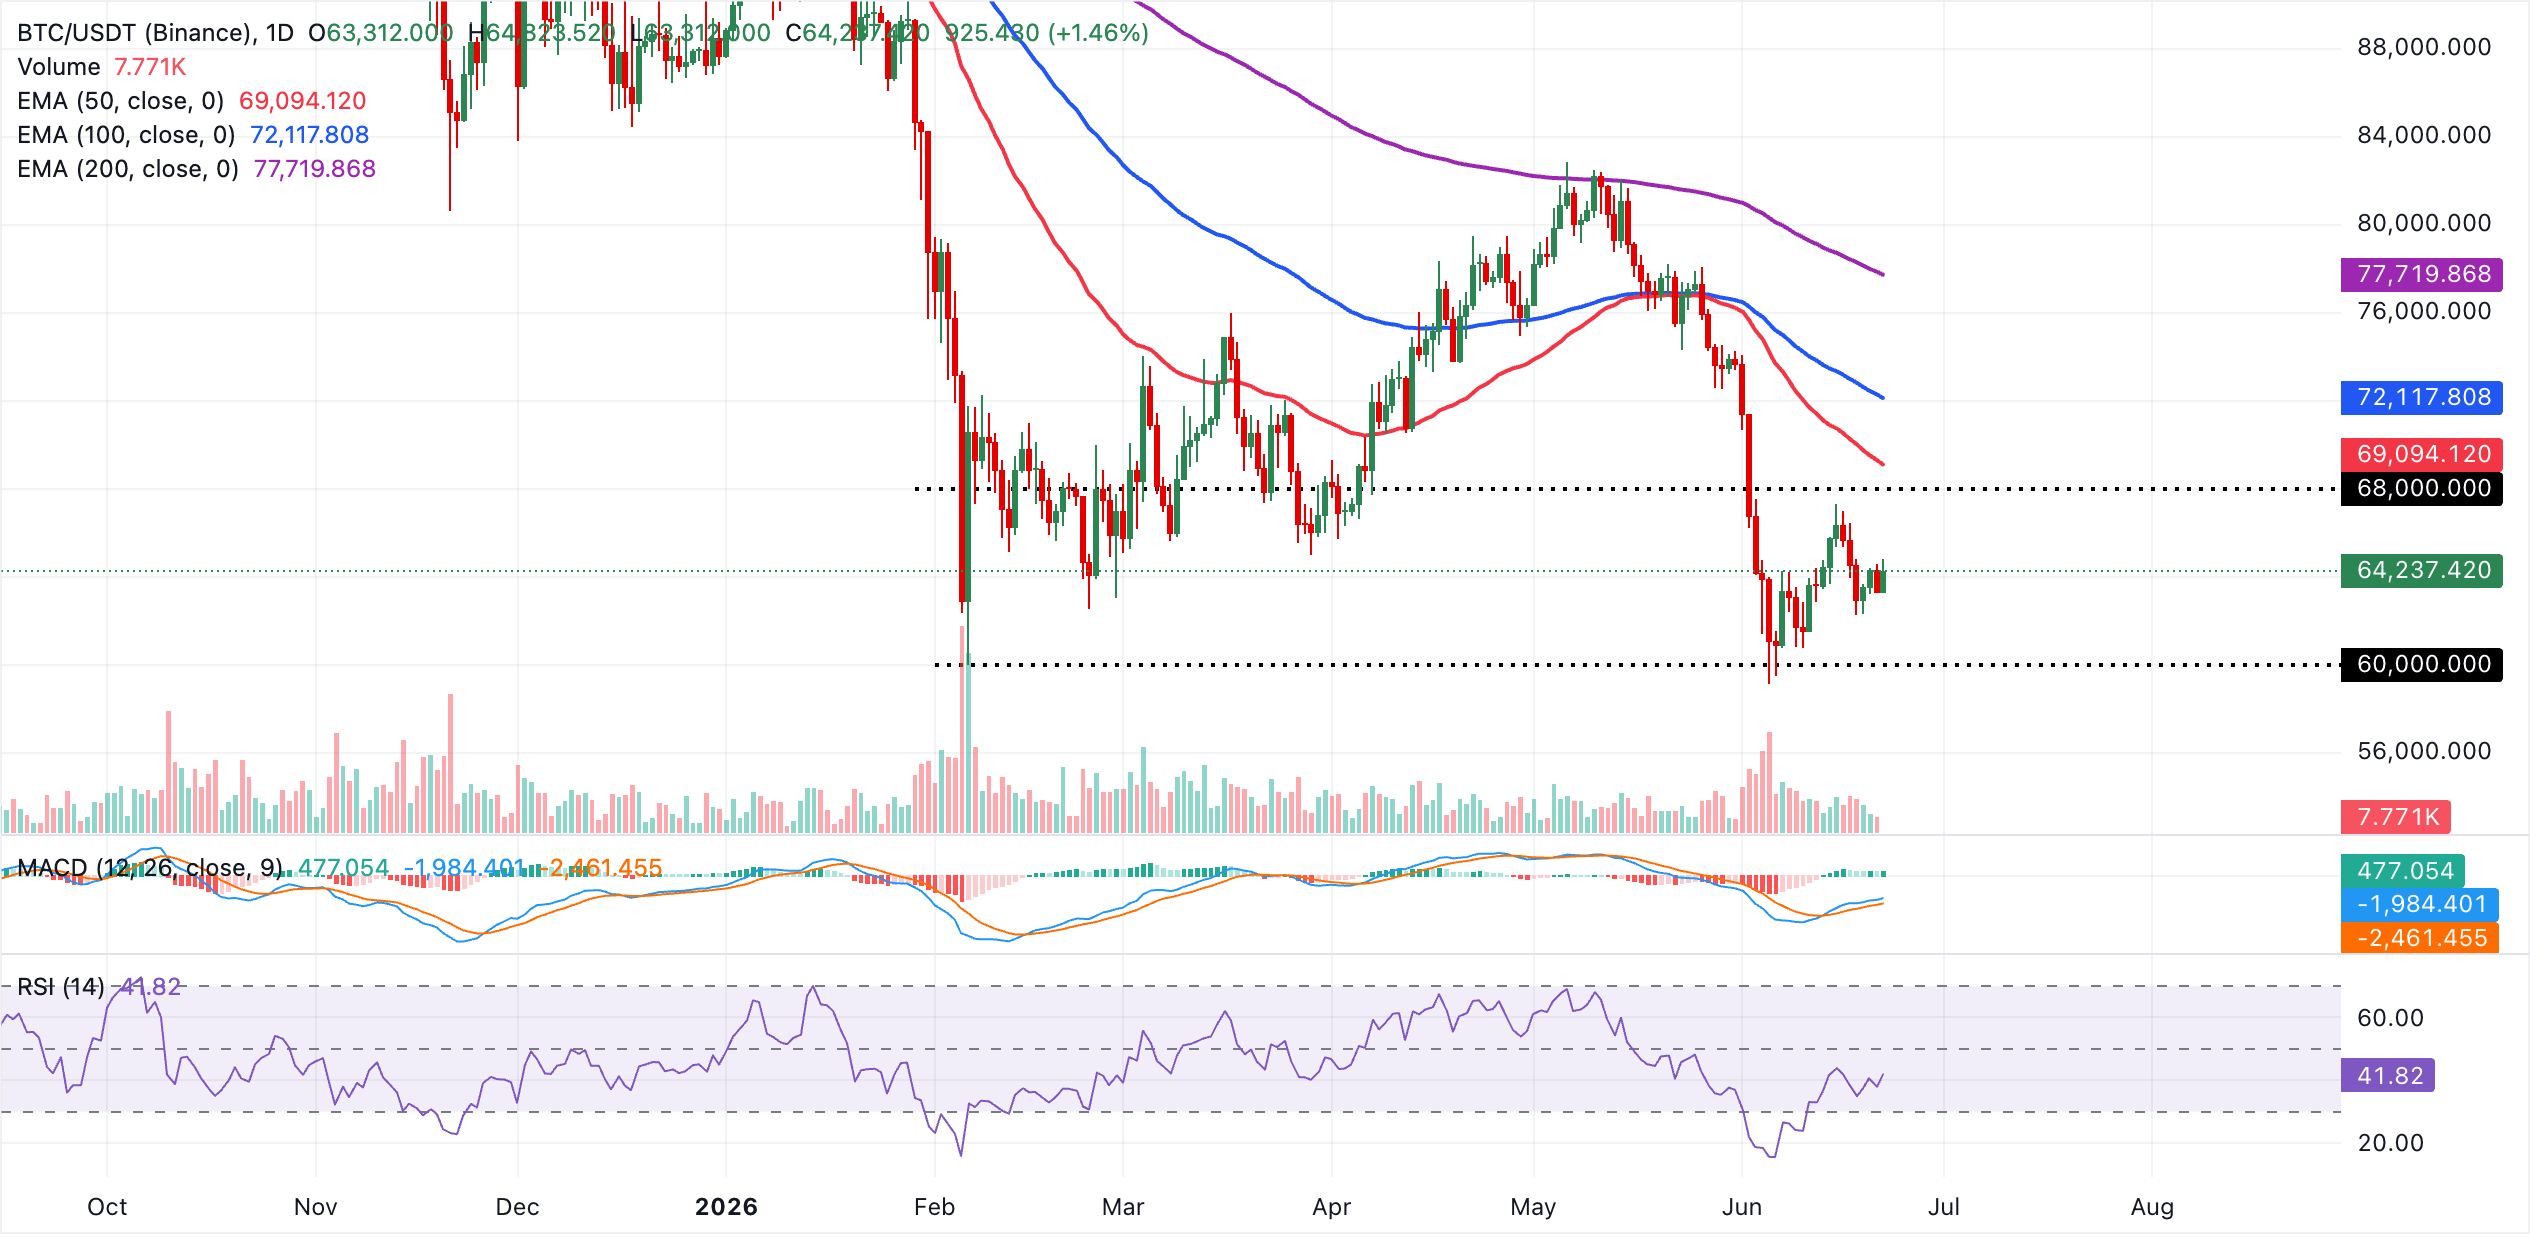
With no nearby structural supports highlighted by the available indicators, buyers would seek to reengage at key psychological areas, including last week's lows near $62,000 and $60,000.
Zcash and Bittensor rise amid subdued retail interest
Zcash advances above $450 as bulls build on the support established at around $436. Recovery appears to be gaining momentum, as reflected in the MACD histogram remaining positive on the daily chart and the RSI approaching the midline.
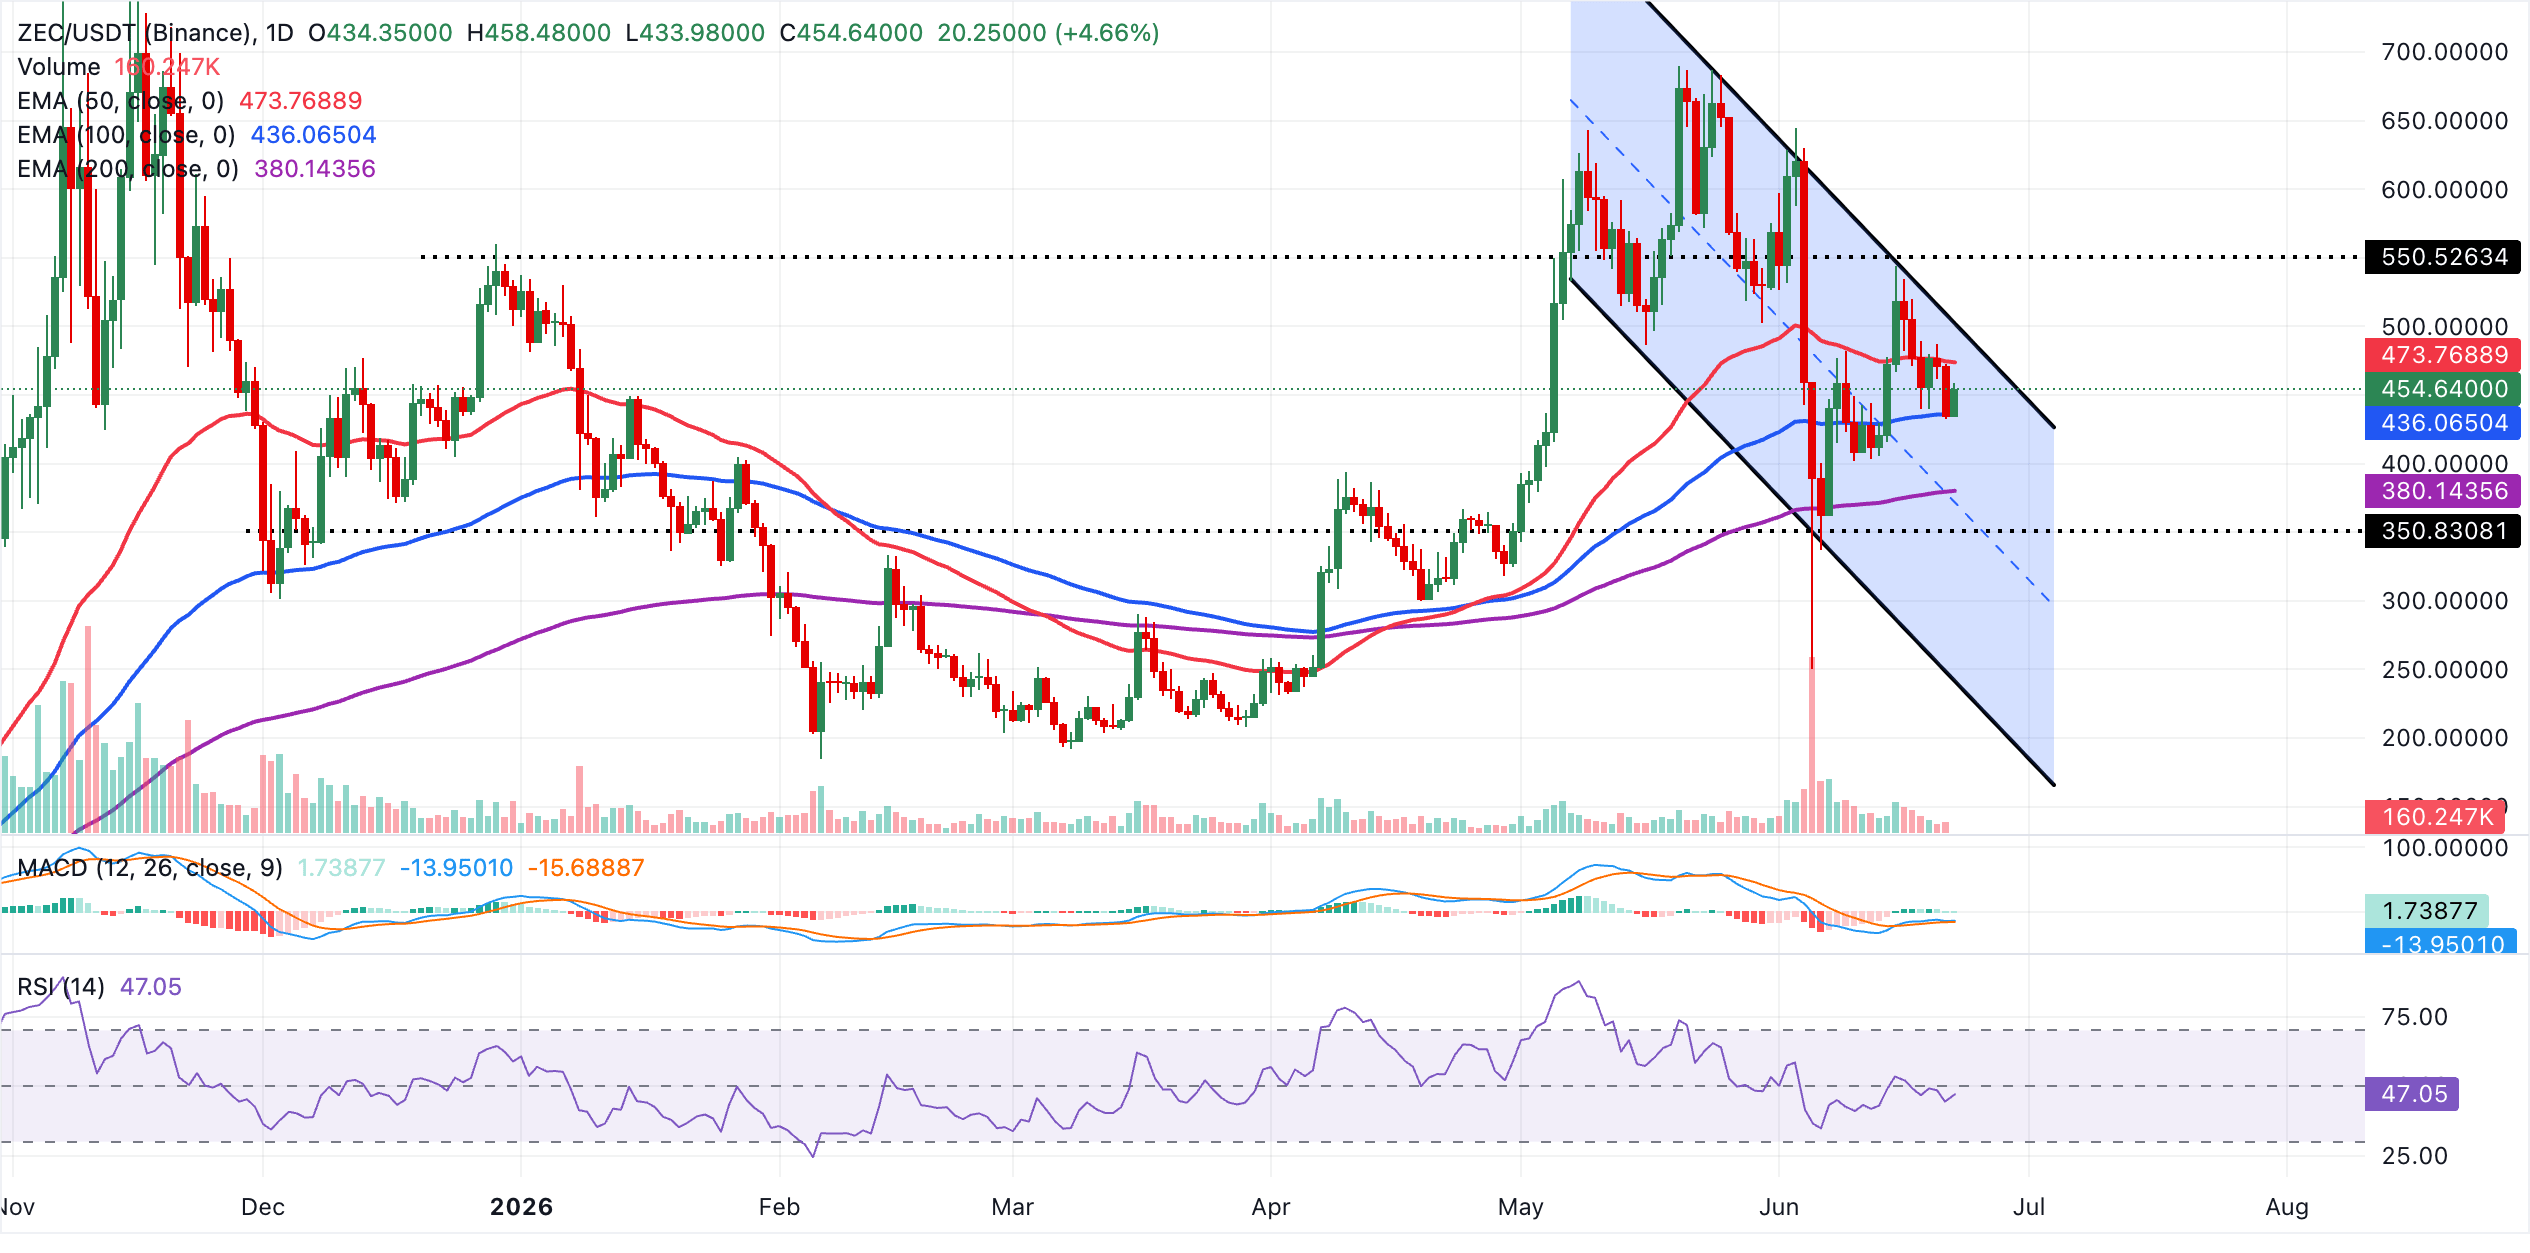
On the topside, immediate resistance emerges at the 50-day EMA around $474, with the upper boundary of the downward parallel channel near $500 acting as the next hurdle if buyers manage a breakout. Looking down, initial support is aligned with the 100-day EMA at roughly $436, ahead of the more strategic 200-day EMA near $380. A sustained break below that zone would expose the channel’s lower boundary around $239 as the next significant demand region.
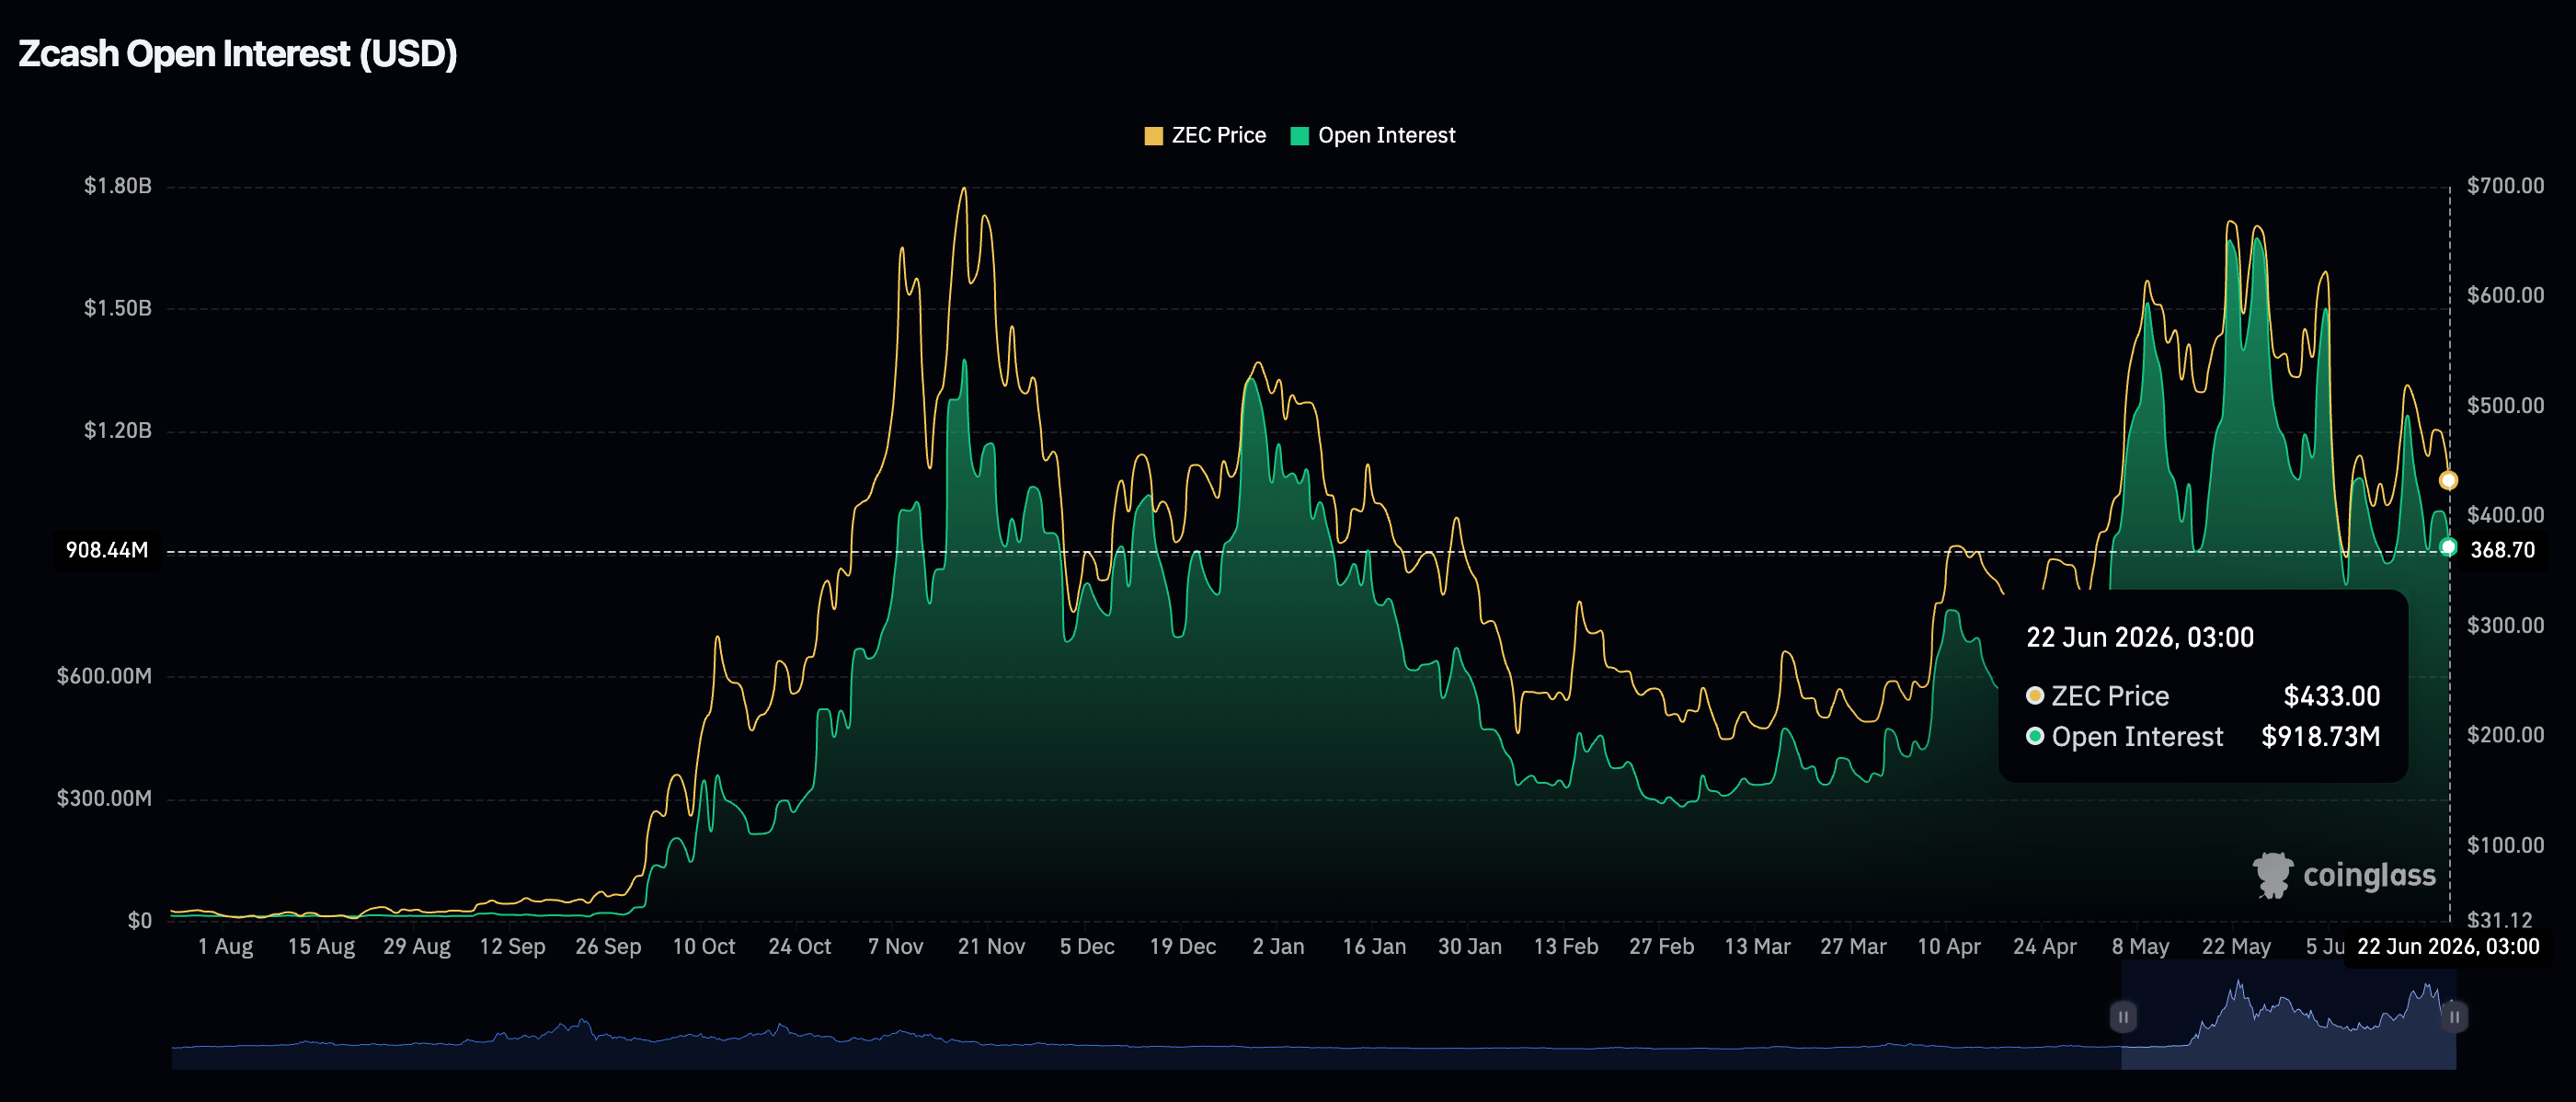
Subdued retail demand for Zcash derivatives remains a major overhang, especially with futures Open Interest (OI) falling to $919 million on Monday, down from slightly above $1 billion the previous day. The current OI pales in comparison to $1.67 billion, recorded in late May.
Bittensor trades at $232, keeping a bearish near-term bias as the spot price holds below key EMAs despite improving momentum signals. The pair has rebounded from recent lows, but the MACD histogram remains only modestly positive and the RSI hovers just below the midline, which together suggest a corrective bounce within a broader capped structure rather than a confirmed trend reversal.
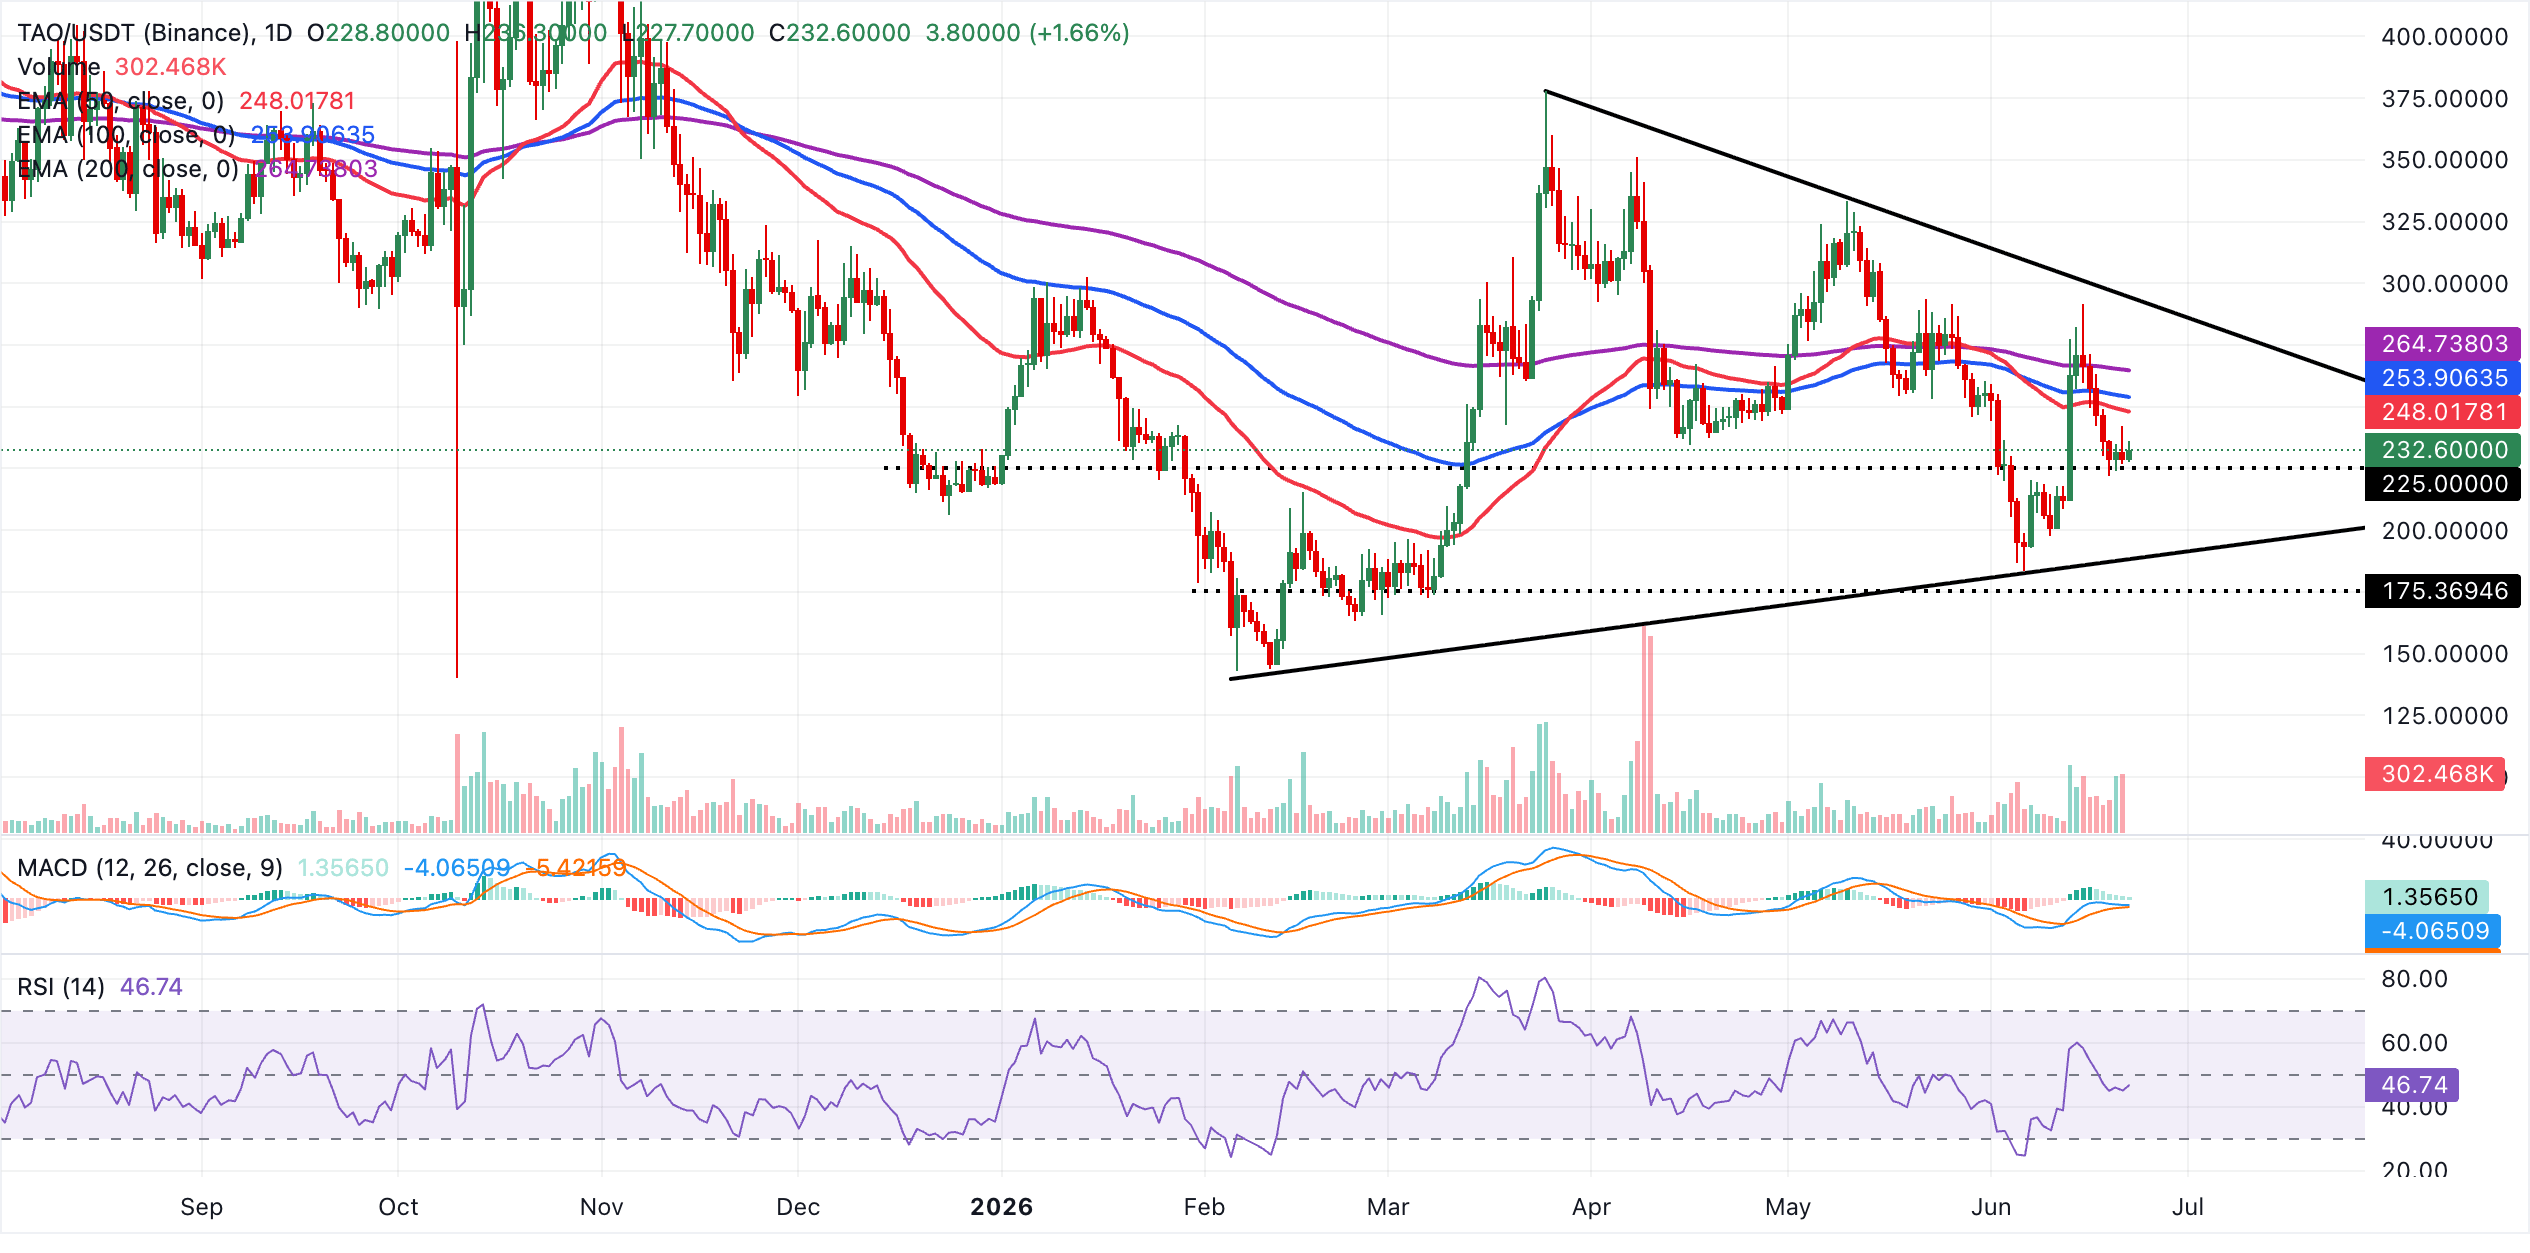
On the topside, initial resistance lies at the downtrend resistance trendline break region around $294, where a daily close above would be needed to ease the current bearish tone. Conversely, the broader structure finds layered support from the 200-day EMA near $265, the 100-day EMA around $254 and the 50-day EMA close to $248, with more distant structural backing from the prior uptrend support break area near $188 if selling pressure resumes and the current recovery falters.
Bittensor's derivatives market reflects weak retail demand, with futures OI moderating downward at $239 million on Monday, from $250 the previous day. A persistent sell-off would weigh on TAO's structural outlook, which remains weak despite the minor rebound above $232.
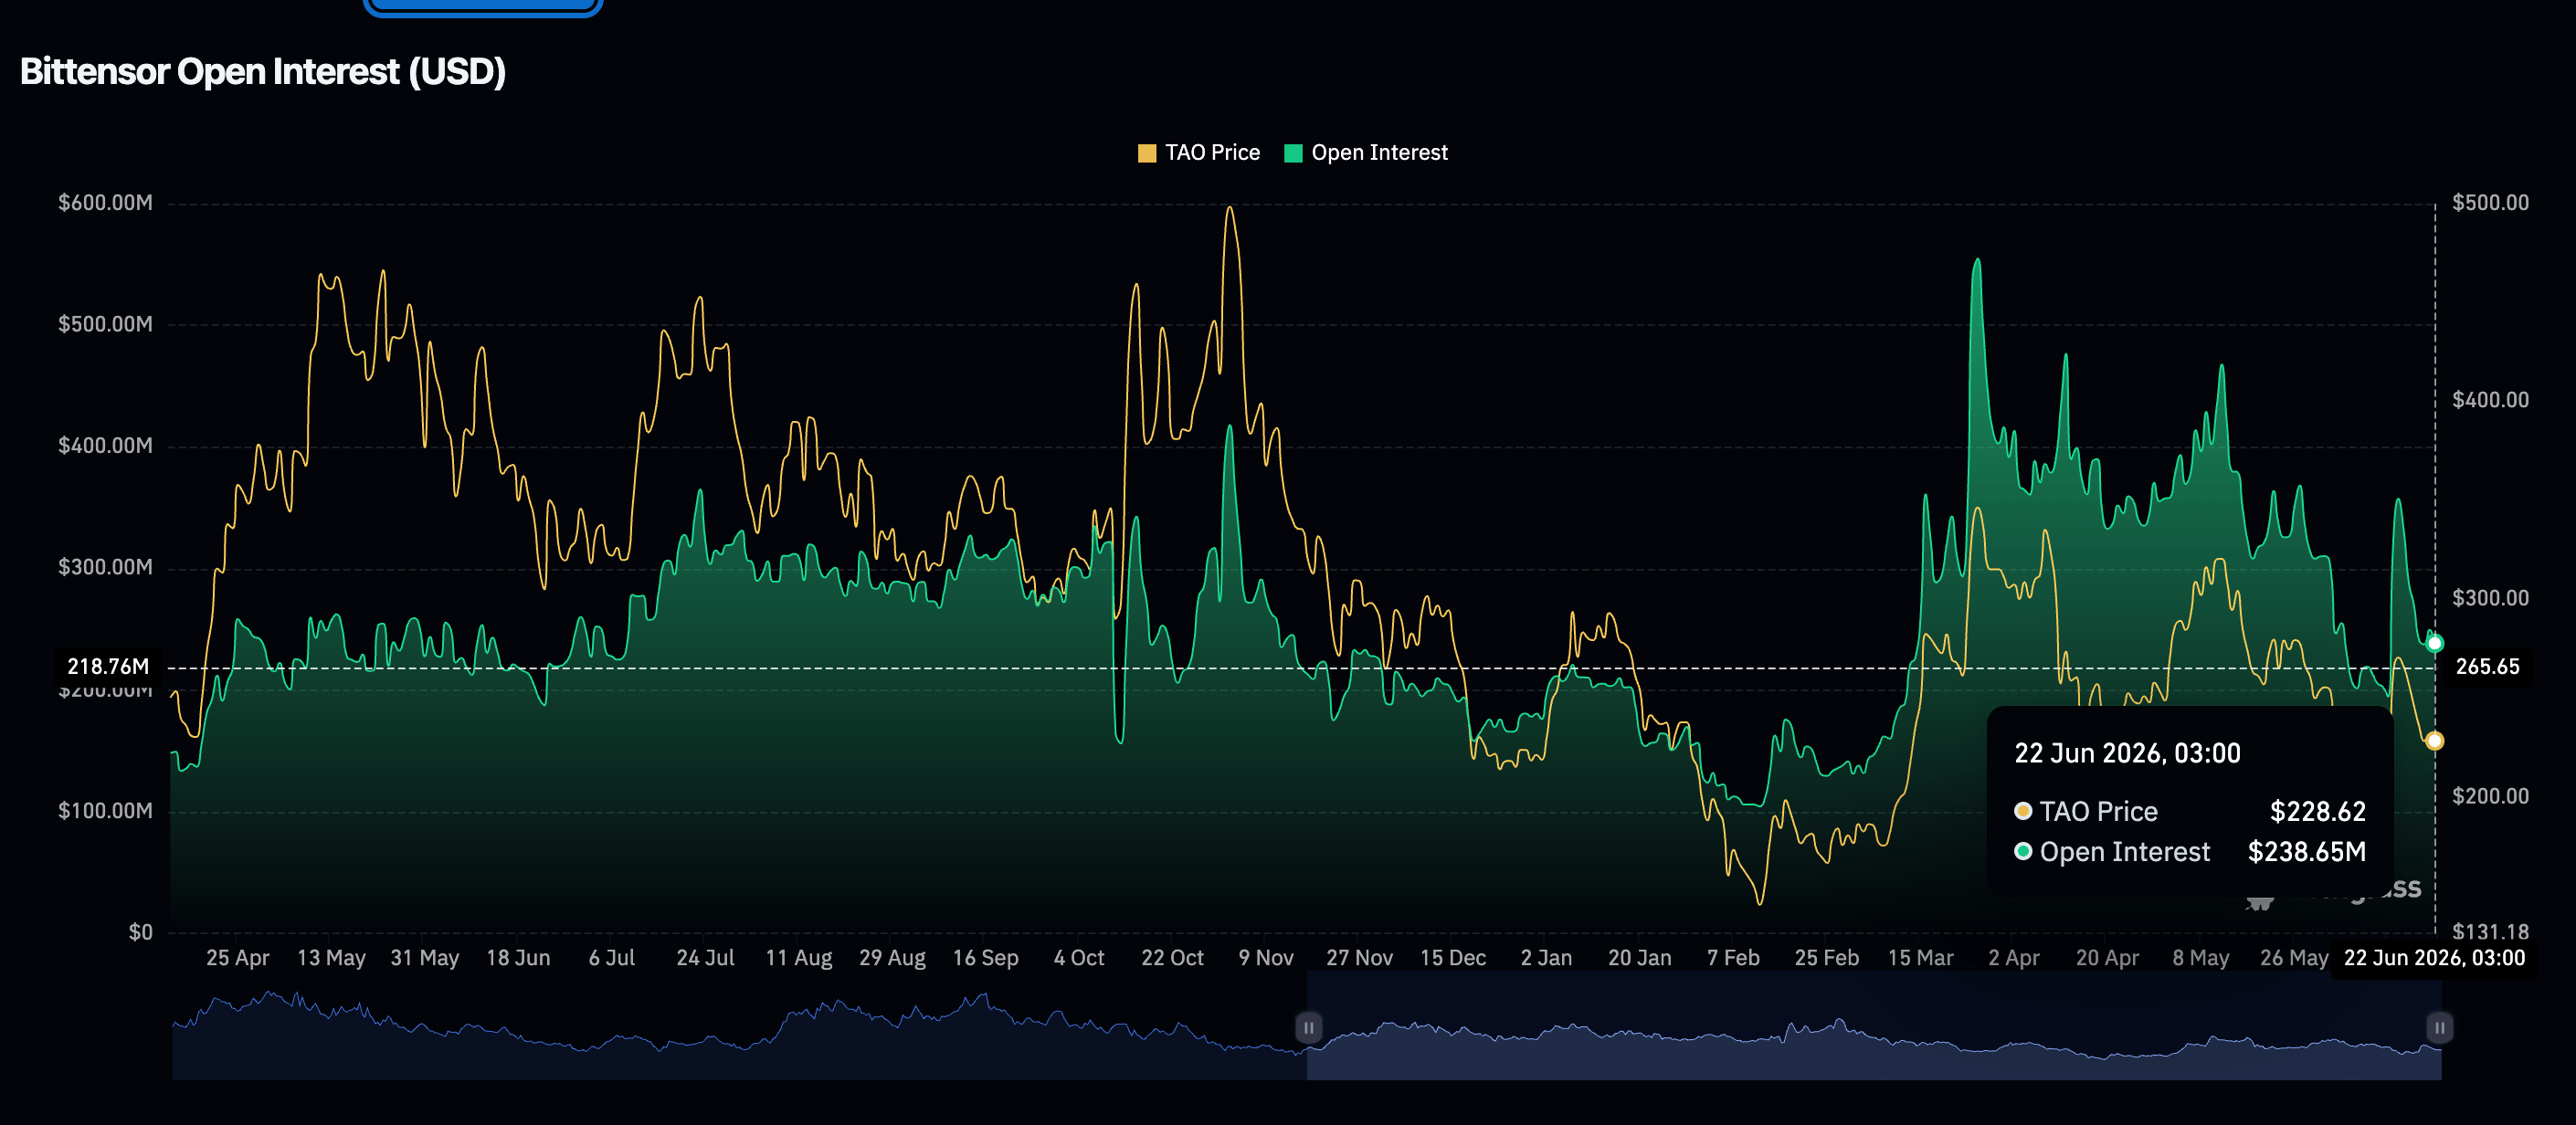
For now, holding support at $225 is critical for a sustained short-term recovery. However, it does not remove the overarching risk of a continued sell-off toward the demand regions at $200 and $188.
(The technical analysis of this story was written with the help of an AI tool.)
Open Interest, funding rate FAQs
Higher Open Interest is associated with higher liquidity and new capital inflow to the market. This is considered the equivalent of increase in efficiency and the ongoing trend continues. When Open Interest decreases, it is considered a sign of liquidation in the market, investors are leaving and the overall demand for an asset is on a decline, fueling a bearish sentiment among investors.
Funding fees bridge the difference between spot prices and prices of futures contracts of an asset by increasing liquidation risks faced by traders. A consistently high and positive funding rate implies there is a bullish sentiment among market participants and there is an expectation of a price hike. A consistently negative funding rate for an asset implies a bearish sentiment, indicating that traders expect the cryptocurrency’s price to fall and a bearish trend reversal is likely to occur.

Mais de um milhão de usuários confiam na FXStreet para dados de mercado em tempo real, ferramentas de gráficos, insights de especialistas e notícias de Forex. Seu calendário econômico abrangente e webinars educacionais ajudam os traders a se manterem informados e tomarem decisões calculadas. A FXStreet conta com uma equipe de cerca de 60 profissionais, divididos entre a sede em Barcelona e diversas regiões globais.
Ler mais


