
Crypto Overview: Bitcoin stabilizes above $65,000, as Zcash and Worldcoin lead broader recovery
Por John Isige
Atualizado: 15 Jun 2026


ARTIGOS POPULARES

Bitcoin (BTC) shows signs of recovery, trading above $65,000 on Monday, as the broader crypto market rebounds, fueled by improving sentiment following the United States (US) and Iran's confirmation of a preliminary peace agreement.
- Bitcoin consolidates above $65,000, driven by enhanced sentiment after the US and Iran confirmed preliminary peace deal.
- Zcash rises for a third consecutive day, nearing $500, supported by rising momentum indicators.
- Worldcoin gains momentum near $0.60, supported by a MACD buy signal and building on the 200-day EMA key demand zone.
Bitcoin (BTC) shows signs of recovery, trading above $65,000 on Monday, as the broader crypto market rebounds, fueled by improving sentiment following the United States (US) and Iran's confirmation of a preliminary peace agreement.
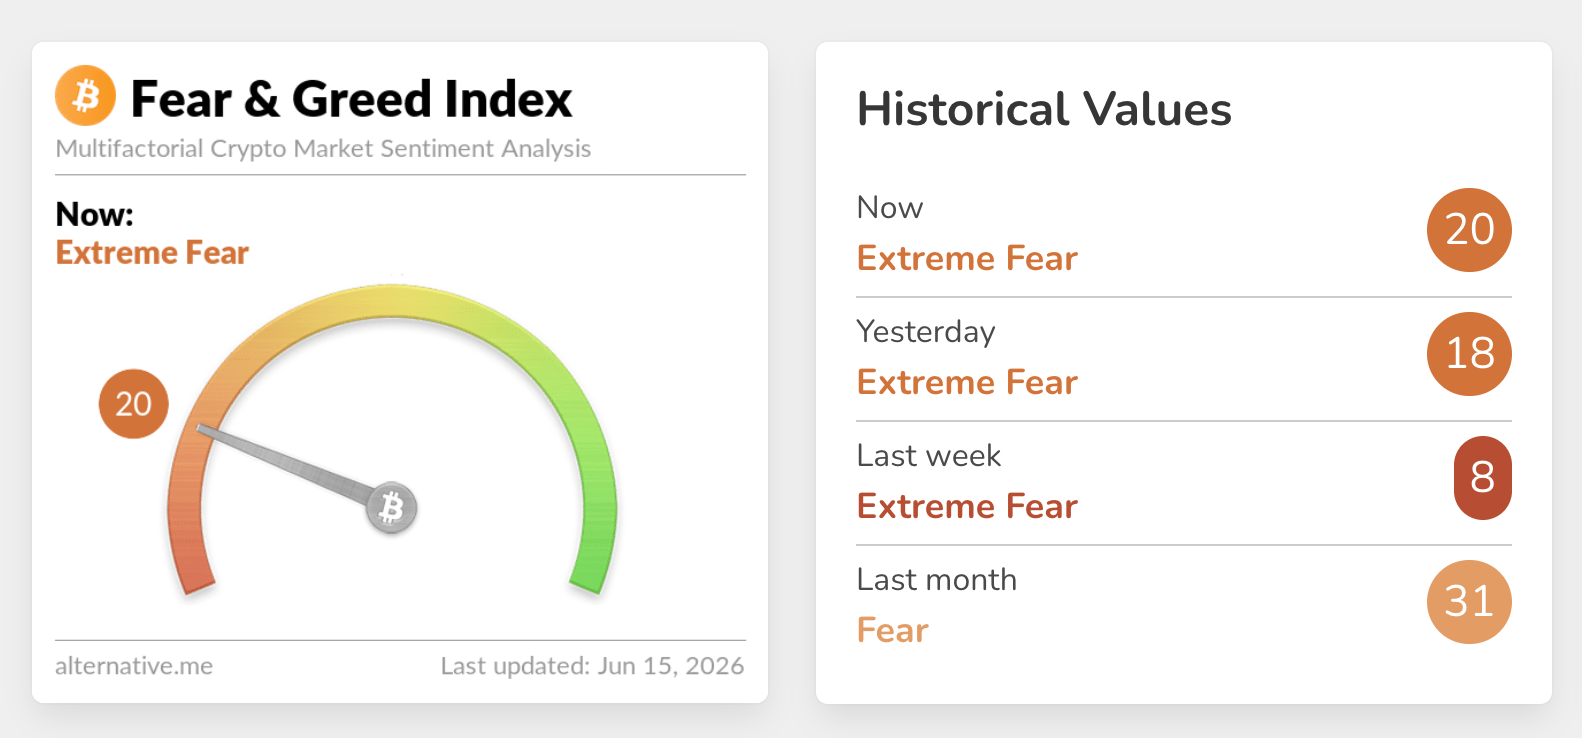
Zcash (ZEC) leads recovery among the top 100 tokens, trading near $500. Worldcoin (WLD) mirrors growth in investor appetite for risk assets, with the crypto Fear & Greed Index climbing to 20 on Monday, up from 18 the day before and 8 the previous week.
Bitcoin gains momentum amid easing geopolitical tensions
The US and Iran have said they have reached an agreement expected to take effect on Friday. According to CNN, US President Donald Trump stated that as part of the agreement, the naval blockade on Iranian ports will be lifted and the Strait of Hormuz reopened, removing the chokehold on global Oil and Gas supplies. However, the full text of the peace deal has not yet been released.
The CNN report said that the ceasefire agreement reached in early April will be extended for 60 days, in both time and scope, to allow the US and Iran to continue nuclear talks.
Meanwhile, Iran’s National Security Council announced that the US naval blockade is set to be lifted immediately and hostilities are expected to cease on all fronts, including Lebanon. However, the Lebanese National News Agency (NNA) reported continued Israeli strikes across various areas in southern Lebanon, even after the agreement was made public.
Investors appear to have welcomed the preliminary peace agreement, as sentiment broadly lifts across the crypto market. Bitcoin has climbed to to near $66,000 and shows potential to extend gains toward $70,000. However, the general outlook maintains a bearish near-term tone as the spot price sits beneath the Bollinger indicator's middle band around $66,502 and well under the 50-day, 100-day and 200-day Exponential Moving Averages (EMAs) clustered from roughly $70,700 to $78,800.
At the same time, momentum remains mixed, with the Moving Average Convergence Divergence (MACD) histogram turning positive on the daily chart while the Relative Strength Index (RSI) holds near 42. That said, the recent bounce lacks strong directional conviction as long as price stays capped by these overhead trend filters.
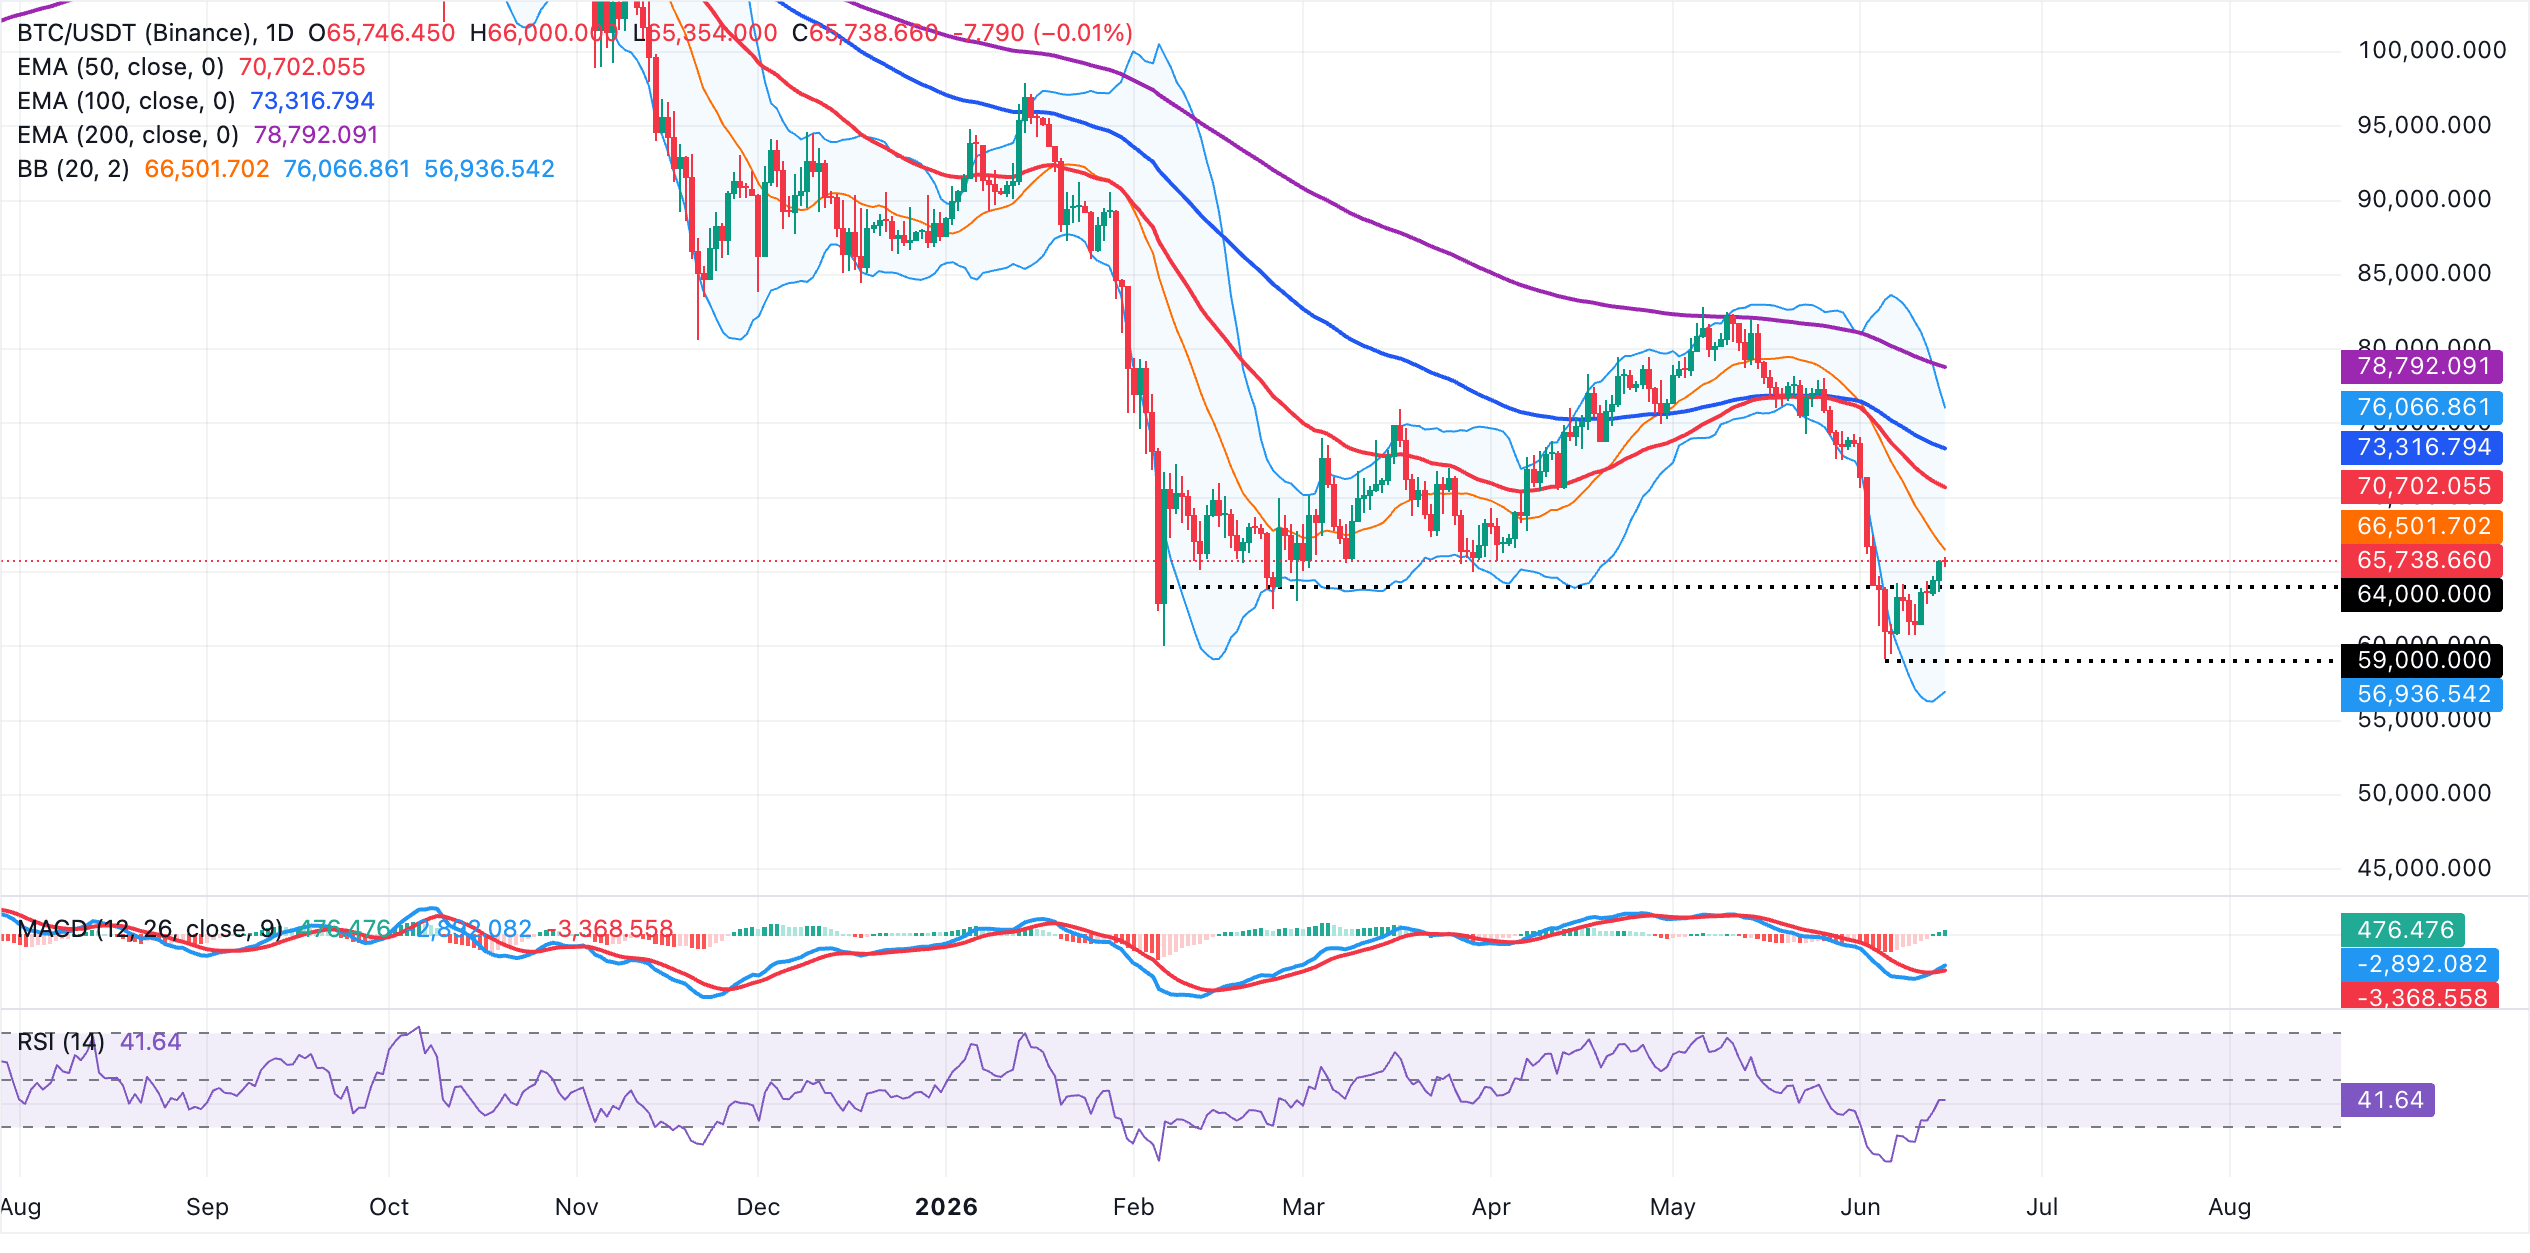
Looking up, initial resistance emerges at the Bollinger middle band near $66,500, followed by the 50-day EMA around $70,700 and the 100-day EMA close to $73,300. On the downside, firmer support is only visible at the lower Bollinger band, which lies around $56,900, where a deeper correction could look for demand if the current rebound fades.
Zcash and Worldcoin rally as bulls tighten grip
Zcash grinds higher toward the $500 short-term resistance, holding a constructive near-term bias as it stays above the 50-day, 100-day, and 200-day EMAs clustered between roughly $475 and $374. This stacked EMA configuration suggests the broader uptrend remains intact, even as momentum cools, with the RSI hovering just above the neutral 50 line on the daily chart and the MACD histogram still marginally negative, hinting at a modest loss of upside pressure.
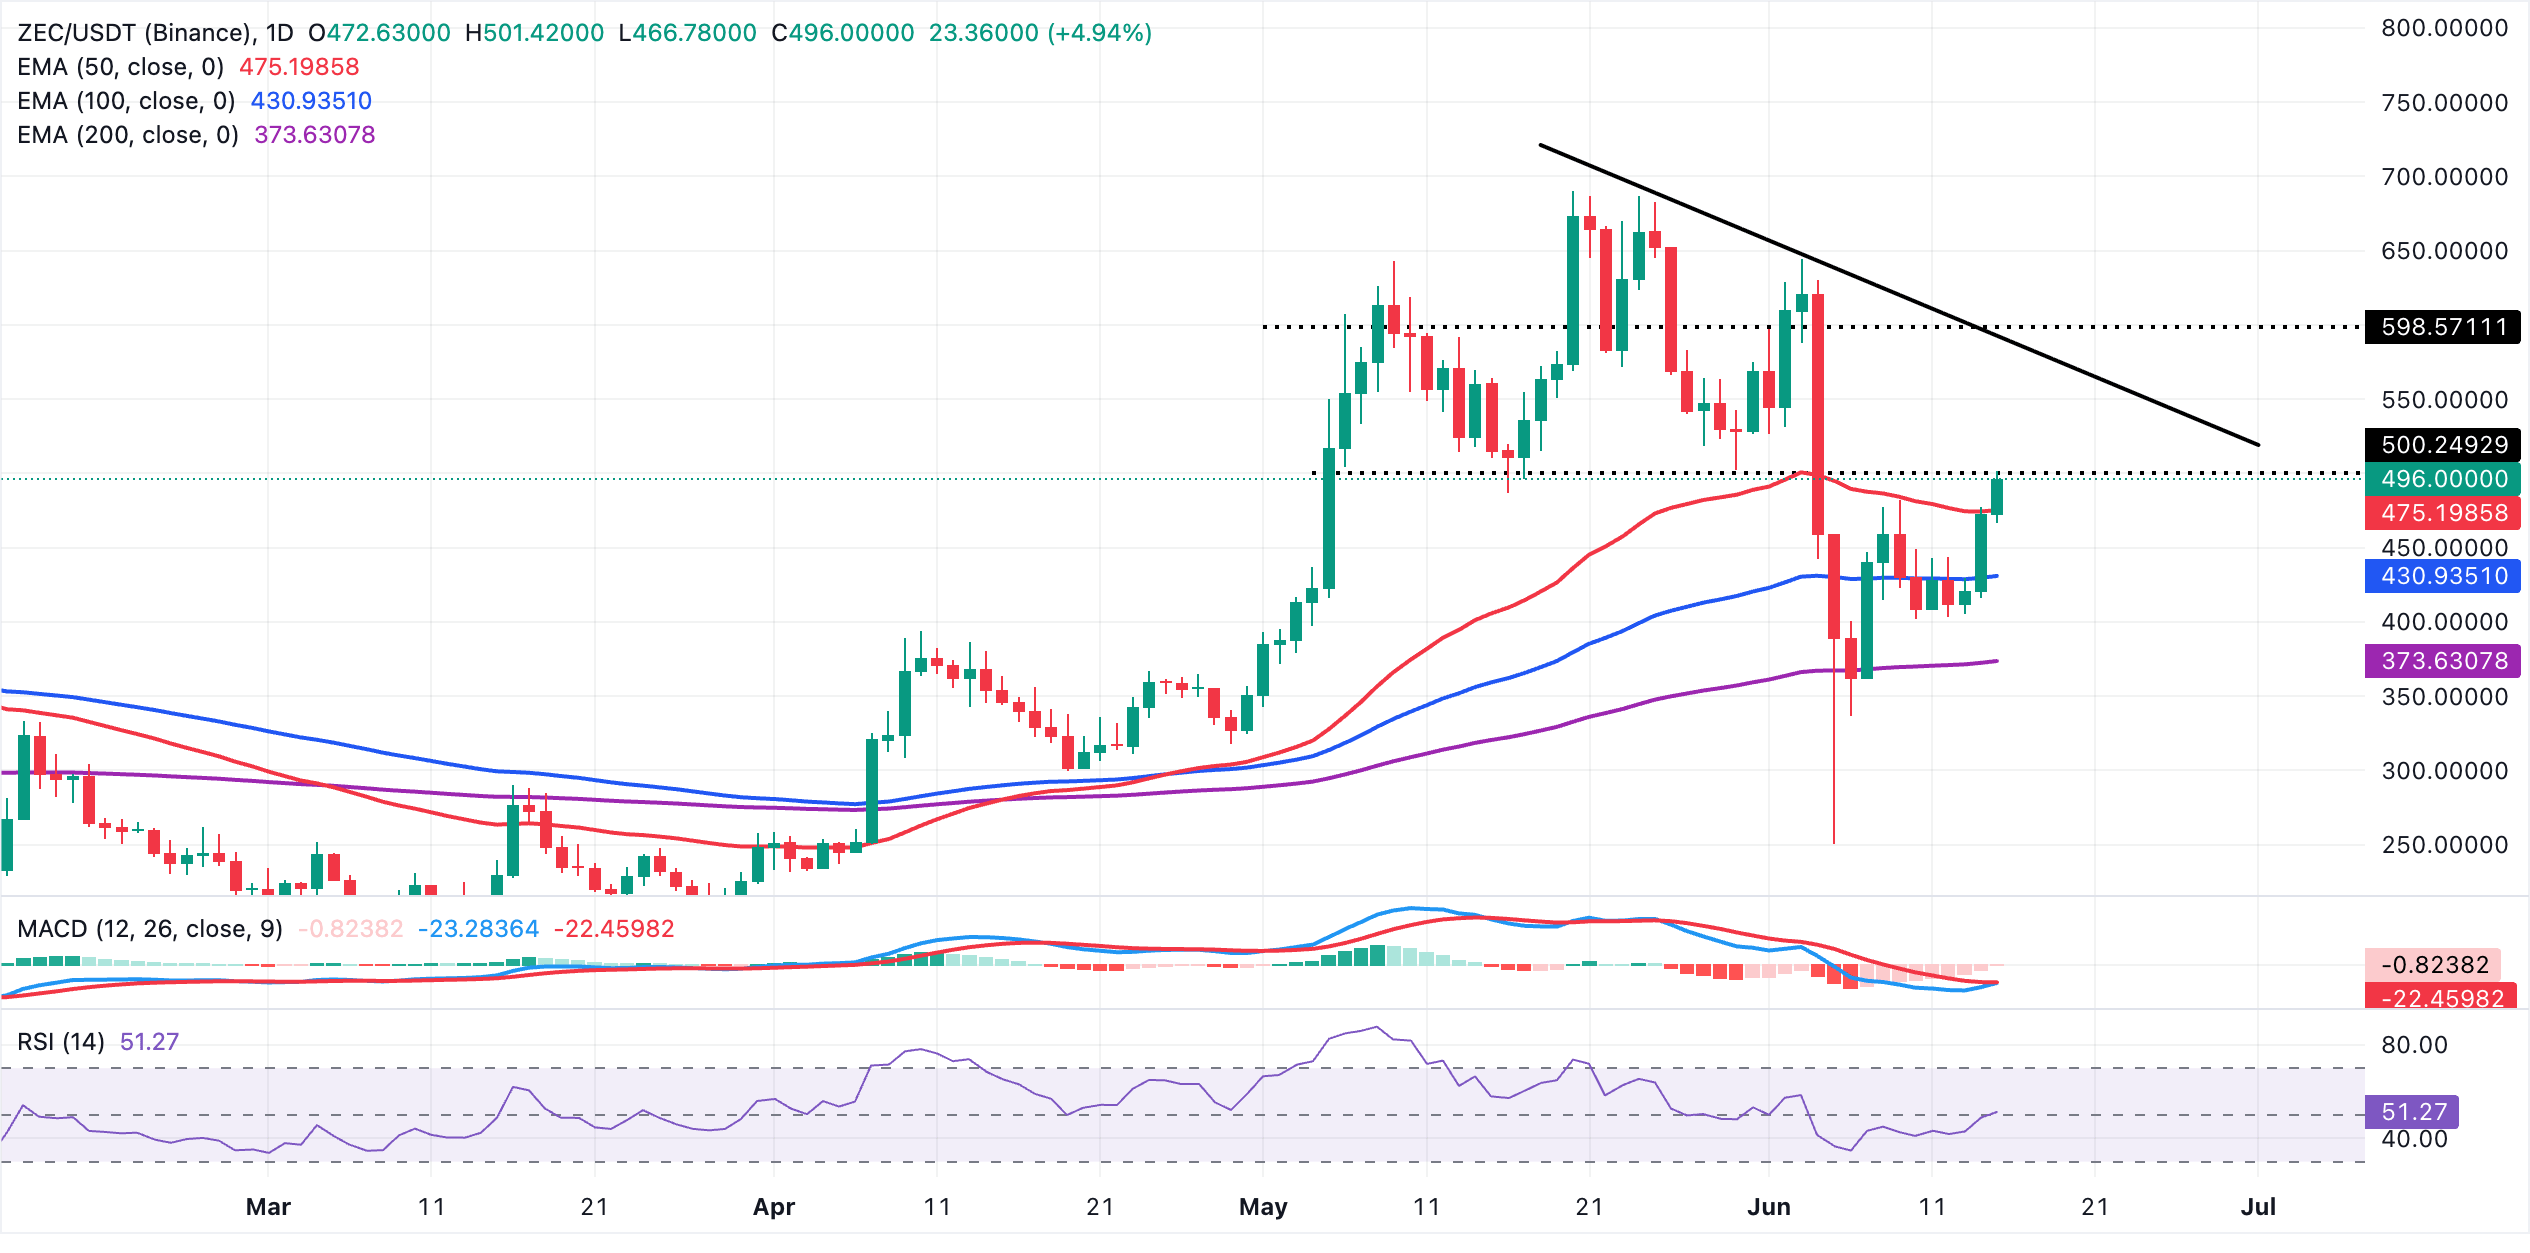
On the topside, the next key hurdle emerges at the downward resistance trendline break region near $590, where sellers could attempt to reassert control.
On the flip side, initial support lies at the 50-day EMA around $475, followed by the 100-day EMA near $431 and then the 200-day EMA close to $374, levels that collectively define a broad demand band that would need to give way to undermine the prevailing bullish structure.
Worldcoin is exchanging hands near $0.60, extending its recovery above the moving average. Its spot price holds well over the 50-day EMA around $0.38, the 100-day EMA near $0.37 and the 200-day EMA close to $0.45, suggesting a maturing bullish phase as long as these dynamic supports remain intact.
Meanwhile, momentum aligns with this structure, with the RSI hovering in the mid-60s on he daily chart and the MACD histogram staying in positive territory, hinting that buyers still control the tape despite the recent vertical advance.
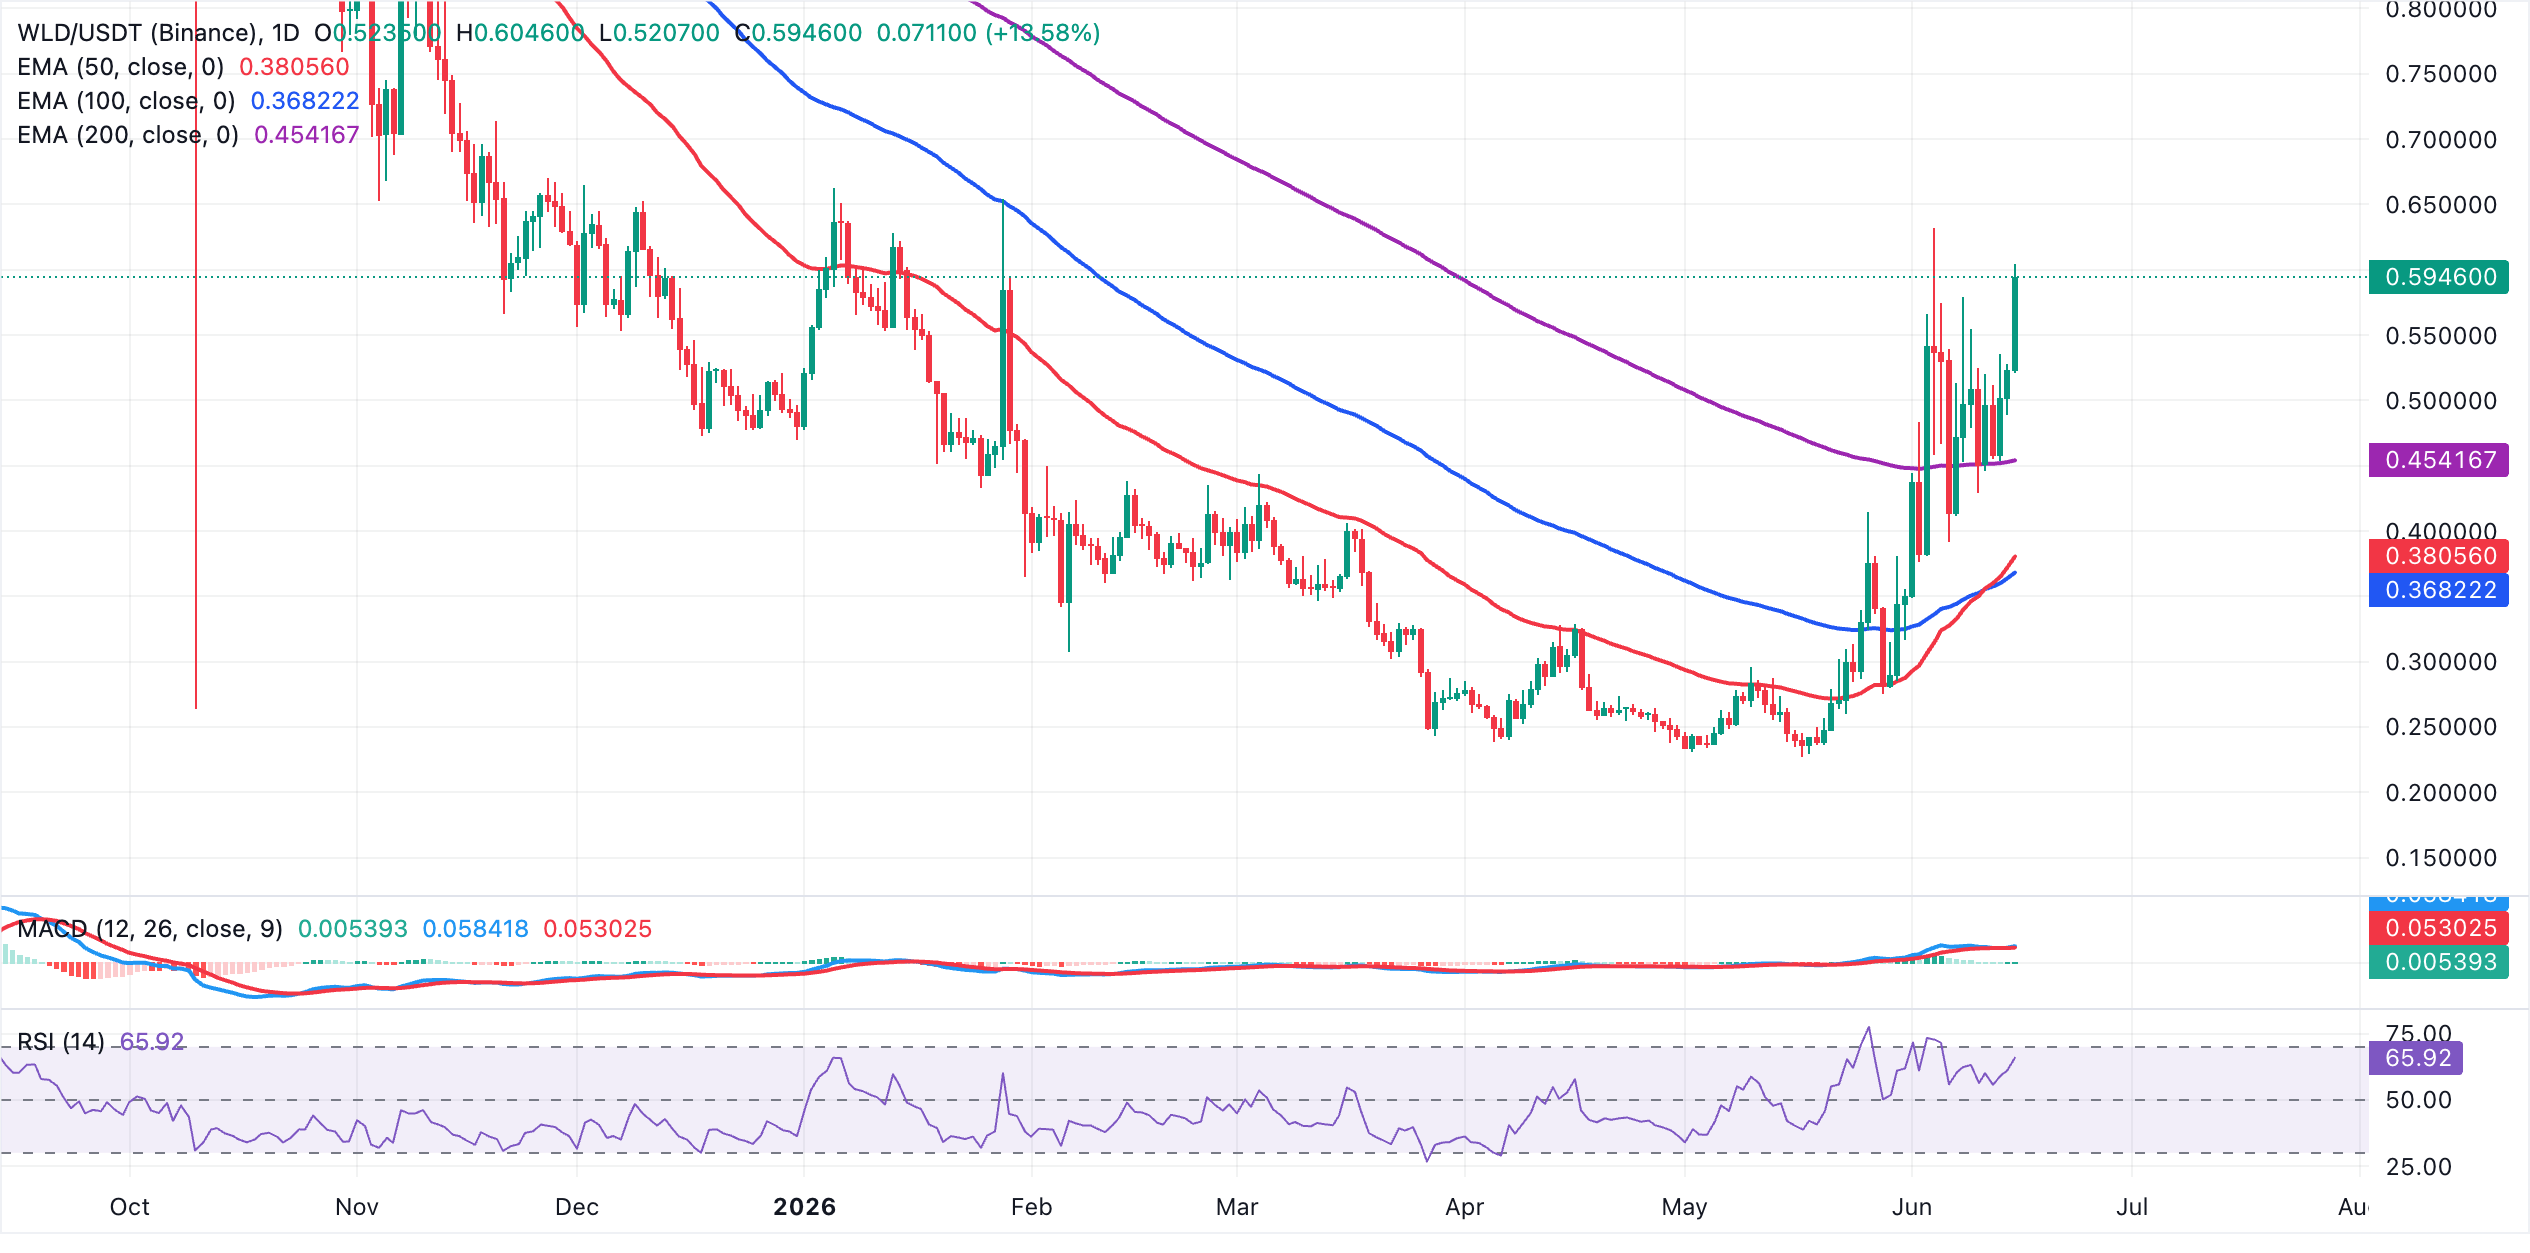
Initial support lies at the 200-day EMA around $0.45, with additional demand expected near the 50-day and 100-day EMAs clustered between roughly $0.38 and $0.37. A daily close below the $0.45 level would undermine the prevailing bullish momentum, increasing the likelihood of a mean-reversion move toward the EMA cluster.
Conversely, maintaining price action above $0.45 keeps the door open for further upside potential and possible retests of recent highs, which remain undefined by any significant resistance on the chart.
(The technical analysis of this story was written with the help of an AI tool.)
Bitcoin, altcoins, stablecoins FAQs
Bitcoin is the largest cryptocurrency by market capitalization, a virtual currency designed to serve as money. This form of payment cannot be controlled by any one person, group, or entity, which eliminates the need for third-party participation during financial transactions.
Altcoins are any cryptocurrency apart from Bitcoin, but some also regard Ethereum as a non-altcoin because it is from these two cryptocurrencies that forking happens. If this is true, then Litecoin is the first altcoin, forked from the Bitcoin protocol and, therefore, an “improved” version of it.
Stablecoins are cryptocurrencies designed to have a stable price, with their value backed by a reserve of the asset it represents. To achieve this, the value of any one stablecoin is pegged to a commodity or financial instrument, such as the US Dollar (USD), with its supply regulated by an algorithm or demand. The main goal of stablecoins is to provide an on/off-ramp for investors willing to trade and invest in cryptocurrencies. Stablecoins also allow investors to store value since cryptocurrencies, in general, are subject to volatility.
Bitcoin dominance is the ratio of Bitcoin's market capitalization to the total market capitalization of all cryptocurrencies combined. It provides a clear picture of Bitcoin’s interest among investors. A high BTC dominance typically happens before and during a bull run, in which investors resort to investing in relatively stable and high market capitalization cryptocurrency like Bitcoin. A drop in BTC dominance usually means that investors are moving their capital and/or profits to altcoins in a quest for higher returns, which usually triggers an explosion of altcoin rallies.

Mais de um milhão de usuários confiam na FXStreet para dados de mercado em tempo real, ferramentas de gráficos, insights de especialistas e notícias de Forex. Seu calendário econômico abrangente e webinars educacionais ajudam os traders a se manterem informados e tomarem decisões calculadas. A FXStreet conta com uma equipe de cerca de 60 profissionais, divididos entre a sede em Barcelona e diversas regiões globais.
Ler mais


