
Crypto Overview: Solana, Zcash, and Hyperliquid rebound while Bitcoin remains below $60,000
Por Vishal Dixit
Atualizado: 30 Jun 2026


ARTIGOS POPULARES

The broader cryptocurrency market remains under pressure with Bitcoin (BTC) below $60,000 on Tuesday, while Solana (SOL), Zcash (ZEC) and Hyperliquid (HYPE) emerge as top performers over the last 24 hours.
- Bitcoin remains below $60,000 on Tuesday, maintaining a consolidative tone for the fifth consecutive day.
- Solana, Zcash, and Hyperliquid are emerging as the best performers over the last 24 hours.
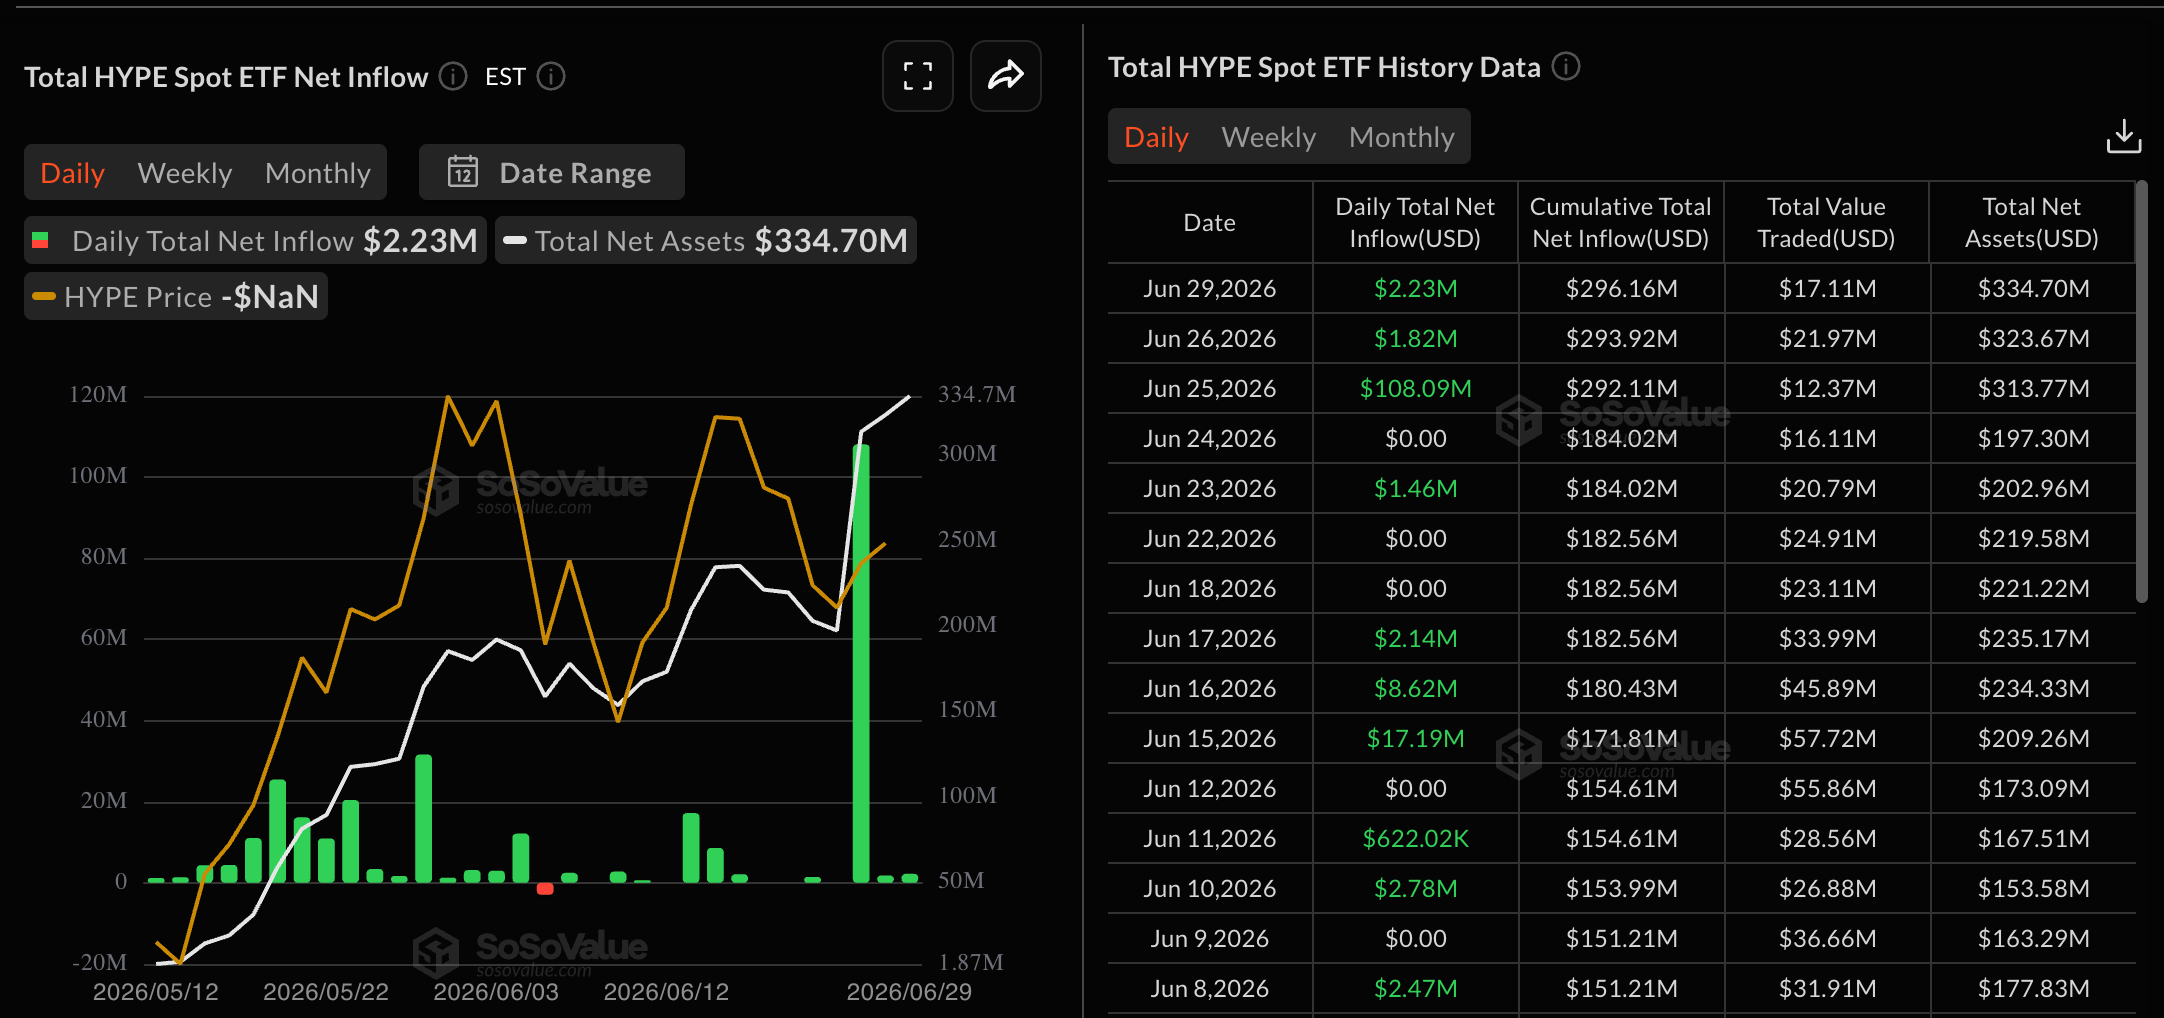
- Inflows into Solana and Hyperliquid ETFs support a mild recovery despite broader market risk-off sentiment.
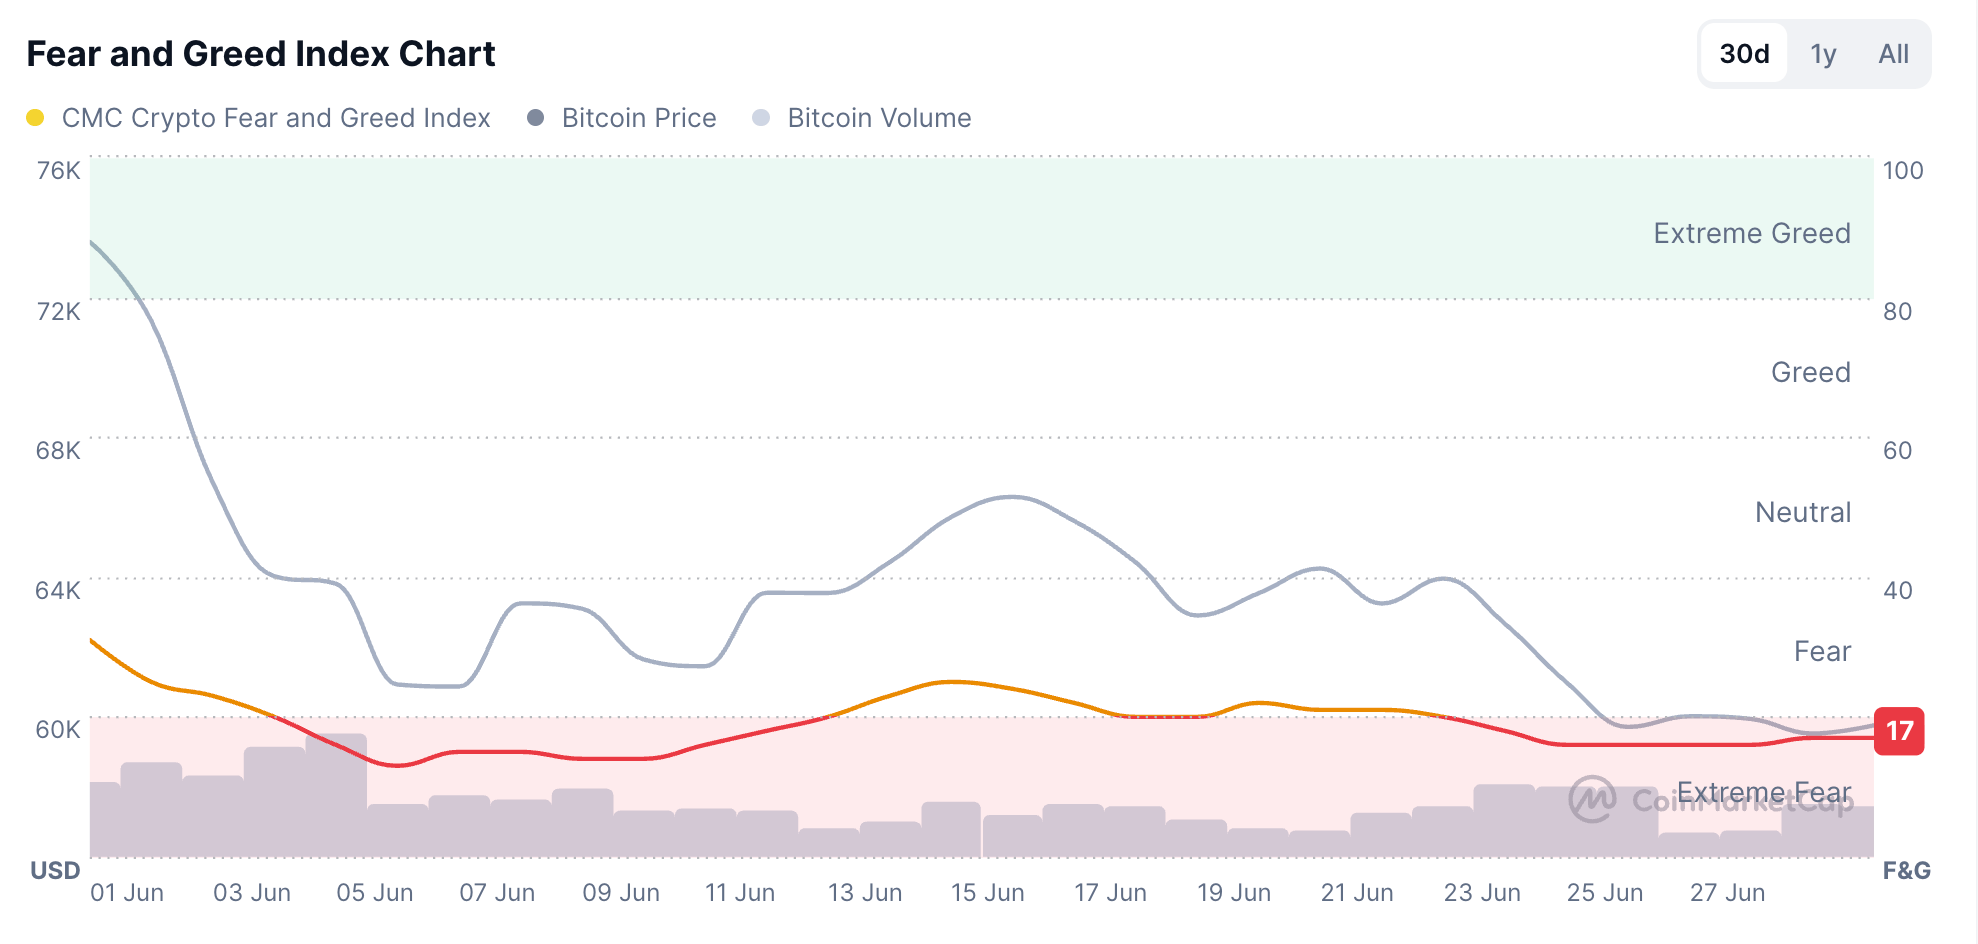
The broader cryptocurrency market remains under pressure with Bitcoin (BTC) below $60,000 on Tuesday, while Solana (SOL), Zcash (ZEC) and Hyperliquid (HYPE) emerge as top performers over the last 24 hours. Retail sentiment remains bearish with the Fear and Greed Index around 17 on Tuesday, during early Asian hours, maintaining an “Extreme Fear” signal.
Bitcoin remains muted near $60,000
Bitcoin edges below $60,000 at press time on Tuesday amid a broader bearish bias, with price waiting for the next catalyst for a directional push. The 50-day Exponential Moving Average (EMA) is at $66,698, and the 200-day EMA is at $77,512, reaffirming the prevailing downtrend.
BTC is also pinned just under the horizontal barrier at $60,000, while the earlier upward support trendline now acts as a broken structural reference near $74,131. That said, momentum is stabilizing on the daily chart as price consolidates near $60,000. The Moving Average Convergence Divergence (MACD) is turning marginally positive above its signal line, and the Relative Strength Index (RSI) is recovering toward 33, which hints at fading selling pressure but not yet a decisive shift in trend.
On the topside, immediate resistance appears at the $60,000 horizontal level, followed by the 50-day EMA at about $66,698, which reinforces the broader cap on recovery attempts. Above that, the prior trendline break area around $74,131 and the 200-day EMA near $77,512 mark deeper layers of overhead supply that would need to be reclaimed to weaken the prevailing bearish structure.
Looking down, a slip below the June 25 low at $58,115 could drop BTC toward the $53,485 support level, marked by the July 5, 2024 low.
SOL, ZEC and HYPE post mild recovery gains
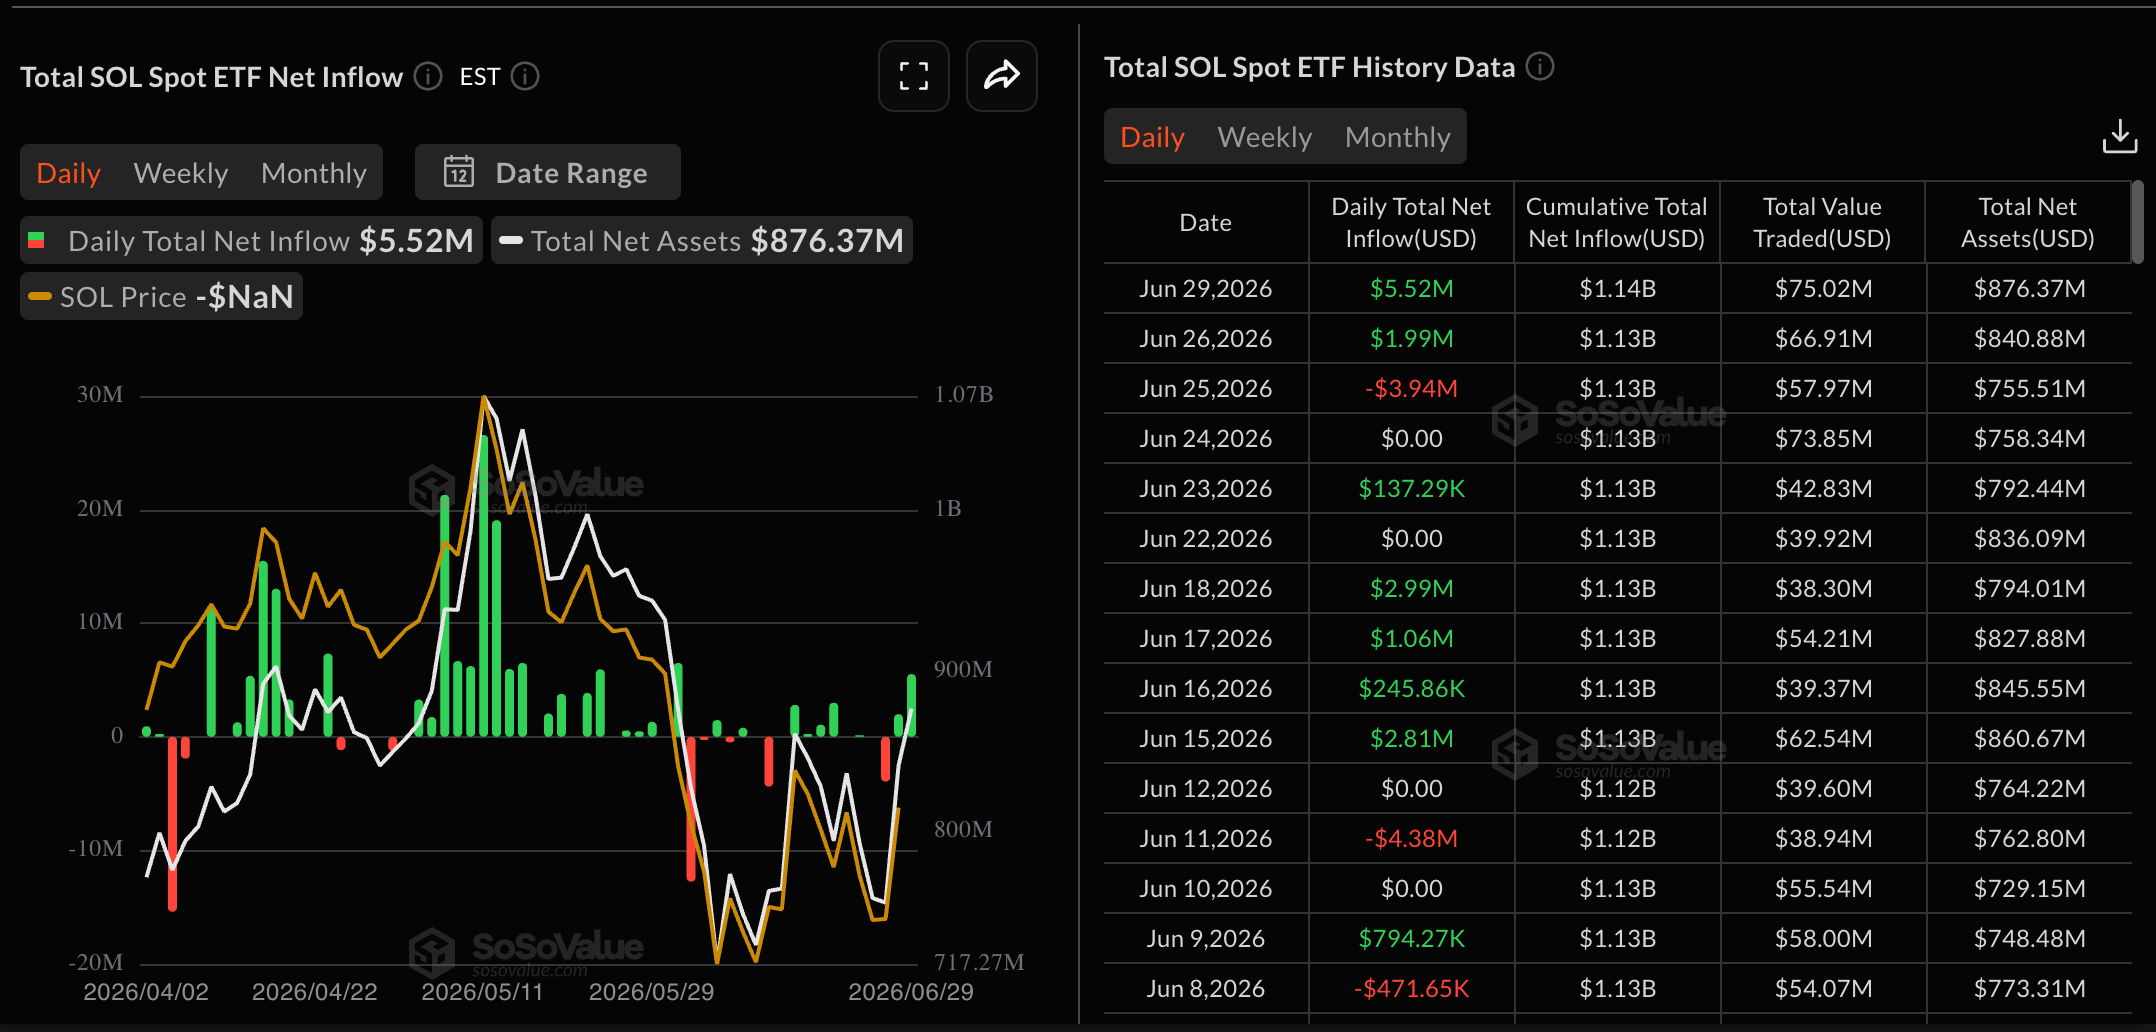
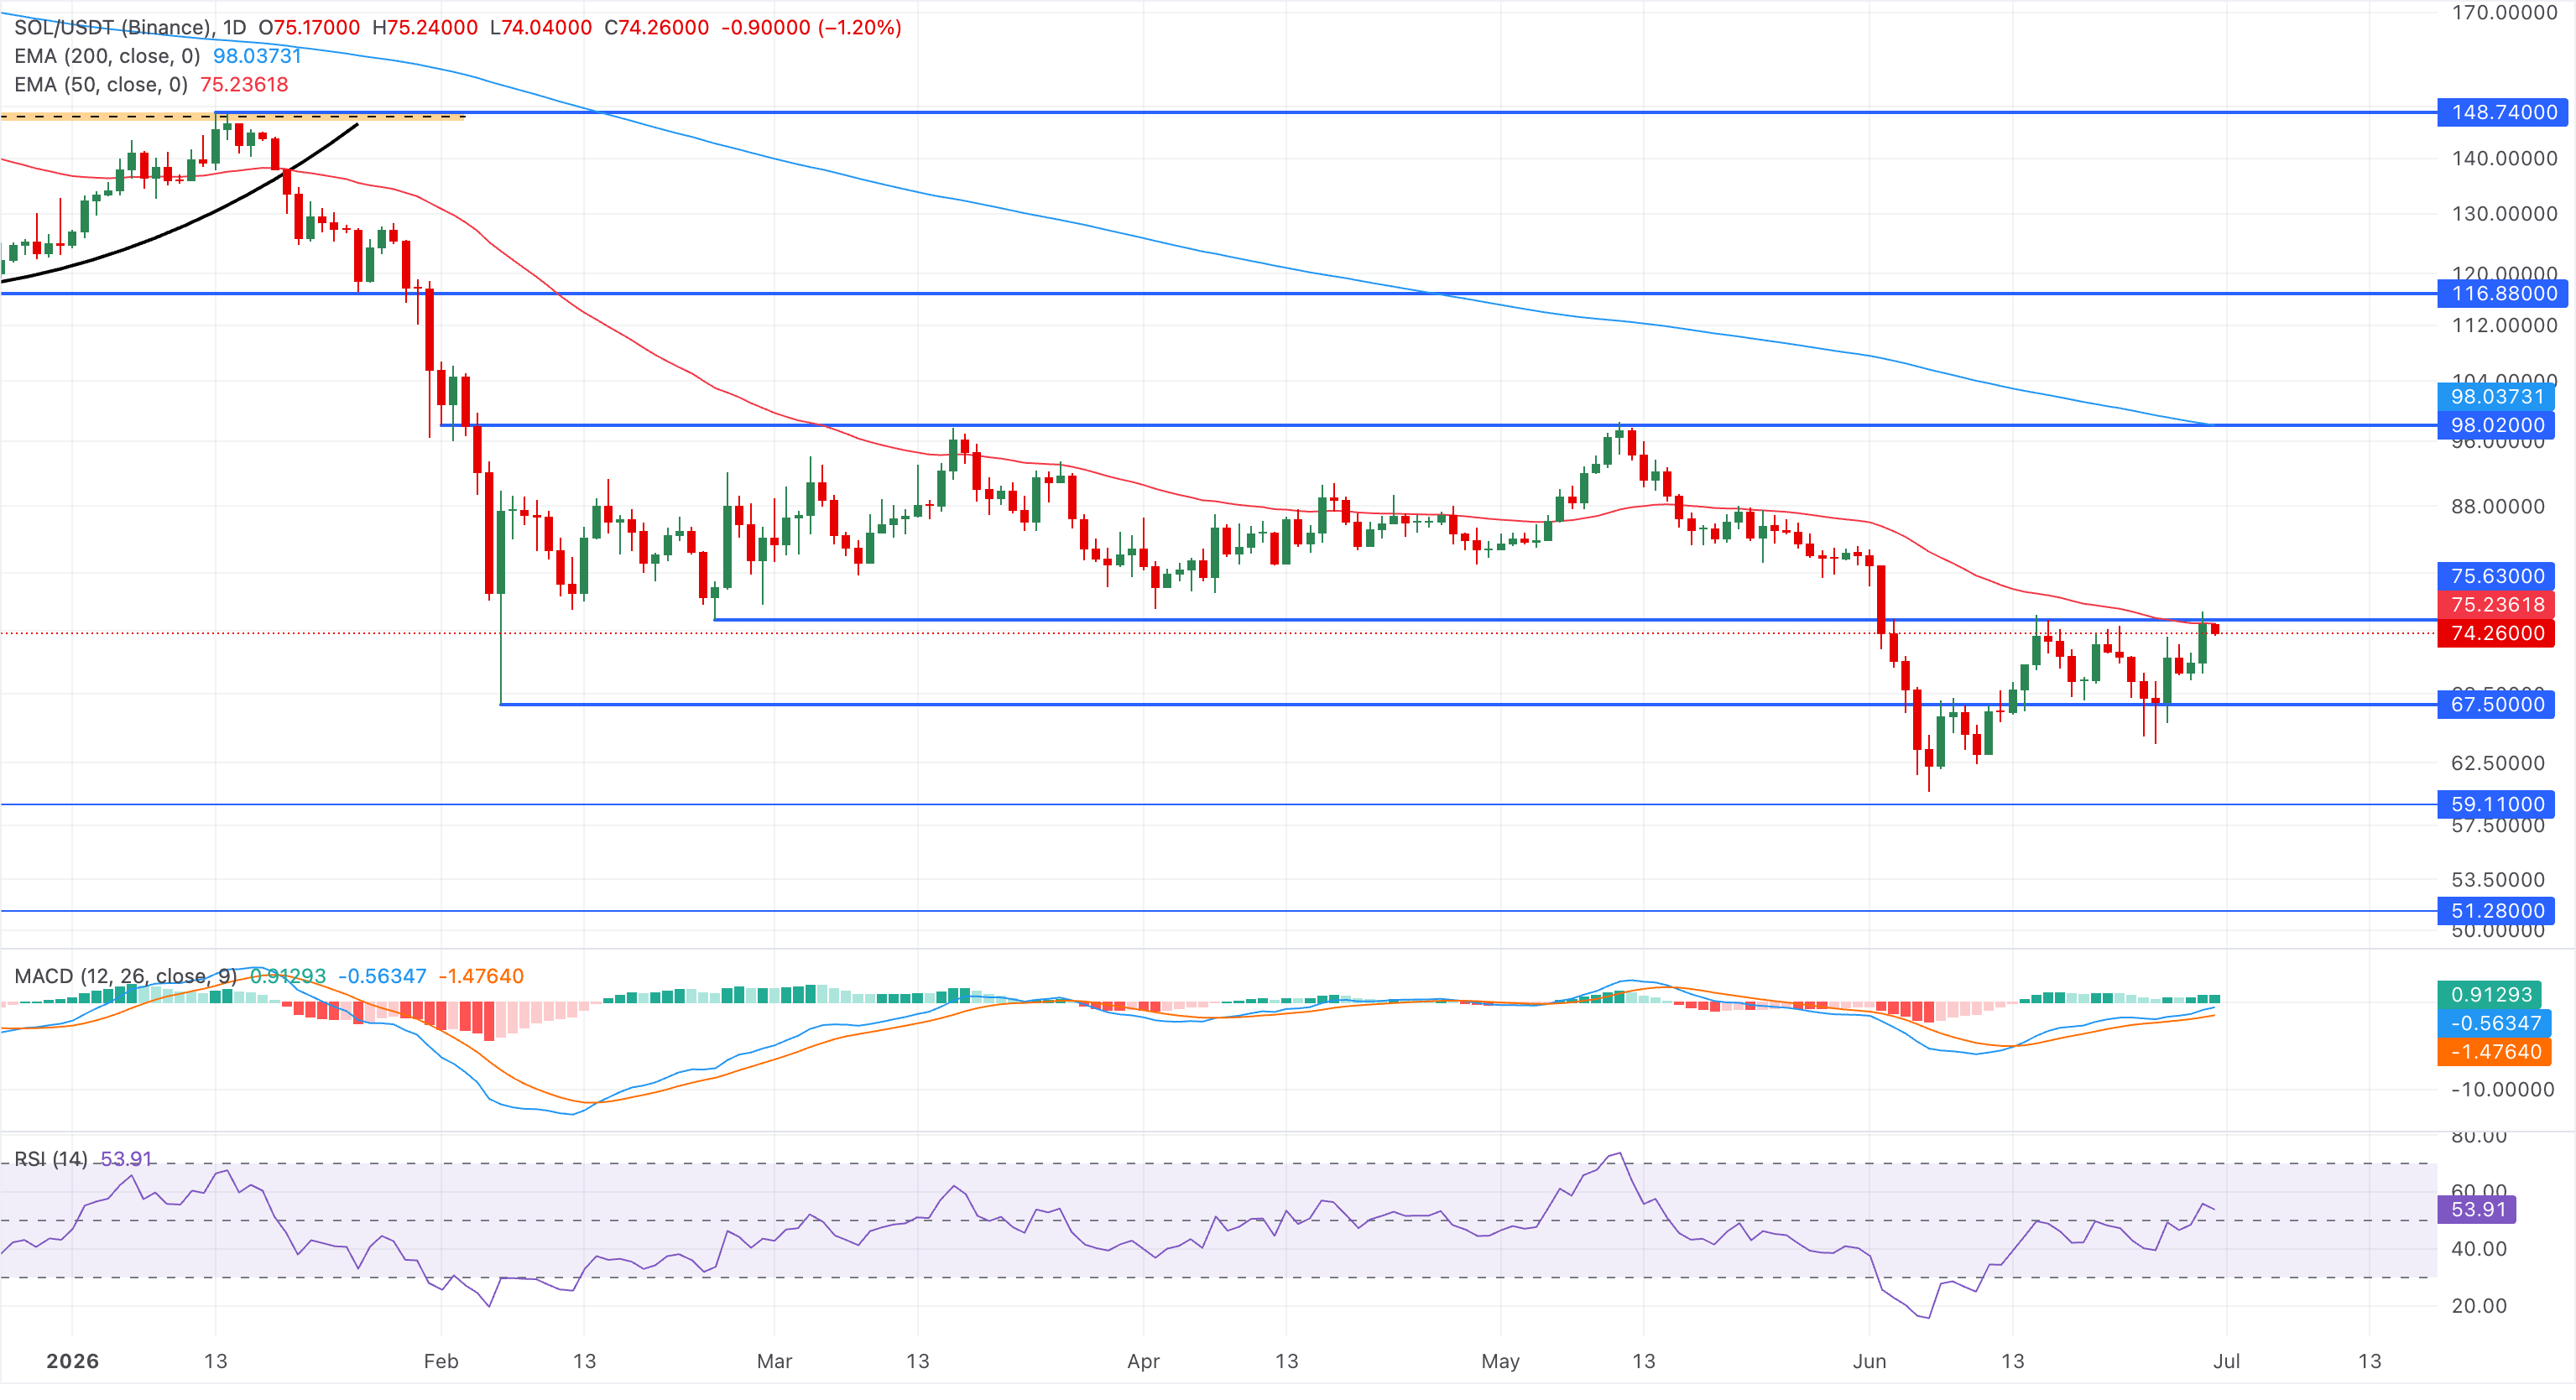
Solana is trading around $75 on Tuesday, following a 5% rebound the previous day. The recovery aligns with an inflow of $5.52 million into SOL-focused Exchange-Traded Funds (ETFs) on Monday, suggesting fresh institutional support this week.
From a technical perspective, the 50-day and 200-day EMAs at around $75.23 and $98.03, respectively, reaffirm the capped long-term trend. A decisive push above the 50-day EMA around $75.23 could further extend gains toward the broader trend barrier at the 200-day EMA near $98.03.
Solana has bounced off recent lows, pushing the MACD and signal line higher toward the zero line, while the RSI at 55 crosses above the midline, hinting at a recovery phase. Yet these positive signals remain constrained by the overhead moving average structure.
Zcash hovers around $400 on Tuesday, after an 8% rise on Monday, crossing above its 200-day EMA at $380. The privacy coin projects a possible double-bottom reversal from the 20-day EMA, near the 50% retracement level at $356, measured from the $184 to $690 upswing.
Momentum shows a decline in bearish pressure, with RSI at 42 indicating an uptick while the MACD prepares for a potential bullish crossover above its signal line.
If ZEC clears the 50-day EMA at $454, it could target the 78.6% Fibonacci retracement level at $520.
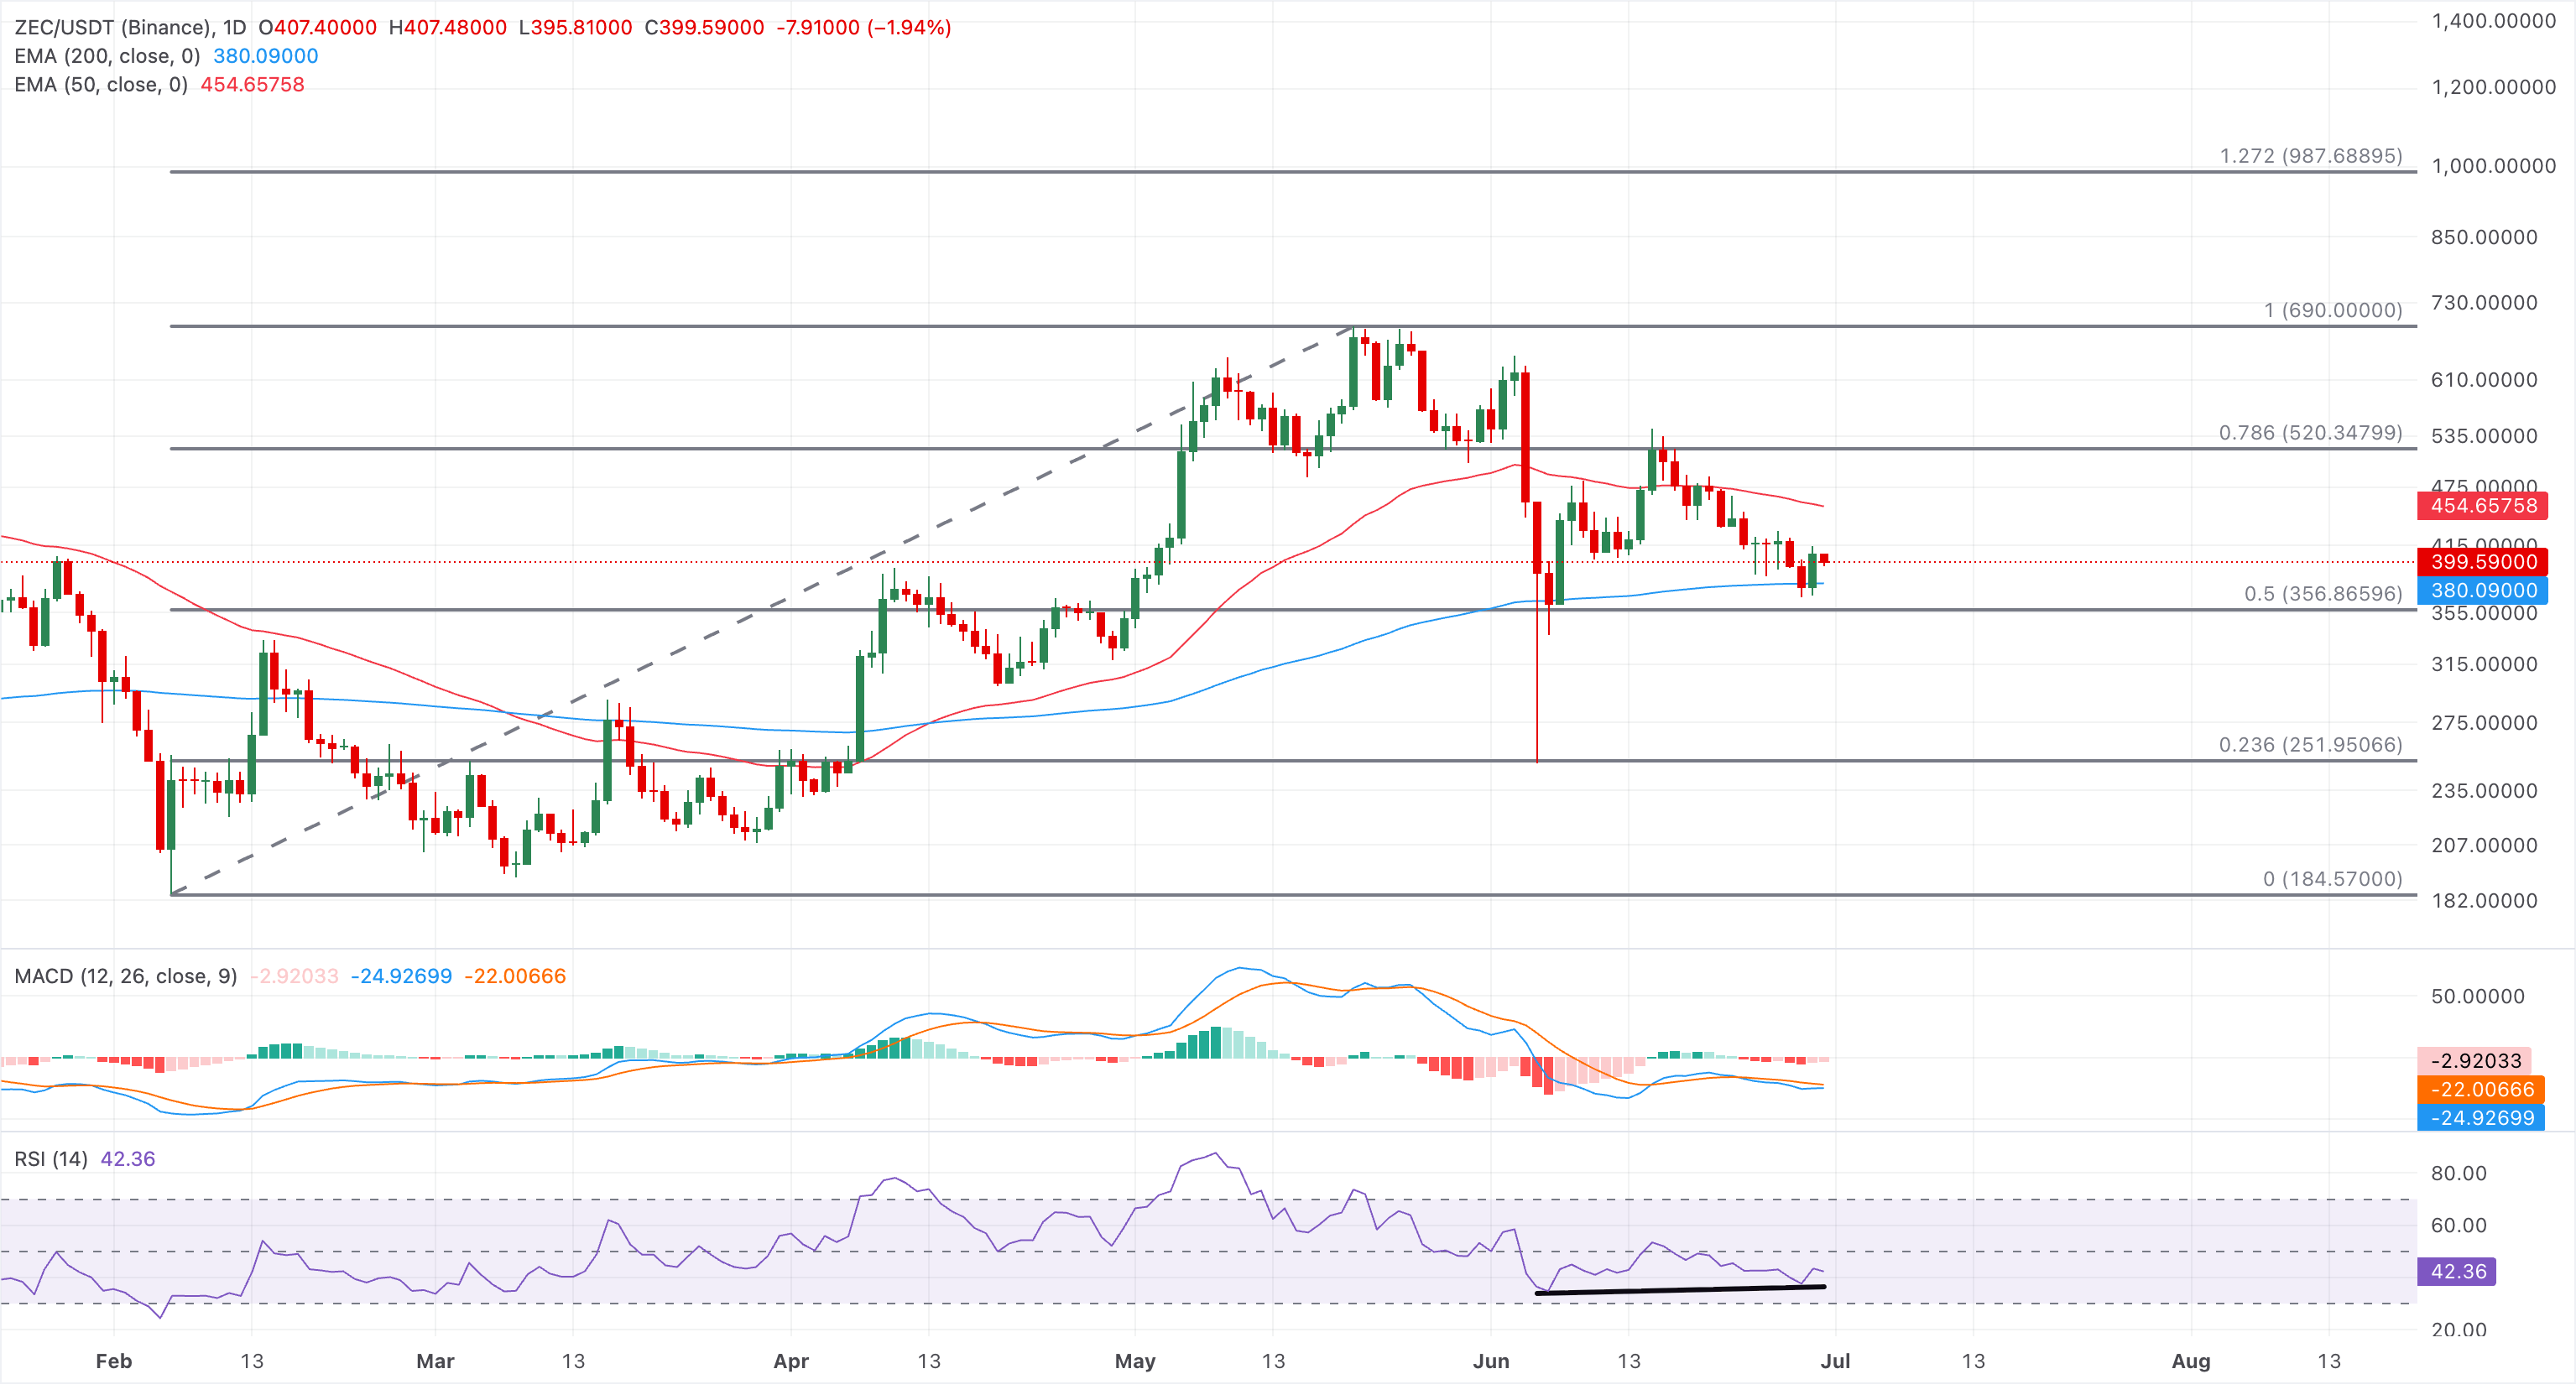
On the downside, immediate support is seen around $356, guarding the $300 round figure, followed by the 23.6% Fibonacci retracement level at $251.
Finally, Hyperliquid shows steady behavior around $66 on Tuesday, following a nearly 9% rebound from the 50-day EMA at $60.08 on Monday. Similar to SOL, the rebound in HYPE coincides with a $2.23 million inflow into US spot HYPE ETFs on Monday.
Momentum indicators on the daily chart suggest the broader uptrend is intact, with the RSI at 53 holding above the midline while the negative MACD histogram contracts, hinting at waning downside momentum.
The 78.6% Fibonacci retracement level at $66.22 serves as the immediate resistance, measured over the upswing from $38.17 to $76.93. A decisive close above this resistance zone could target the all-time high level of $76.93, followed by the 127.2% Fibonacci extension level at $93.08.
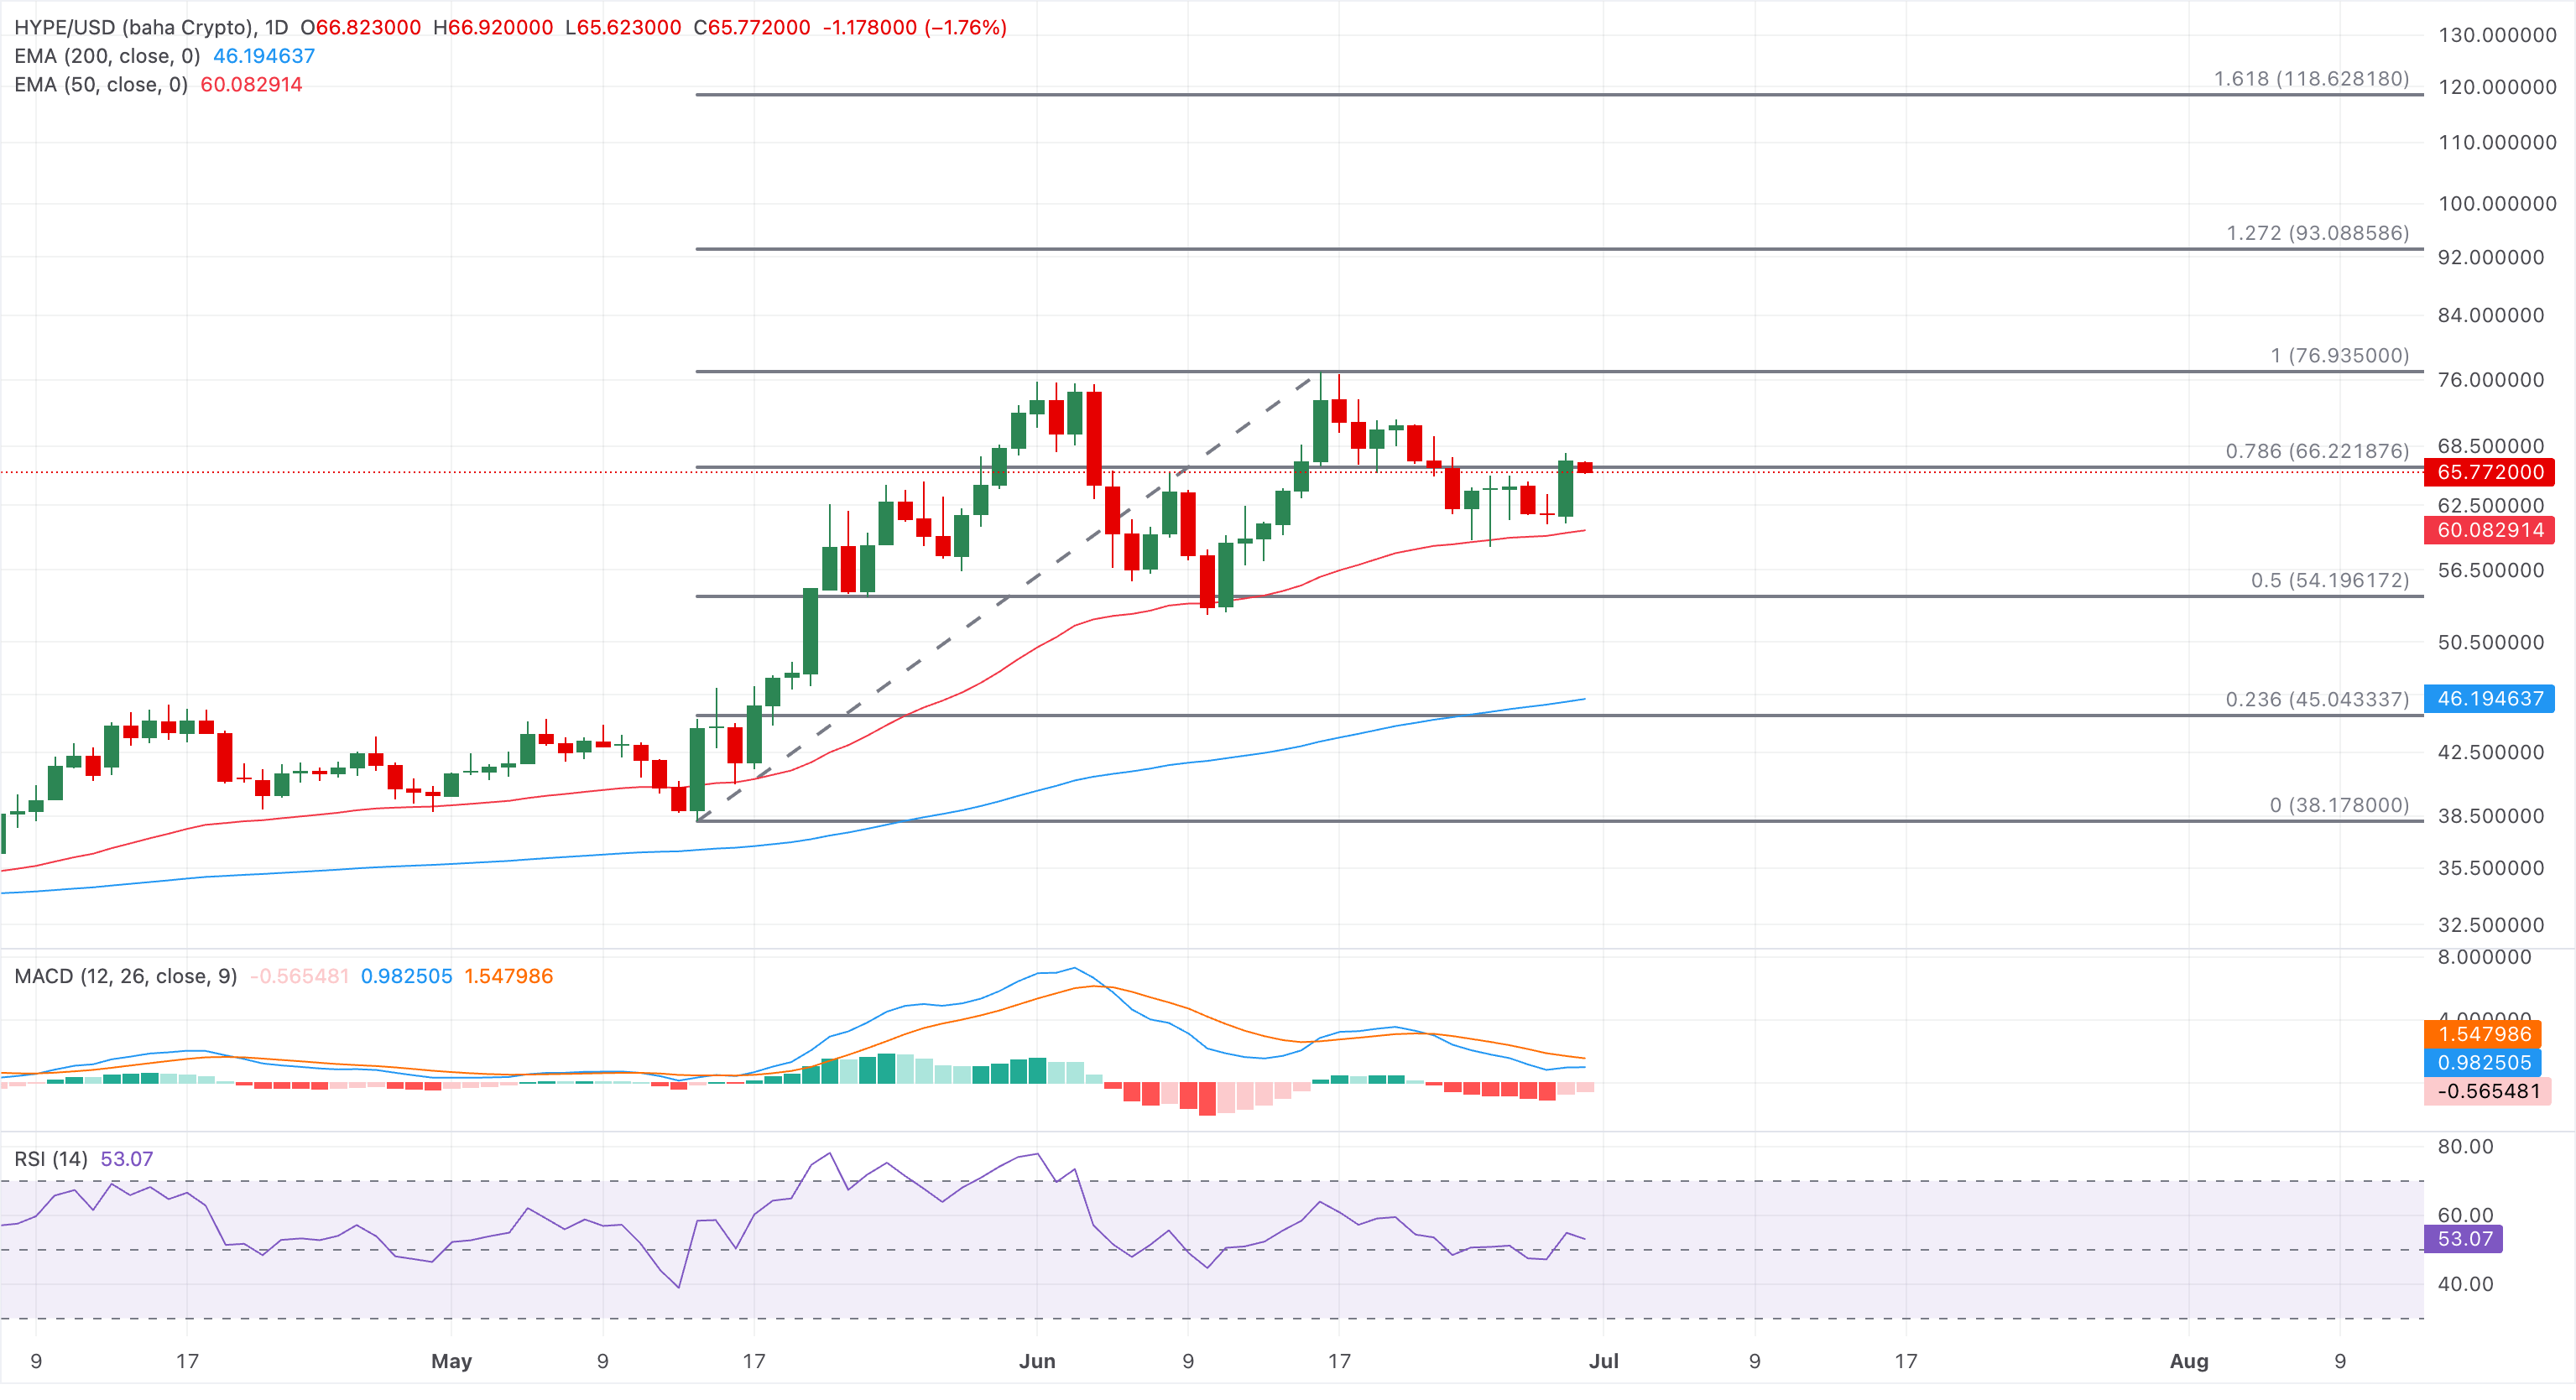
Looking to the downside, the 50-day EMA at $60.08 emerges as immediate support, followed by the 50% retracement level at $54.19.
(The technical analysis of this story was written with the help of an AI tool.)

Mais de um milhão de usuários confiam na FXStreet para dados de mercado em tempo real, ferramentas de gráficos, insights de especialistas e notícias de Forex. Seu calendário econômico abrangente e webinars educacionais ajudam os traders a se manterem informados e tomarem decisões calculadas. A FXStreet conta com uma equipe de cerca de 60 profissionais, divididos entre a sede em Barcelona e diversas regiões globais.
Ler mais


