
Crypto Today: Bitcoin, Ethereum, XRP hold near weekly highs amid ETF inflows, US-Iran talk hopes
Por John Isige
Atualizado: 17 Apr 2026


ARTIGOS POPULARES

Bitcoin (BTC) is extending gains above $75,000 at the time of writing on Friday, while bulls appear intent on advancing beyond the weekly high around $76,000.
- Bitcoin trades below its weekly peak of around $76,000 amid the ceasefire between Israel and Lebanon and hopes for fresh US-Iran peace talks.
- Ethereum trades near the 100-day EMA as upside momentum steadies, backed by inflows into spot ETFs.
- XRP consolidates gains above $1.44 support, supported by a MACD buy signal and growing risk-on sentiment.
Bitcoin (BTC) is extending gains above $75,000 at the time of writing on Friday, while bulls appear intent on advancing beyond the weekly high around $76,000. Altcoins, including Ethereum (ETH) and Ripple (XRP), signal a positive outlook, with ETH sitting above $2,350 and XRP near its weekly high of $1.46.
Meanwhile, geopolitical tensions in the Middle East remain a concern for risk assets, as the second round of peace talks between the United States (US) and Iran has yet to be confirmed. The US Navy continues to blockade the Strait of Hormuz, as pressure on global Oil and Gas supplies escalates.
On the bright side, the Israel-Lebanon ceasefire is now in effect and is expected to last 10 days. Despite the truce, both camps remain alert, with Israel troops still in the Lebanese “security zone” while Hezbollah warns that it is keeping its “finger on the trigger,” in the event of any “treachery and betrayal" during the ceasefire period.
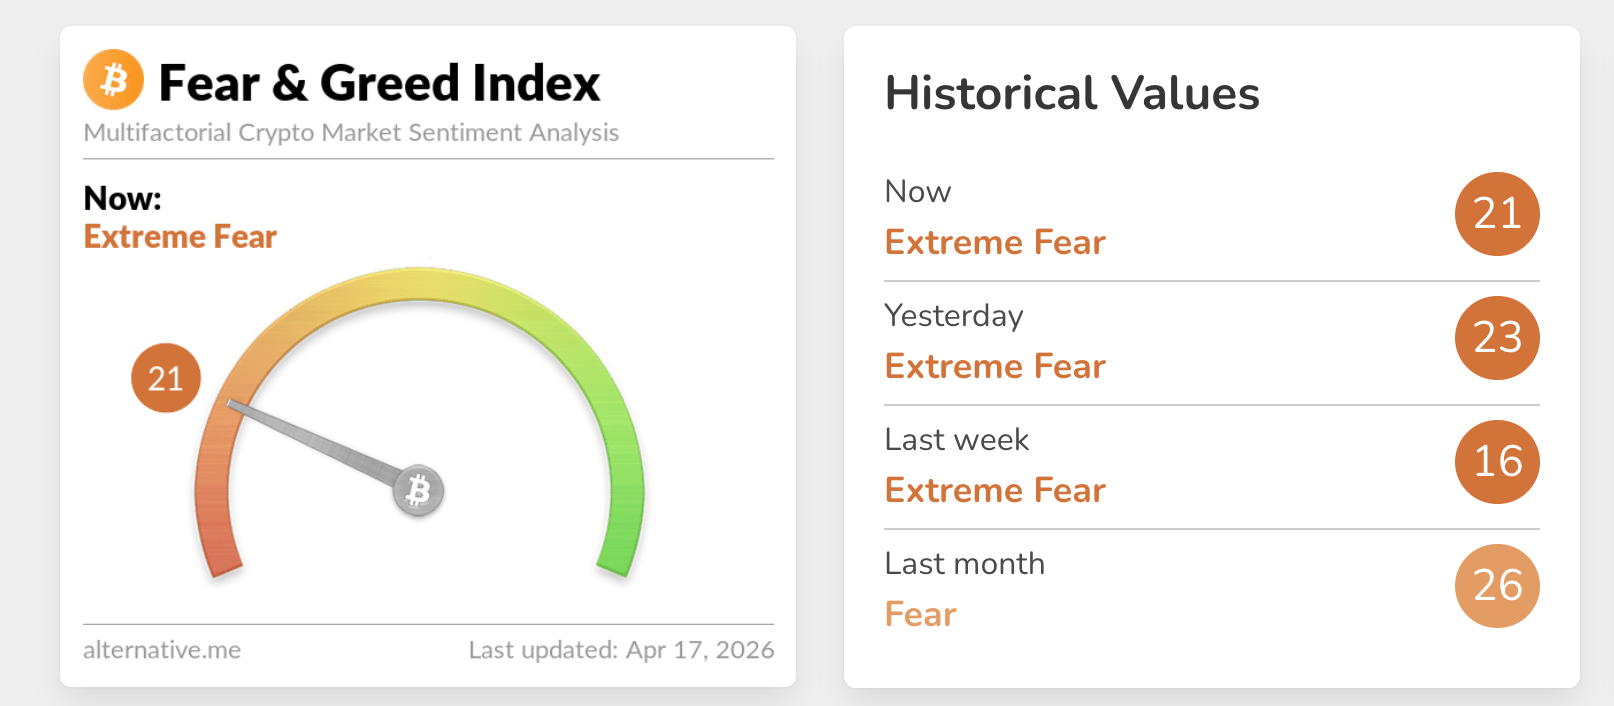
Sentiment in the broader cryptocurrency market has improved slightly this week, supporting the growing risk-on mood. The crypto Fear & Greed Index, despite remaining in extreme fear territory, is at 21 on Friday, up from the 16 recorded last week.
Renewed investor interest boosts Bitcoin, Ethereum and XRP ETFs
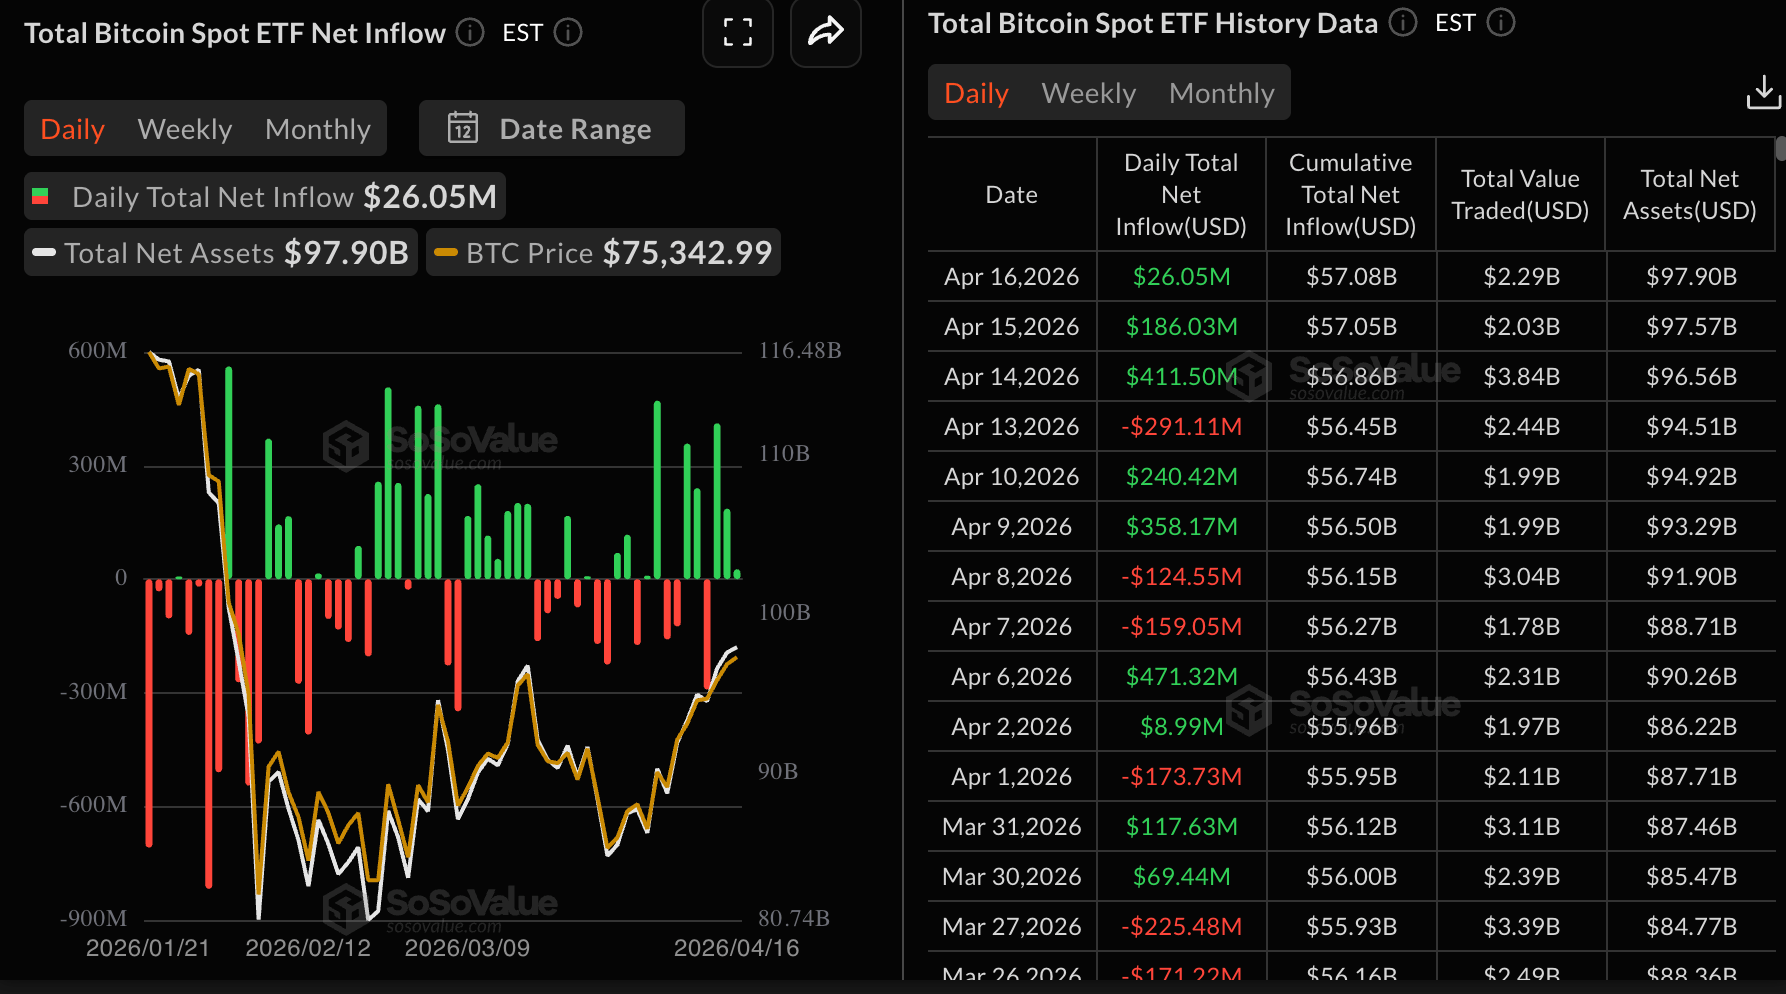
Institutional investors’ return to the market is evidenced by steady inflows into Bitcoin spot Exchange Traded Funds (ETFs), as BTC gathers momentum above $75,000. US-listed ETFs attracted roughly $26 million in inflows on Thursday, aligning with the price increase from the weekly open of $70,742.
Cumulative inflows currently stand at $57.08 billion, with net assets under management averaging $97.90 billion. If inflows into the spot ETFs continue amid growing risk appetite, prices could steadily increase, with Bitcoin grinding toward the $80,000 psychological level.
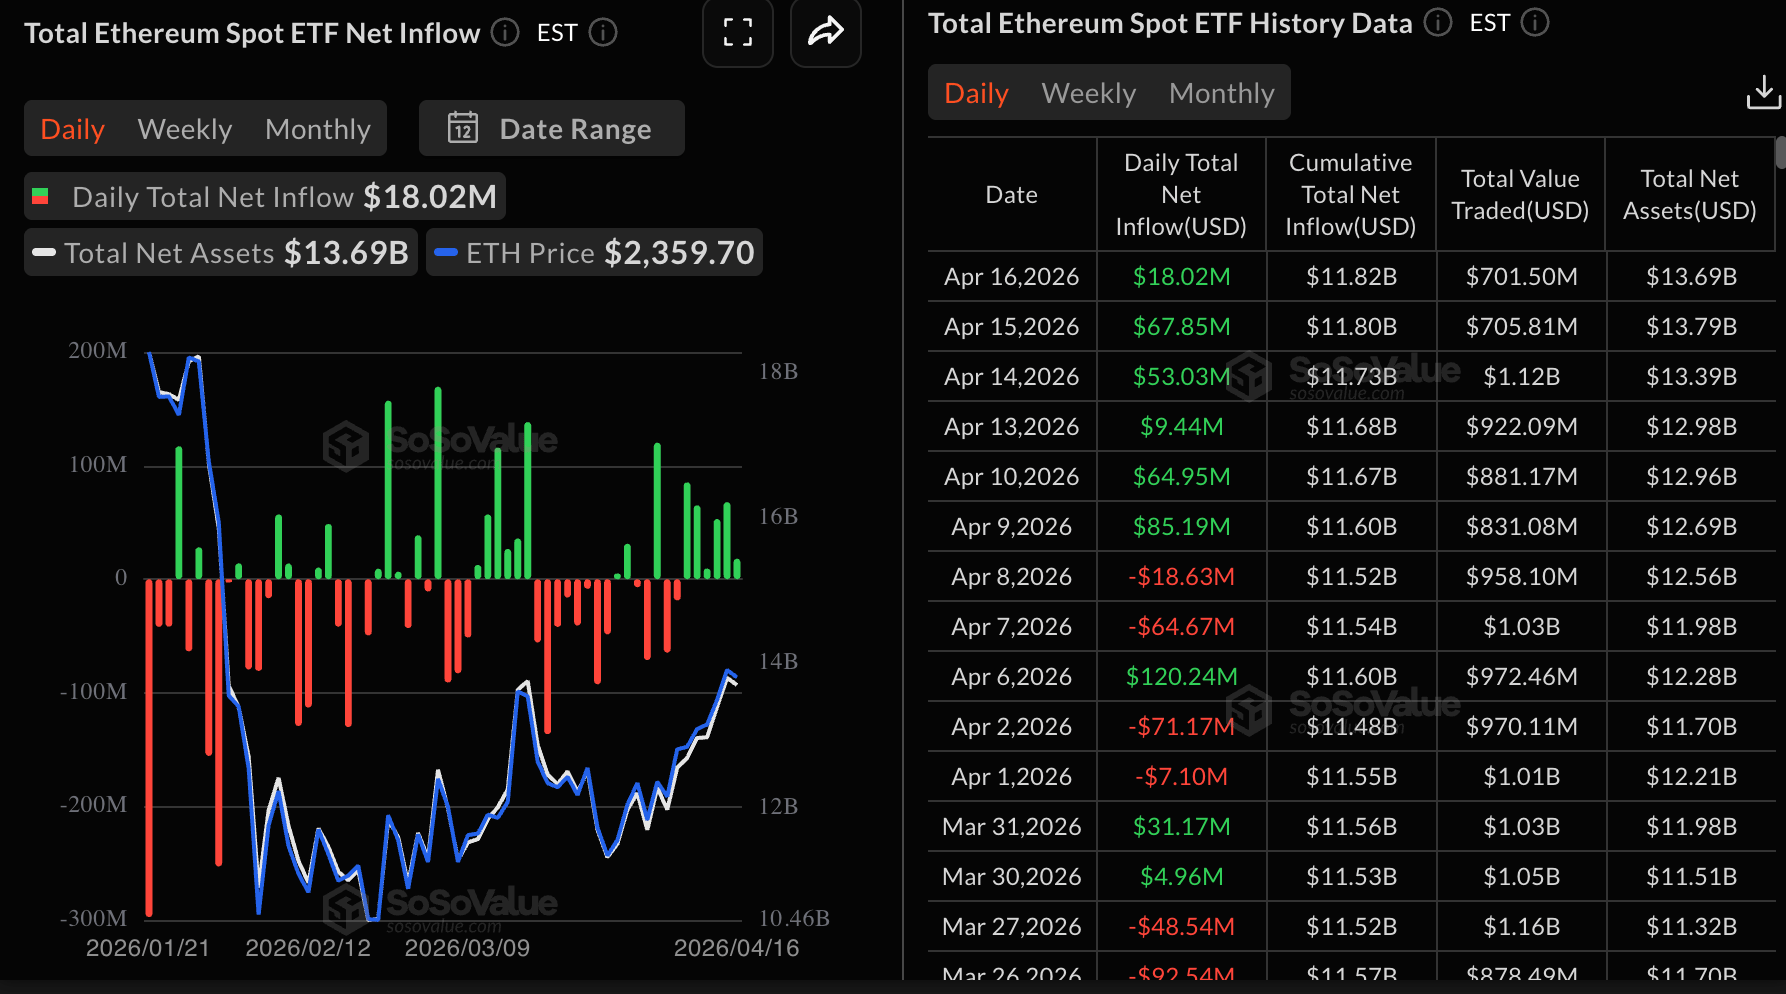
Ethereum similarly recorded inflows of roughly $18 million on Thursday, extending the bullish streak for the sixth consecutive day. Renewed investor risk appetite has propelled cumulative inflows into ETH spot ETFs to an average of $11.82 billion, while net assets under management now stand at $13.69 billion. A further increase in the Ethereum price could depend on risk-on sentiment remaining steady.
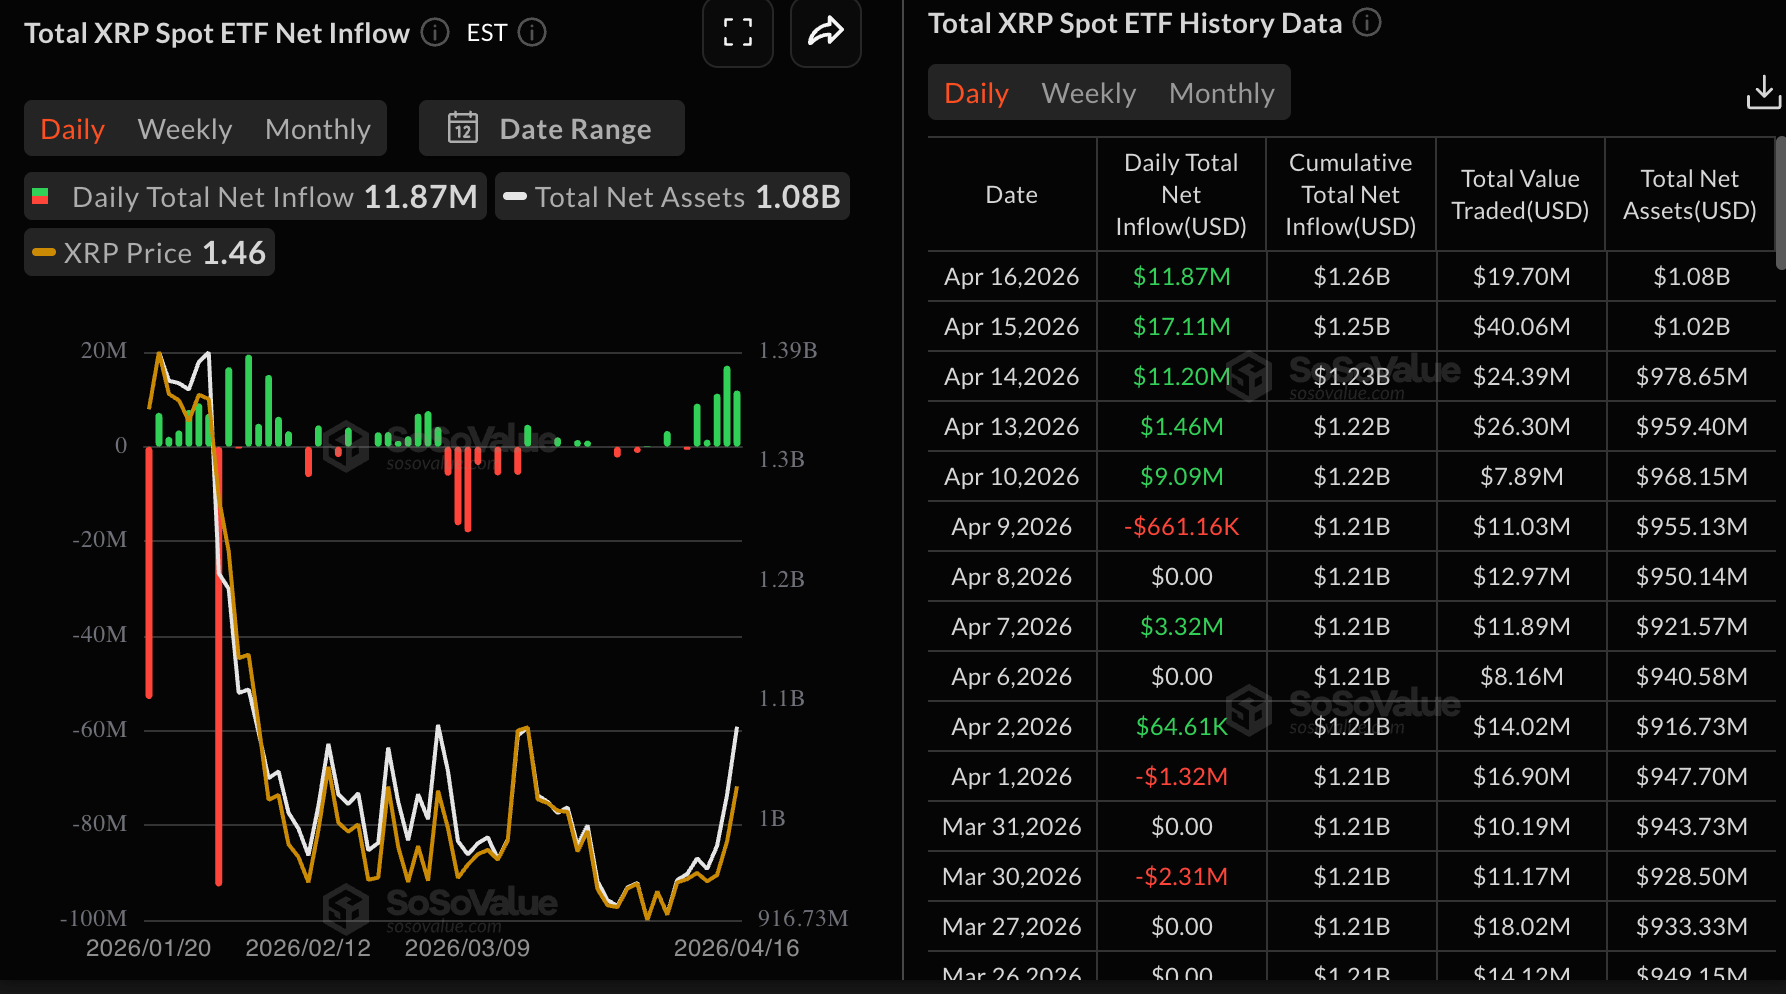
Meanwhile, demand for XRP spot ETFs continues to track closely with Bitcoin and Ethereum, as evidenced by Thursday’s $11.87 million in inflows. Cumulative inflows stand at $1.26 billion and net assets under management at $1.08 billion, which underscores growing interest in XRP and related investment products.
Crypto Today: Bitcoin tests breakout strength as $75,000 support holds
Bitcoin trades at $75,286, holding a constructive bullish bias as it sits marginally above the 100-day Exponential Moving Average (EMA) at $75,277 and well above the 50-day EMA at $71,468. This configuration suggests the recent advance is supported by underlying demand.
Momentum is aligned with the bullish tone, with the Moving Average Convergence Divergence (MACD) histogram positive and rising on the daily chart and the Relative Strength Index (RSI) hovering near 64, indicating firm buying pressure without a clear overbought signal.
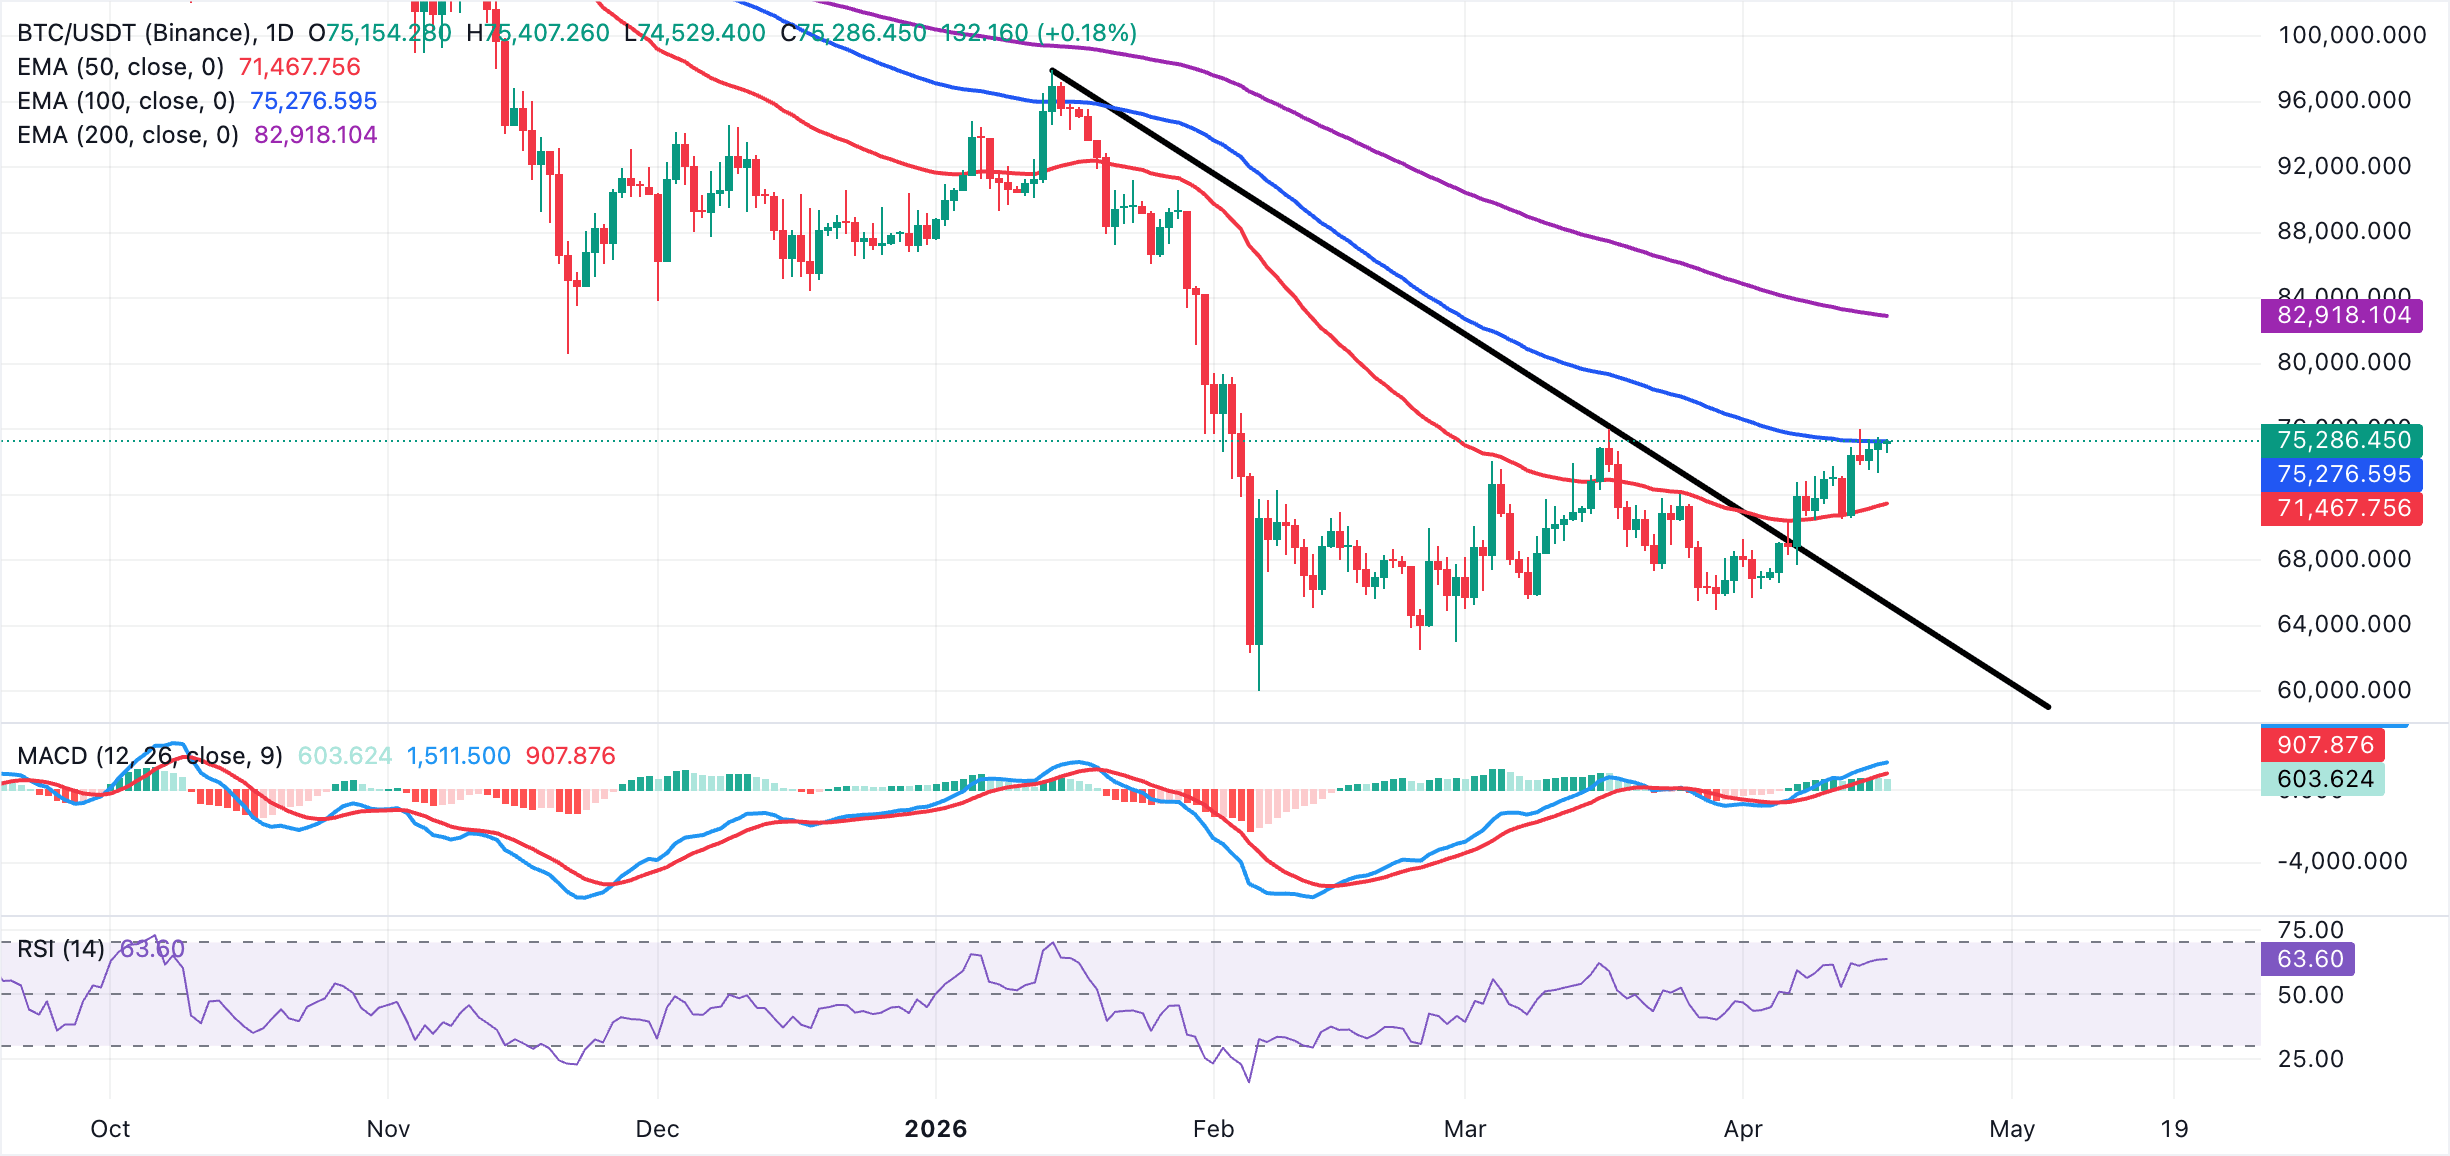
On the topside, immediate resistance is implied by the weekly high at $76,370. A sustained break above that barrier is needed to open the way toward the 200-day EMA at $82,918. On the downside, initial support is seen at the 100-day EMA around $75,277, where a daily close back below would hint at fading short-term enthusiasm and expose the 50-day EMA near $71,468 as the next key floor for the prevailing uptrend.
Ethereum trades at $2,353, holding above its 50-day EMA at $2,196. Still, the smart contract token's upside is capped beneath the 100-day EMA at $2,356 and the 200-day EMA at $2,654. This configuration suggests a neutral-to-slightly constructive tone, with price having reclaimed short-term trend support while the broader downtrend remains intact.
Moreover, the RSI hovers around 62 on the daily chart, indicating positive but not overbought momentum, while the MACD remains in positive territory with a firm histogram, suggesting buyers retain an edge as long as price holds above the 50-day EMA.
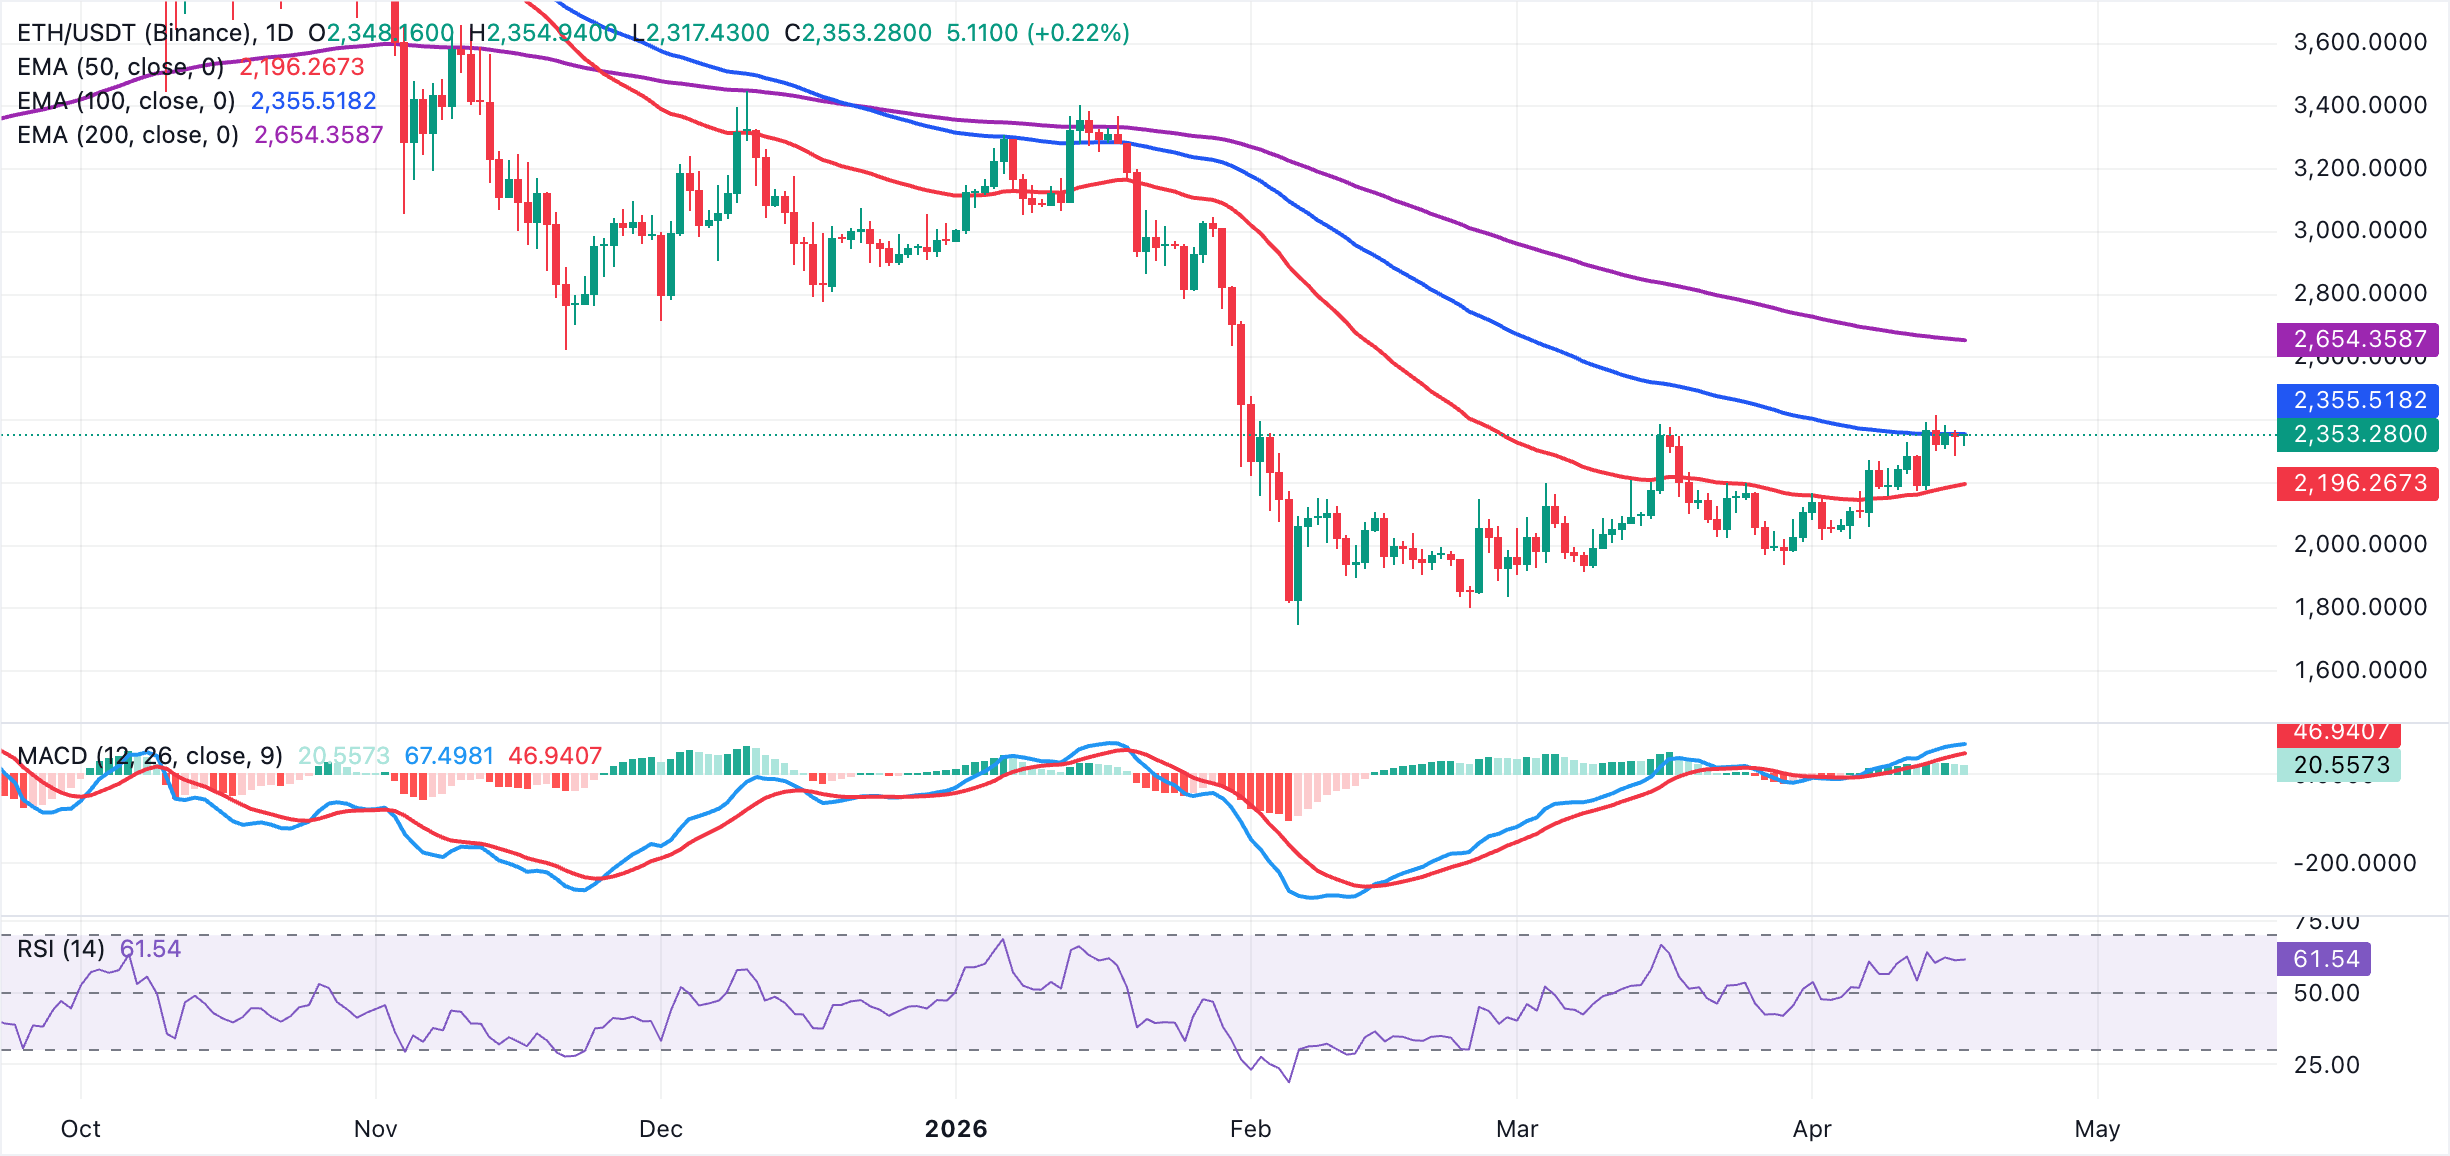
On the topside, immediate resistance emerges at the 100-day EMA at $2,356, which is the first level bulls need to clear to extend the rebound, ahead of the more significant 200-day EMA barrier around $2,654. On the downside, initial support lies at the 50-day EMA around $2,196. A daily close below this level would weaken the current recovery structure and expose a deeper pullback, while sustained consolidation above it would keep the door open for a retest of the 100-day EMA.
XRP, on the other hand, trades at $1.44 while holding above the 50-day EMA at $1.41. However, its upside remains limited below the 100-day EMA at $1.55 and the 200-day EMA at $1.81, which keeps the broader backdrop fragile despite the latest rebound. Momentum has improved, with the MACD histogram turning positive on the daily chart and the RSI hovering near 61. Both indicators hint that buyers are attempting to rebuild pressure within an overall structure still dominated by overhead moving-average resistance.
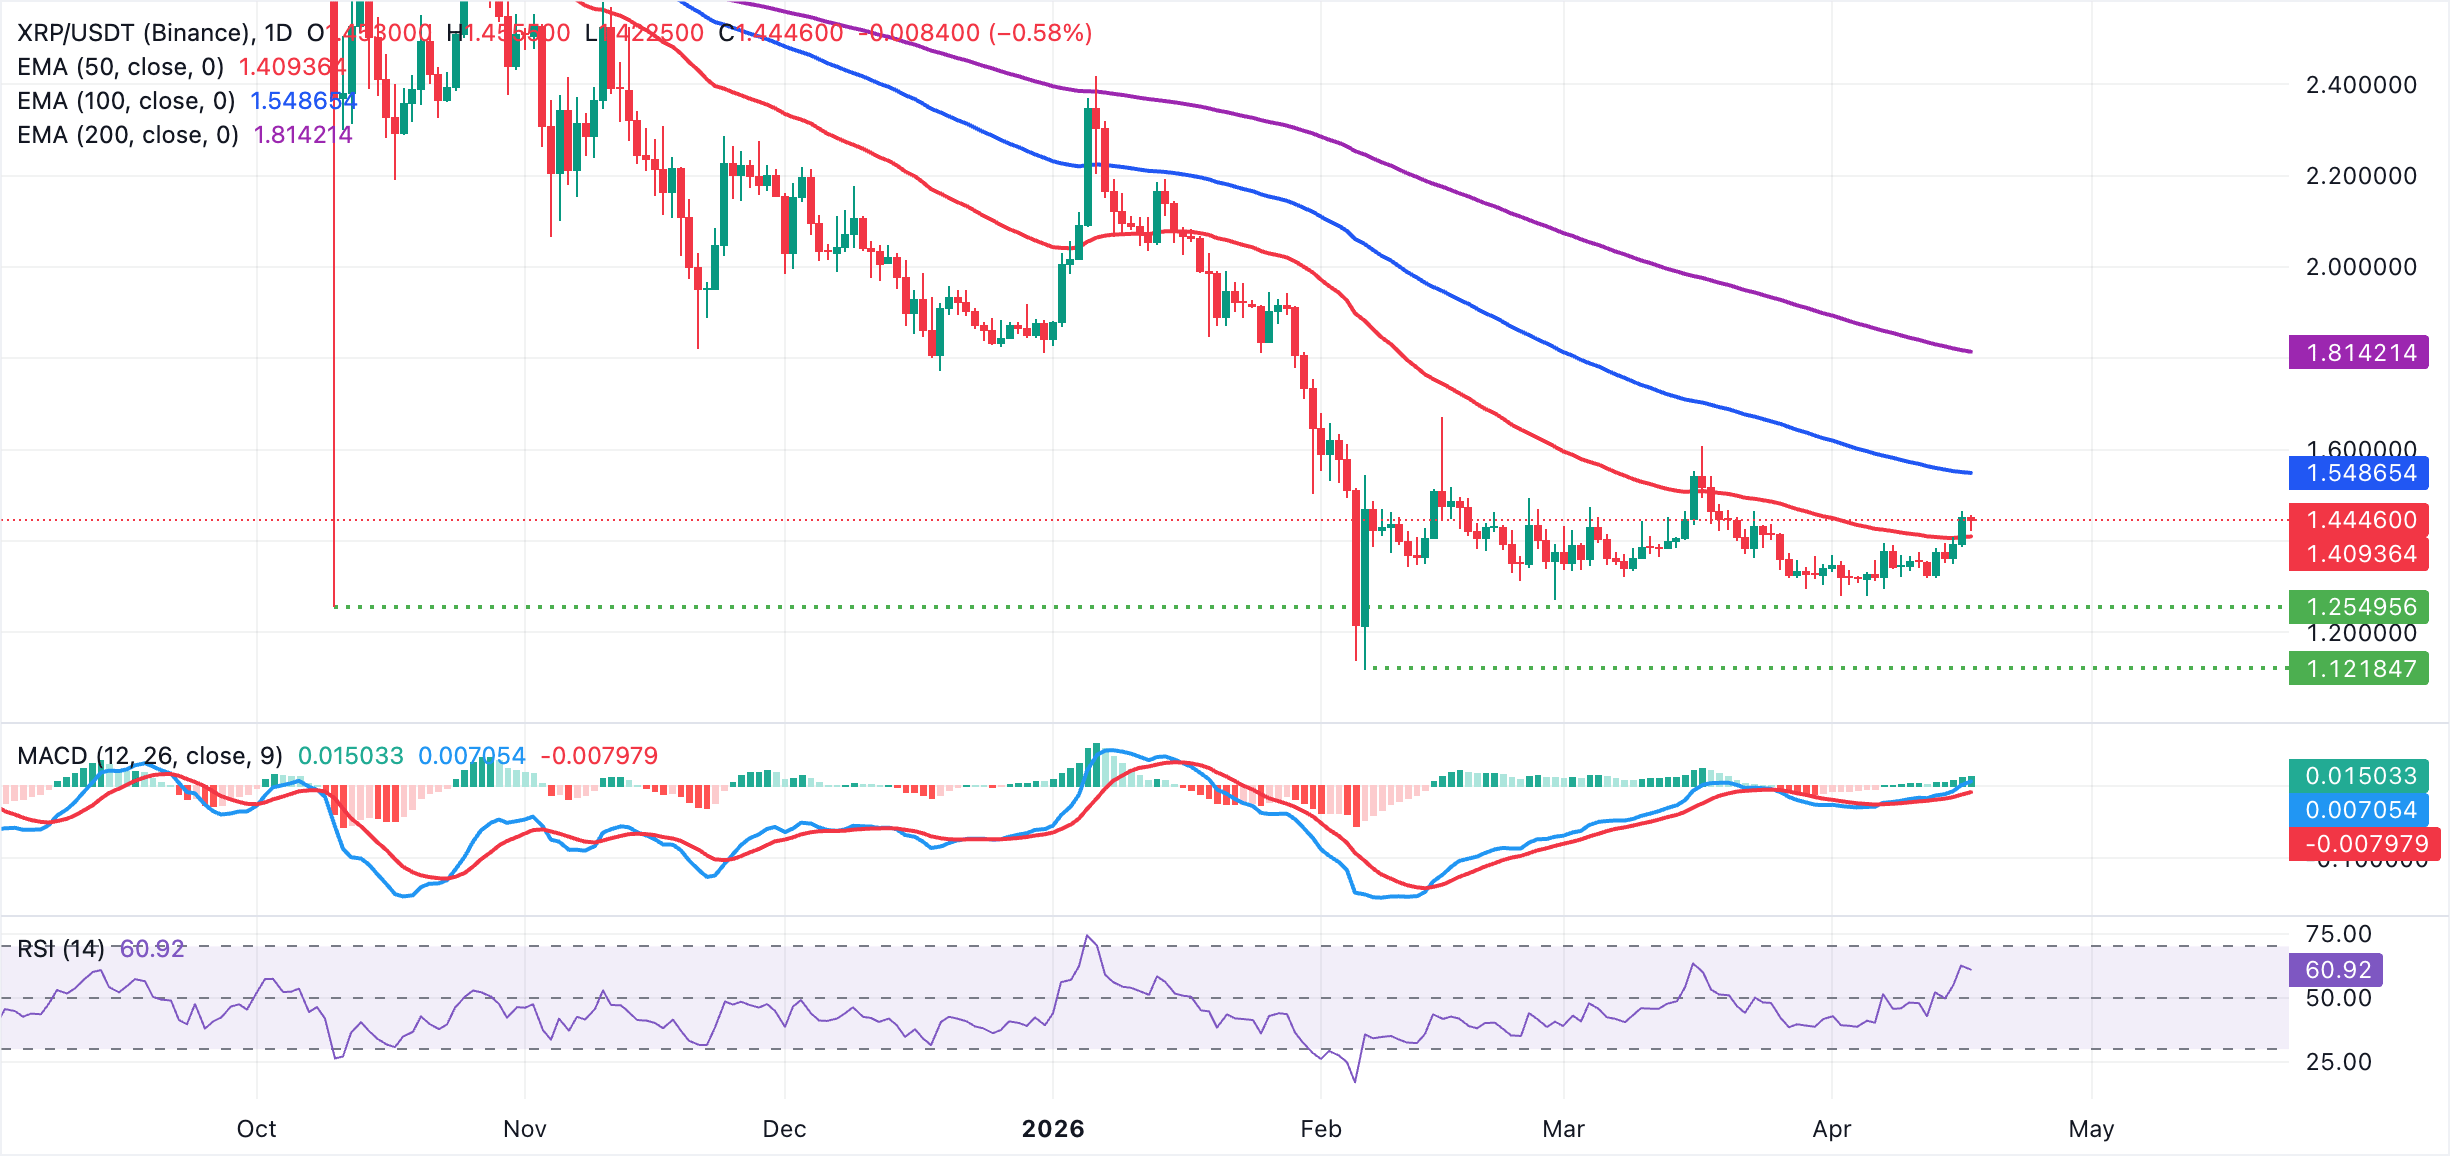
On the downside, initial support is at the 50-day EMA around $1.41, where a break would likely expose a deeper pullback toward the weekly open at $1.32. On the topside, immediate resistance comes at the 100-day EMA near $1.55, with a sustained move above this barrier needed to open the way toward the more formidable 200-day EMA around $1.81.
Open Interest, funding rate FAQs
Higher Open Interest is associated with higher liquidity and new capital inflow to the market. This is considered the equivalent of increase in efficiency and the ongoing trend continues. When Open Interest decreases, it is considered a sign of liquidation in the market, investors are leaving and the overall demand for an asset is on a decline, fueling a bearish sentiment among investors.
Funding fees bridge the difference between spot prices and prices of futures contracts of an asset by increasing liquidation risks faced by traders. A consistently high and positive funding rate implies there is a bullish sentiment among market participants and there is an expectation of a price hike. A consistently negative funding rate for an asset implies a bearish sentiment, indicating that traders expect the cryptocurrency’s price to fall and a bearish trend reversal is likely to occur.
(The technical analysis of this story was written with the help of an AI tool.)

Mais de um milhão de usuários confiam na FXStreet para dados de mercado em tempo real, ferramentas de gráficos, insights de especialistas e notícias de Forex. Seu calendário econômico abrangente e webinars educacionais ajudam os traders a se manterem informados e tomarem decisões calculadas. A FXStreet conta com uma equipe de cerca de 60 profissionais, divididos entre a sede em Barcelona e diversas regiões globais.
Ler mais


