
Crypto Today: Bitcoin, Ethereum, XRP slide as US-Iran war weighs on sentiment
Por John Isige
Atualizado: 26 Mar 2026


ARTIGOS POPULARES

Cryptocurrency prices are edging lower on Thursday, on the 27th day of the United States (US) and Israel's war with Iran. Bitcoin (BTC) is trading below $70,000, extending its decline from $76,000, which was its highest level in March.
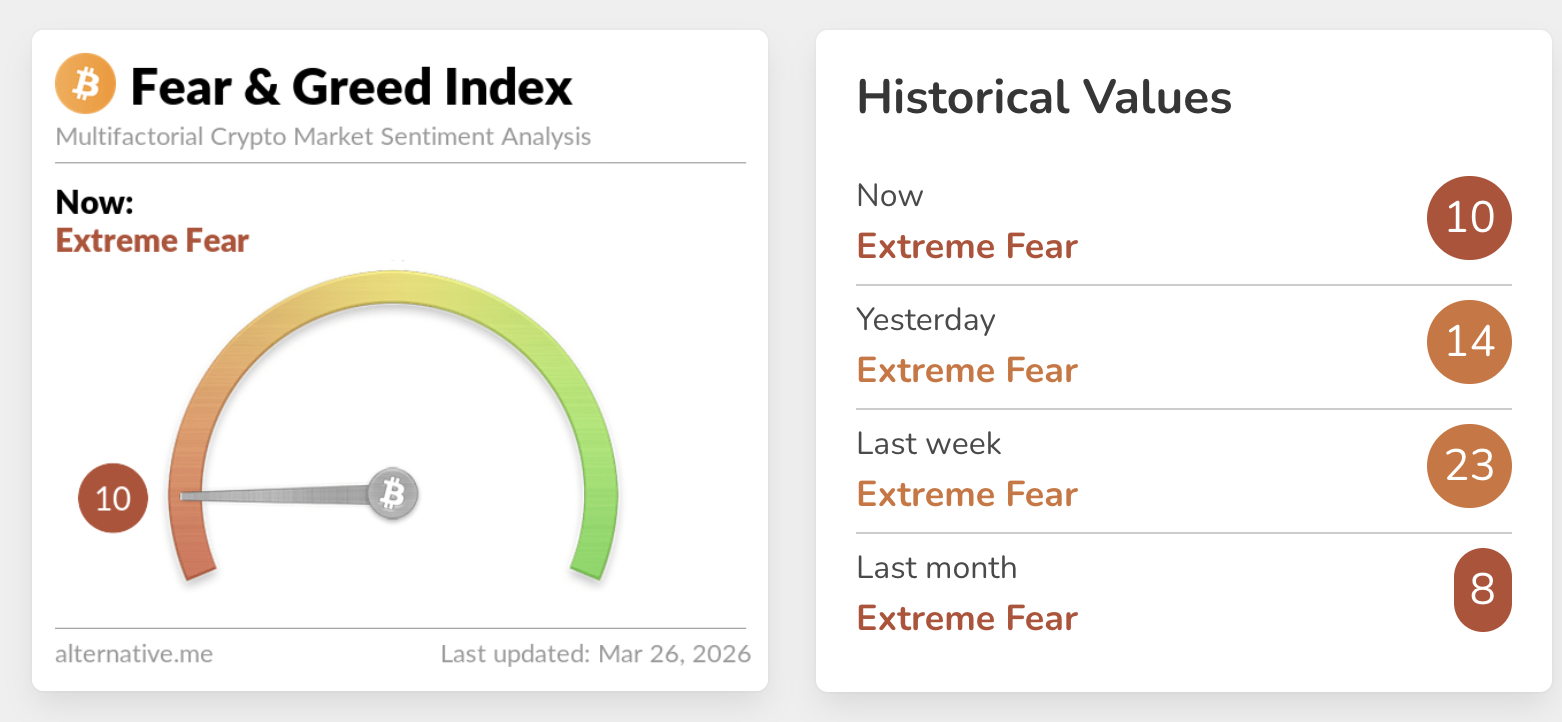
- Bitcoin slides below $70,000 amid a broad sell-off in crypto markets as sentiment remains in extreme fear territory.
- Ethereum falls toward the $2,000–$2,100 support range, reflecting risk-off conditions and ETF outflows.
- XRP edges lower within a wider bearish trend, defined by descending major moving averages.
Cryptocurrency prices are edging lower on Thursday, on the 27th day of the United States (US) and Israel's war with Iran. Bitcoin (BTC) is trading below $70,000, extending its decline from $76,000, which was its highest level in March.
Ethereum (ETH) is also dropping toward a key support range of $2,000-$2,100, weighed down by Middle East war-driven risk-off sentiment. This is evidenced by persistent capital exit from related digital investment products.
Ripple (XRP) similarly paints a grim picture, grinding lower at $1.38 within a weakening technical structure.
Weak sentiment weighs on crypto as Bitcoin, Ethereum and XRP wobble
The war in the Middle East has continued to push global markets to the edge despite reports of ongoing talks between the US and Iran. Higher Oil prices, with West Texas Intermediate (WTI) Crude trading above $92, weigh on sentiment, as central banks brace for a potential inflation spike.
-1774521217476-1774521217491.png)
Sentiment in the cryptocurrency market remains weak as a risk-off mood triggers capital flight. The Crypto Fear & Greed Index holds at 10 on Thursday in the extreme fear territory, down from 14 the previous day.
Ethereum spot Exchange-Traded Funds (ETFs) saw outflows extend for six consecutive days, as investors withdrew approximately $8.5 million on Wednesday. Cumulative inflows stand at $11.66 billion with net assets averaging $12.51 billion. If outflows continue, persistent risk-off sentiment could limit Ethereum’s recovery potential.
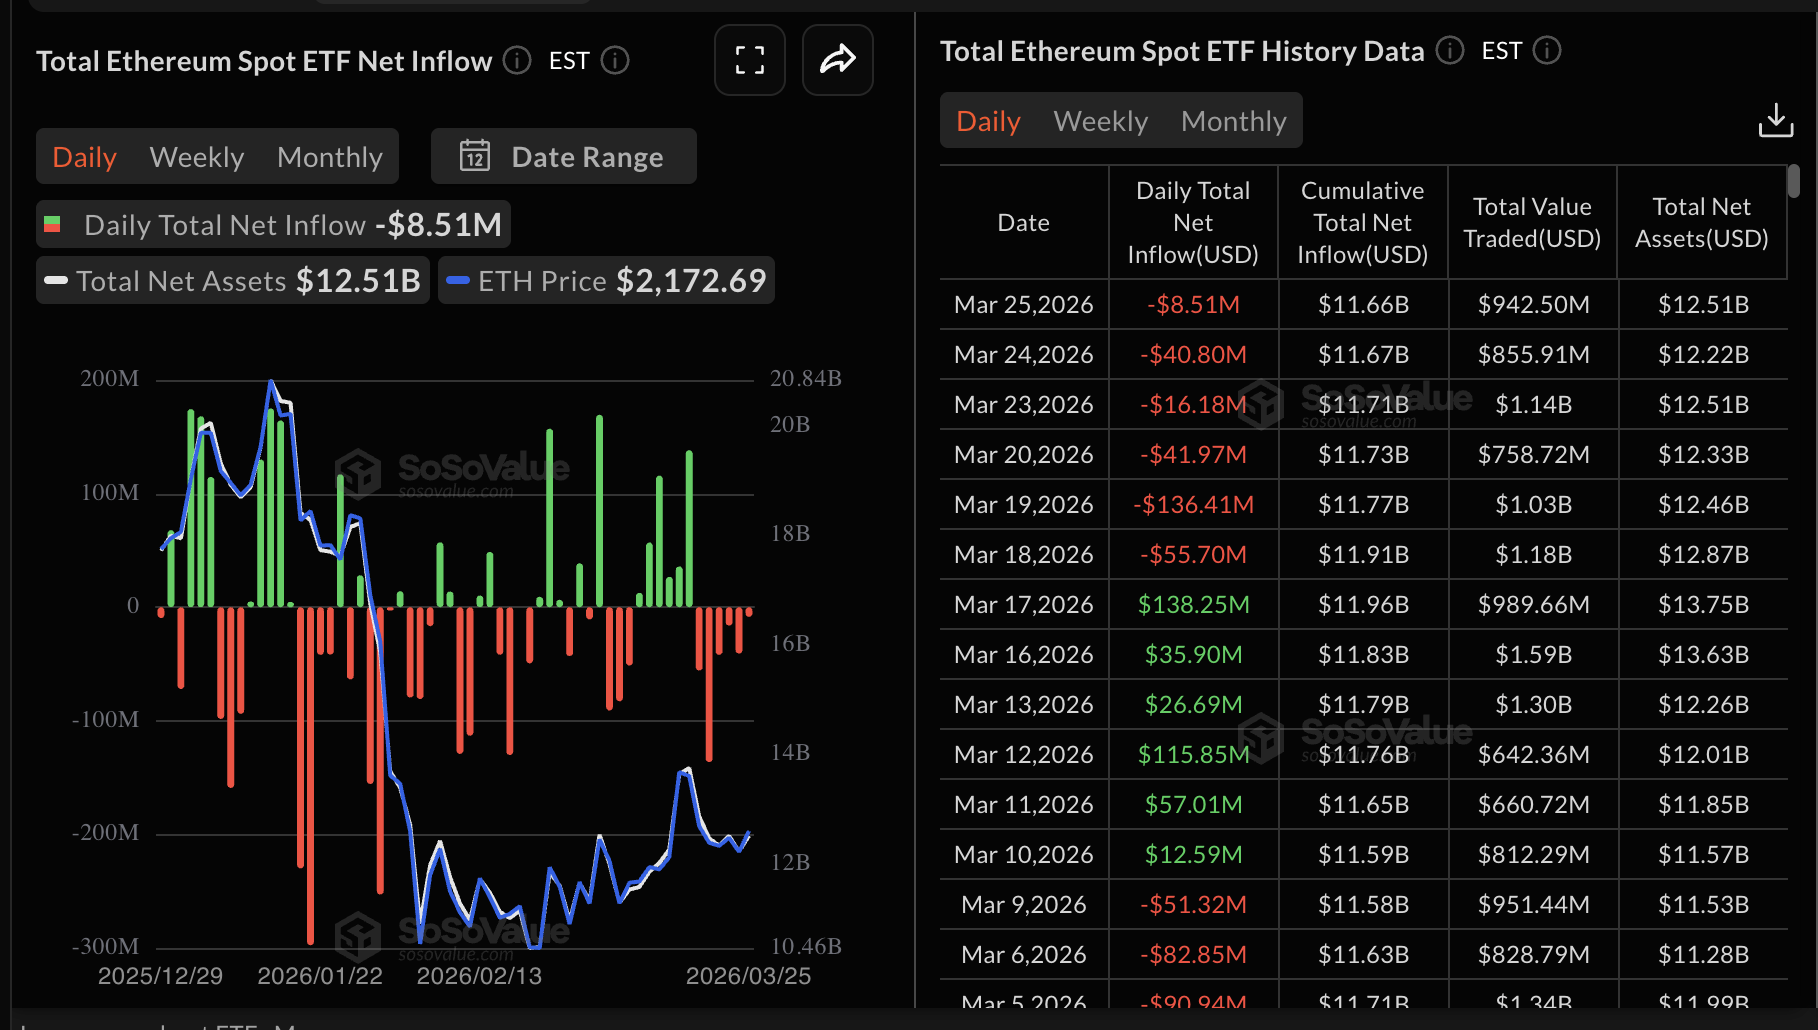
Chart of the day: Bitcoin at risk of extending losses
Bitcoin is trading slightly below $70,000, with its near-term outlook turning mildly bearish. The price appears to be consolidating in a range below the clustered 50-day, 100-day, and 200-day Exponential Moving Averages (EMAs), which sit between roughly $72,000 and $86,000 and cap the broader trend.
The Moving Average Convergence Divergence (MACD) indicator has slipped below its signal line on the daily chart, suggesting fading bullish momentum after the March advance to $76,000. Moreover, the Relative Strength Index (RSI) around 49 on the same chart reinforces this neutral-to-bearish equilibrium, indicating a balance between buyers and sellers rather than an extended sell-off or renewed upper leg.
-1774516153238-1774516153248.png)
Immediate support lies at the recent lows near $67,800, where a break would expose further downside toward the $65,800–$65,000 area as the next bearish target. Below that, deeper pullbacks could open the way to the mid-March base around $63,000. On the upside, initial resistance lies at the psychological $70,500 level, followed by the 50-day EMA at $72,081. A daily close above this level would be needed to neutralize the current soft tone and refocus attention on the March high at $76,000.
Altcoins technical outlook: Ethereum and XRP drop as headwinds intensify
Ethereum is extending its decline, aiming for the support range between $2,000 and $2,100, broadly aligning with its position below the clustered 50-day, 100-day, and 200-day EMAs, which all hover well above $2,193 and frame an intact wider downtrend.
The MACD line has rolled over from recent highs on the daily chart, while green histogram bars fade, suggesting waning bullish momentum after the early-month advance to $2,386. Moreover, the RSI around 50 on the same chart underscores this balance of forces, indicating neither side has firm control and keeping the focus on how the spot price behaves around nearby horizontal levels.
Immediate resistance appears at the 50-day EMA around $2,193, where sellers capped the latest push and where failure to regain traction would keep rallies short-lived. A subsequent barrier is seen in the $2,350–$2,385 area, which coincides with the March high.
Initial support aligns with the $2,000–$2,100 region, guarding last week’s reaction lows. A sustained break below this area would expose the $1,980–$1,930 band, where previous congestion and dip-buying emerged.
-1774516276718-1774516276719.png)
As for XRP, sellers are largely in control, pushing the price downward to $1.38 at the time of writing on Thursday. The near-term bias is mildly bearish as XRP extends the pullback from the recent spike around $1.54 and holds well below the downward-curving 50-day, 100-day and 200-day EMAs, which cluster above $1.48 and maintain a broader downward trend.
The rising support trendline from $1.12 remains intact but is being tested around $1.38, suggesting fading buying interest after the sharp mid-month advance. Similarly, the MACD indicator has slipped marginally below its signal line on the daily chart, confirming waning bullish momentum. The RSI around 44 remains below the 50 midline on the same chart, reinforcing a softening tone rather than outright selling pressure.
-1774517030347-1774517030354.png)
Initial resistance appears at $1.43, where recent rebounds stalled, followed by stronger supply near the 50-day EMA at $1.48 and then the $1.54 area. Above that area, the 100-day EMA at $1.66 would come within the scope. On the downside, immediate support lies in the trendline region around $1.38, with a clear break lower opening the door toward $1.35 and then $1.32 as the next downside levels.
Crypto ETF FAQs
An Exchange-Traded Fund (ETF) is an investment vehicle or an index that tracks the price of an underlying asset. ETFs can not only track a single asset, but a group of assets and sectors. For example, a Bitcoin ETF tracks Bitcoin’s price. ETF is a tool used by investors to gain exposure to a certain asset.
Yes. The first Bitcoin futures ETF in the US was approved by the US Securities & Exchange Commission in October 2021. A total of seven Bitcoin futures ETFs have been approved, with more than 20 still waiting for the regulator’s permission. The SEC says that the cryptocurrency industry is new and subject to manipulation, which is why it has been delaying crypto-related futures ETFs for the last few years.
Yes. The SEC approved in January 2024 the listing and trading of several Bitcoin spot Exchange-Traded Funds, opening the door to institutional capital and mainstream investors to trade the main crypto currency. The decision was hailed by the industry as a game changer.
The main advantage of crypto ETFs is the possibility of gaining exposure to a cryptocurrency without ownership, reducing the risk and cost of holding the asset. Other pros are a lower learning curve and higher security for investors since ETFs take charge of securing the underlying asset holdings. As for the main drawbacks, the main one is that as an investor you can’t have direct ownership of the asset, or, as they say in crypto, “not your keys, not your coins.” Other disadvantages are higher costs associated with holding crypto since ETFs charge fees for active management. Finally, even though investing in ETFs reduces the risk of holding an asset, price swings in the underlying cryptocurrency are likely to be reflected in the investment vehicle too.
(The technical analysis of this story was written with the help of an AI tool.)

Mais de um milhão de usuários confiam na FXStreet para dados de mercado em tempo real, ferramentas de gráficos, insights de especialistas e notícias de Forex. Seu calendário econômico abrangente e webinars educacionais ajudam os traders a se manterem informados e tomarem decisões calculadas. A FXStreet conta com uma equipe de cerca de 60 profissionais, divididos entre a sede em Barcelona e diversas regiões globais.
Ler mais


