
Crypto Today: Bitcoin extends recovery above $66K as Ethereum and XRP lose momentum
Por John Isige
Atualizado: 16 Jun 2026


ARTIGOS POPULARES
Bitcoin (BTC) retains a near-term bullish bias, trading above $66,000 at the time of writing on Tuesday.
- Bitcoin holds above $66,000, seemingly poised to extend its rebound, supported by growing retail demand.
- Ethereum struggles near the $1,800 short-term supply range despite a strengthening derivatives market.
- XRP recovery slows after encountering the 50-day EMA resistance but holds above the mid-Bollinger Band.
Bitcoin (BTC) retains a near-term bullish bias, trading above $66,000 at the time of writing on Tuesday. The slight bullish outlook comes amid easing geopolitical tensions in the Middle East, with the United States (US) and Iran reportedly having signed a virtual peace agreement to reopen the Strait of Hormuz and end the blockade of Iranian ports.
Altcoins, including Ethereum (ETH) and Ripple (XRP), hold above recently reclaimed key support levels at $1,700 and $1.23, respectively. However, their upside appears capped after encountering supply pockets at $1,800 for Ethereum and near $1.23 for XRP.
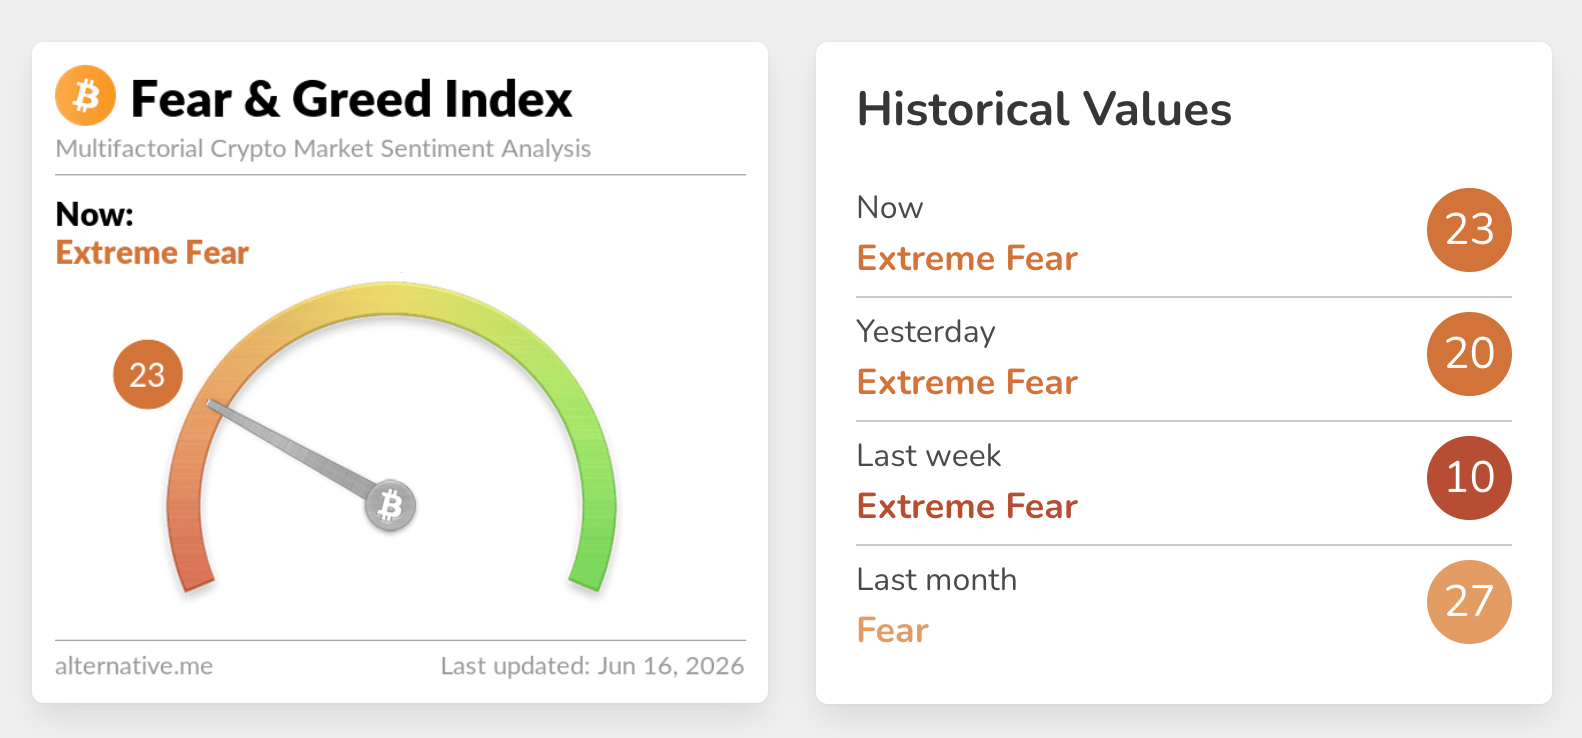
Sentiment in the broader crypto market is gradually improving, as reflected in the Fear & Greed Index at 23 in the Extreme Fear territory on Tuesday, up from 20 the day before and above last week’s average of 10. This increase indicates that appetite for risk assets is slowly returning, as investors increase exposure.
Derivatives gaining momentum
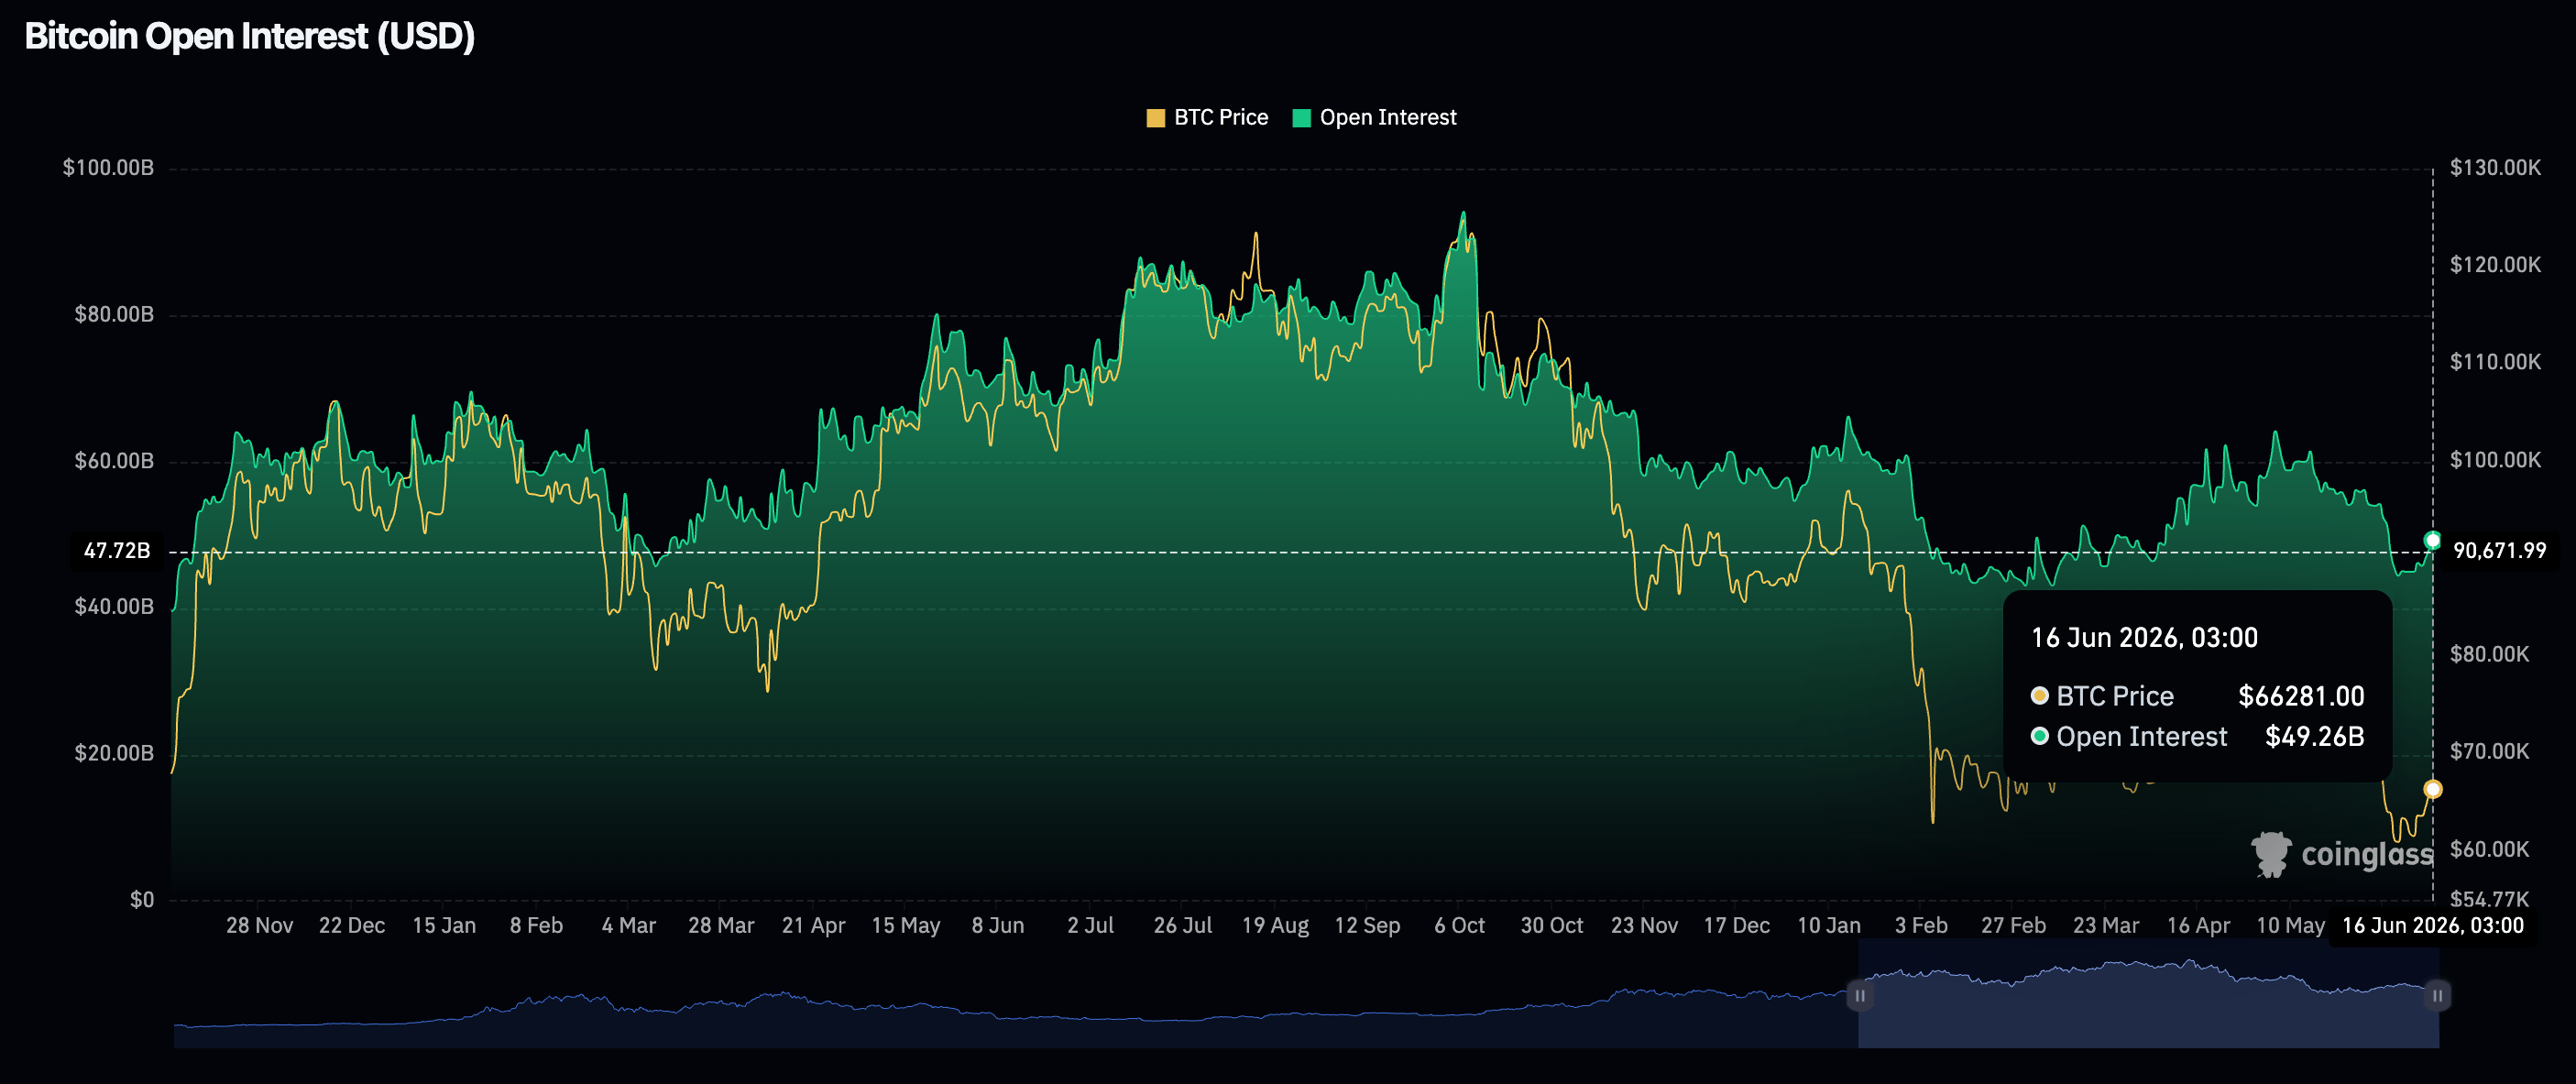
Retail demand for perpetual futures contracts and options is steadily rising, as evidenced by Bitcoin’s Open Interest (OI), which averages at $49.26 billion on Tuesday, up from $48.16 billion the previous day and $46.20 billion on Friday. A strengthening derivatives market contributes to a sustained uptrend, as investors gain confidence and open new positions.
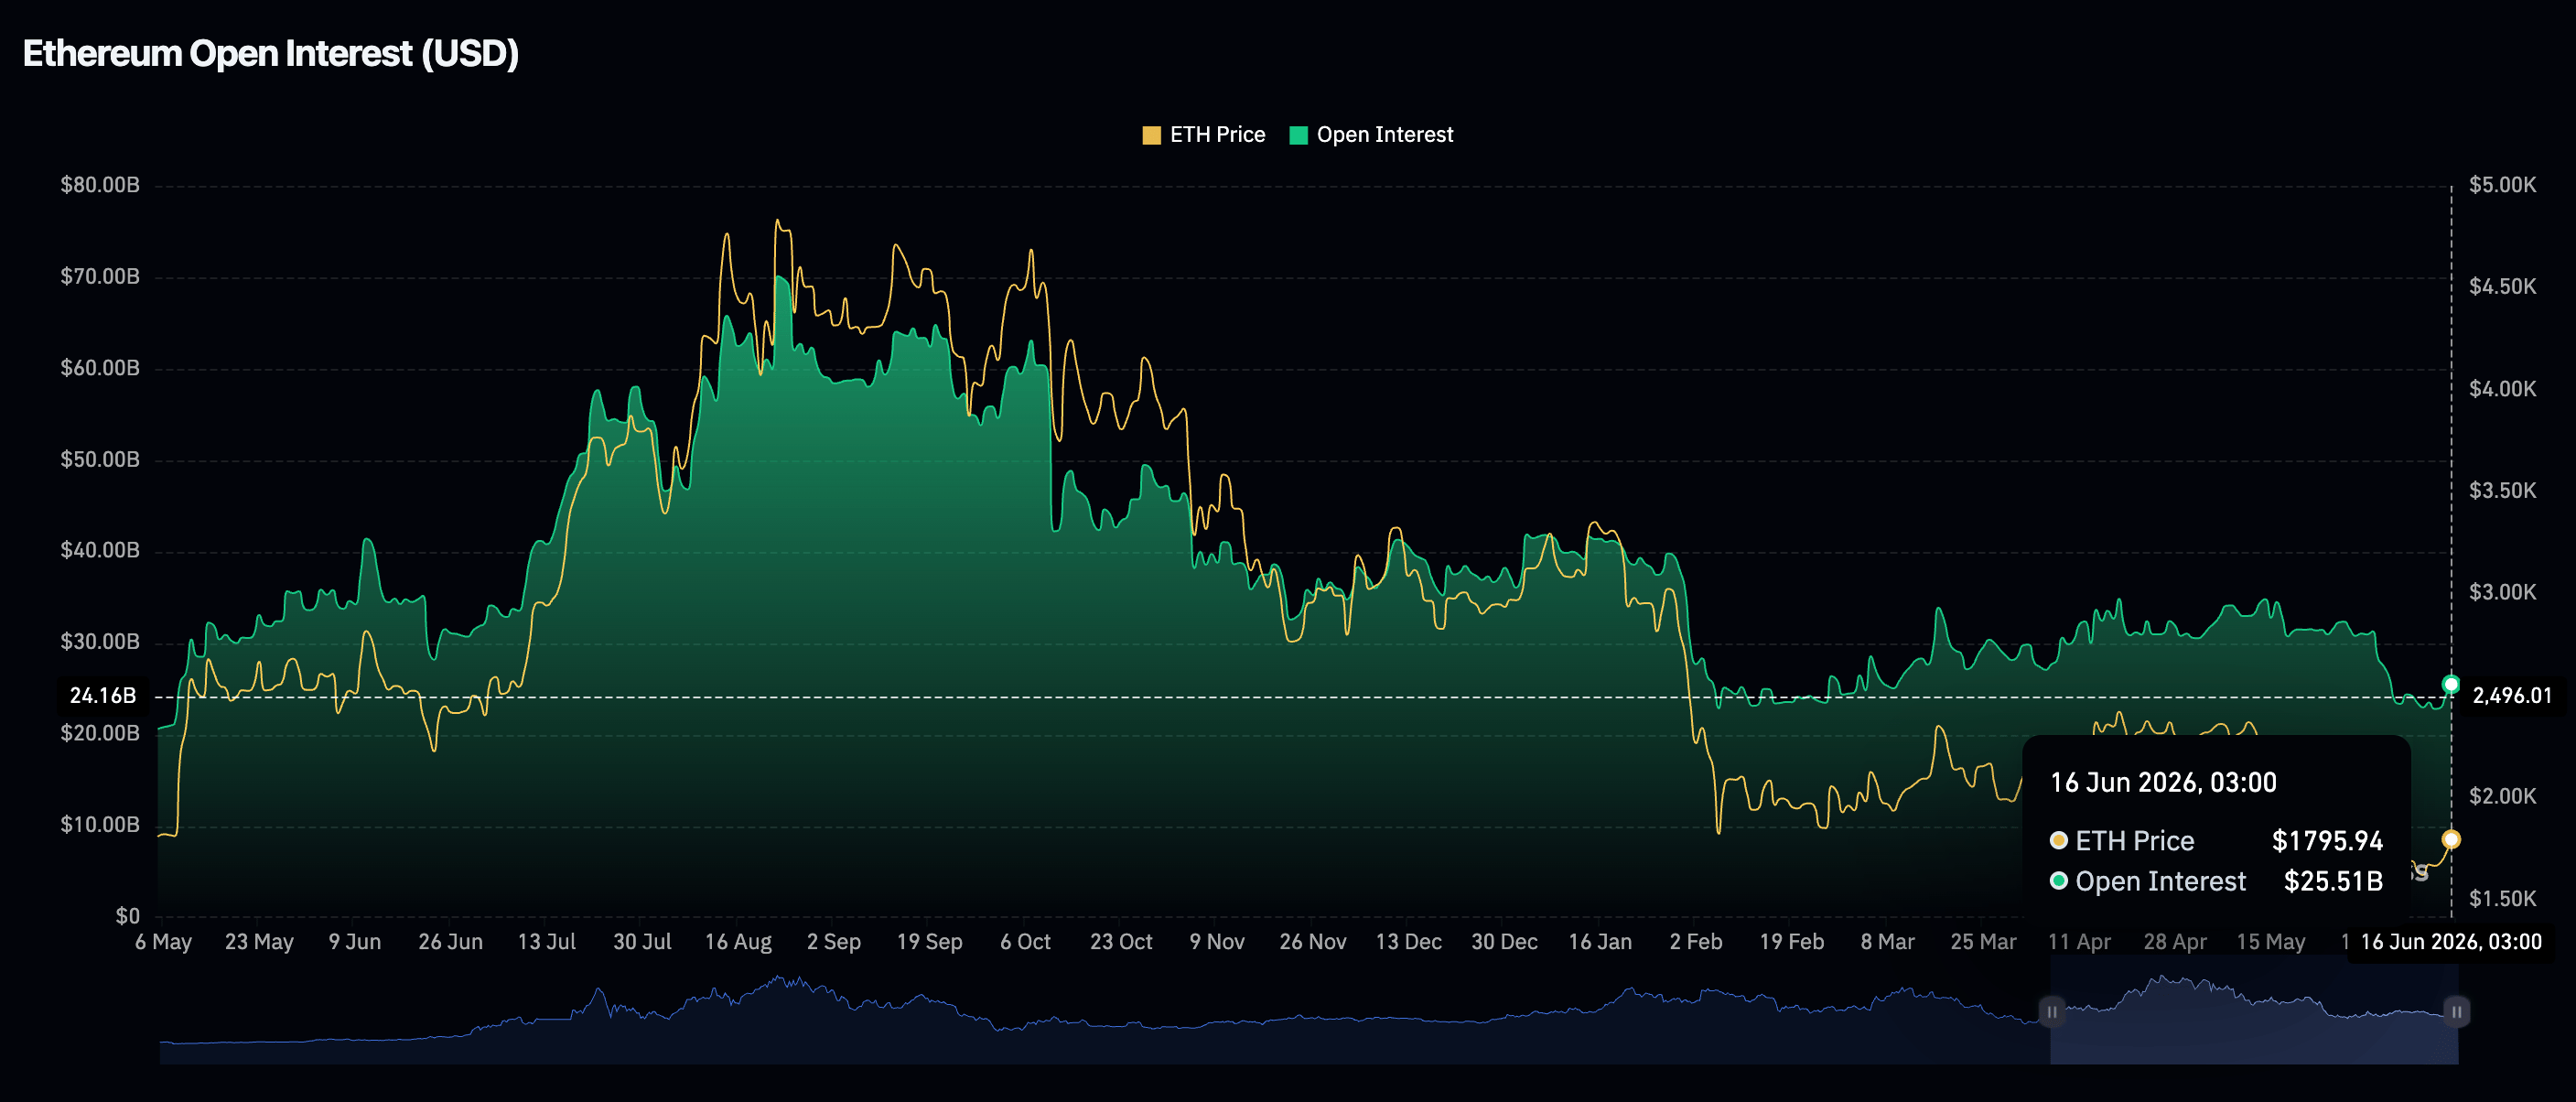
Ethereum derivatives uphold a slight uptrend, with futures OI reaching $25.51 billion on Tuesday, up from $24.42 billion the day before and $23.51 billion on Friday. A sustained recovery in ETH's price requires a strong derivatives market.
The XRP futures OI is similarly in a gradual uptrend, standing at $2.77 billion on Tuesday, up from $2.54 billion the day before. CoinGlass data show a direct correlation between the derivatives market and the XRP price, which increases the odds of an extended rebound as long as retail demand continues to grow.

Price analysis: Bitcoin upholds gradual rebound
Bitcoin trades at $66,356, extending its rebound above $66,000 as its technical outlook gradually improves. The Parabolic SAR trails well beneath spot near $60,943, hinting that the latest bounce has tentative backing, while the Moving Average Convergence Divergence (MACD) histogram stands above the zero line on the daily chart, suggesting growing bullish momentum. Moreover, the Relative Strength Index (RSI) lingers below the midline around 44 on the same chart, as buying pressure remains modest.
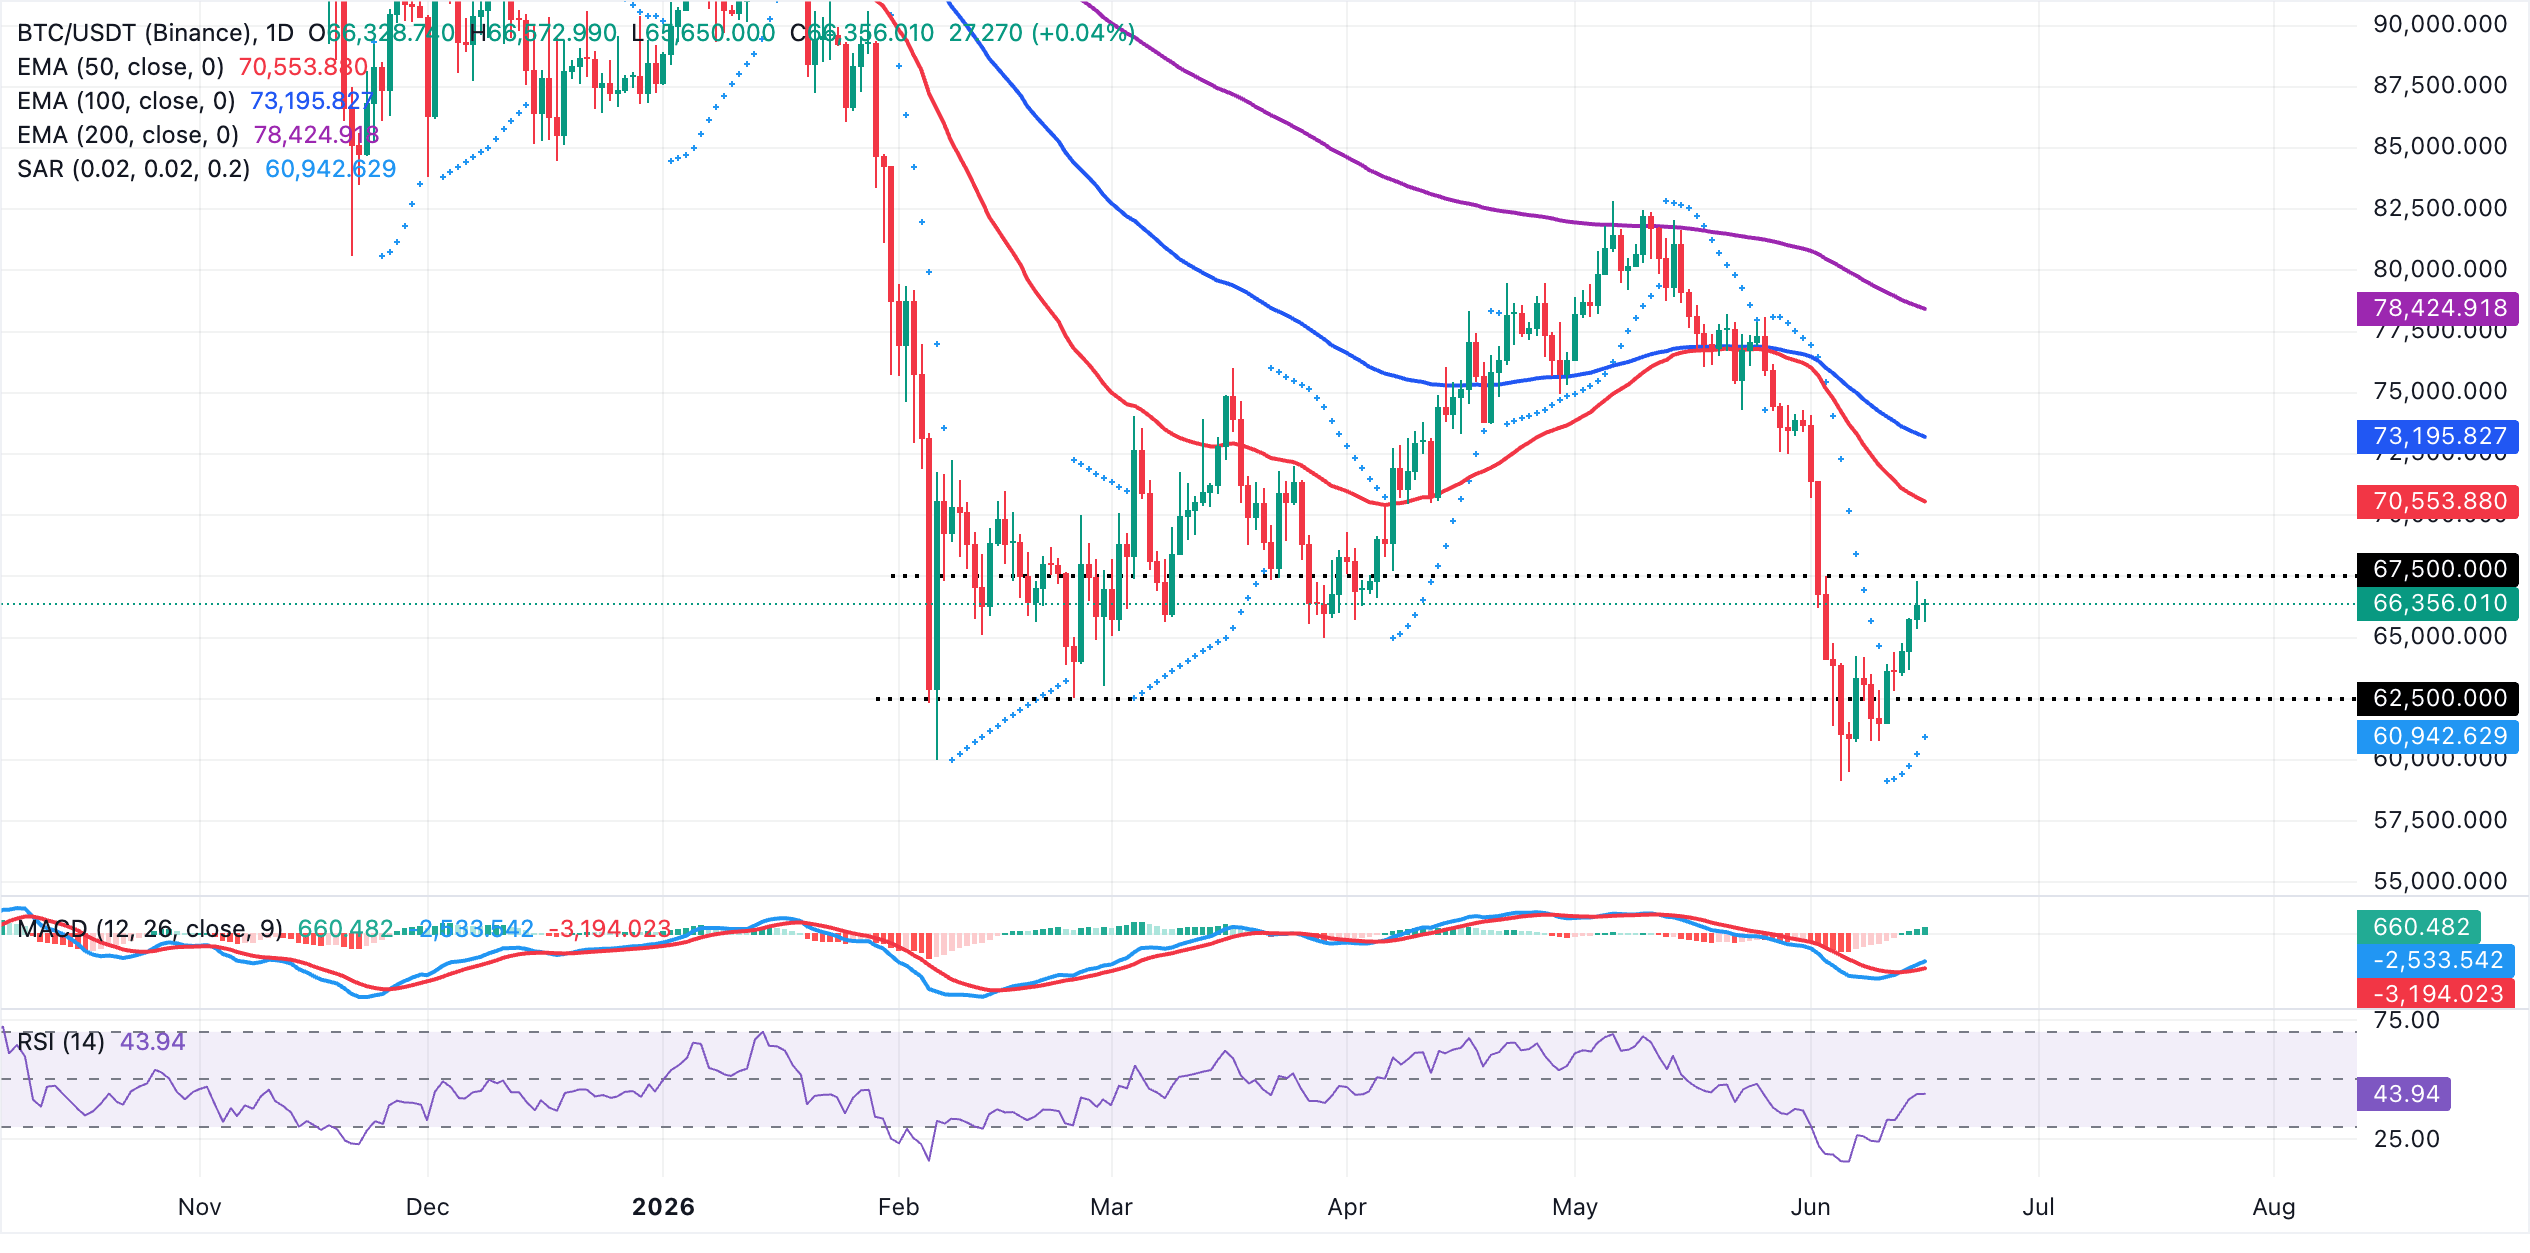
On the topside, immediate resistance is seen at the 50-day Exponential Moving Average (EMA) at $70,554, followed by the 100-day EMA at $73,196, with the 200-day EMA at $78,425 reinforcing a broader cap unless buyers can extend the recovery.
On the flip side, the Parabolic SAR level near $60,943 forms the first notable layer of support, and a break back toward that area would undermine the current rebound and reopen the path to deeper corrective losses.
Altcoins technical outlook: Ethereum and XRP hold support as upside remains limited
Ethereum trades near $1,775, keeping a bearish near-term bias following a sudden rejection around $1,800. This supply range broke three consecutive days of gains. The spot price holds well below the 50-day, 100-day and 200-day EMAs at $1,961, $2,117 and $2,378 respectively.
Still, ETH's rebound from sub-$1,600 levels is underpinned by the Parabolic SAR support near $1,555, as momentum slowly improves. The MACD histogram on the daily chart has turned positive and the RSI has recovered toward the mid-40s, hinting at a corrective bounce within a still-dominant downside structure.
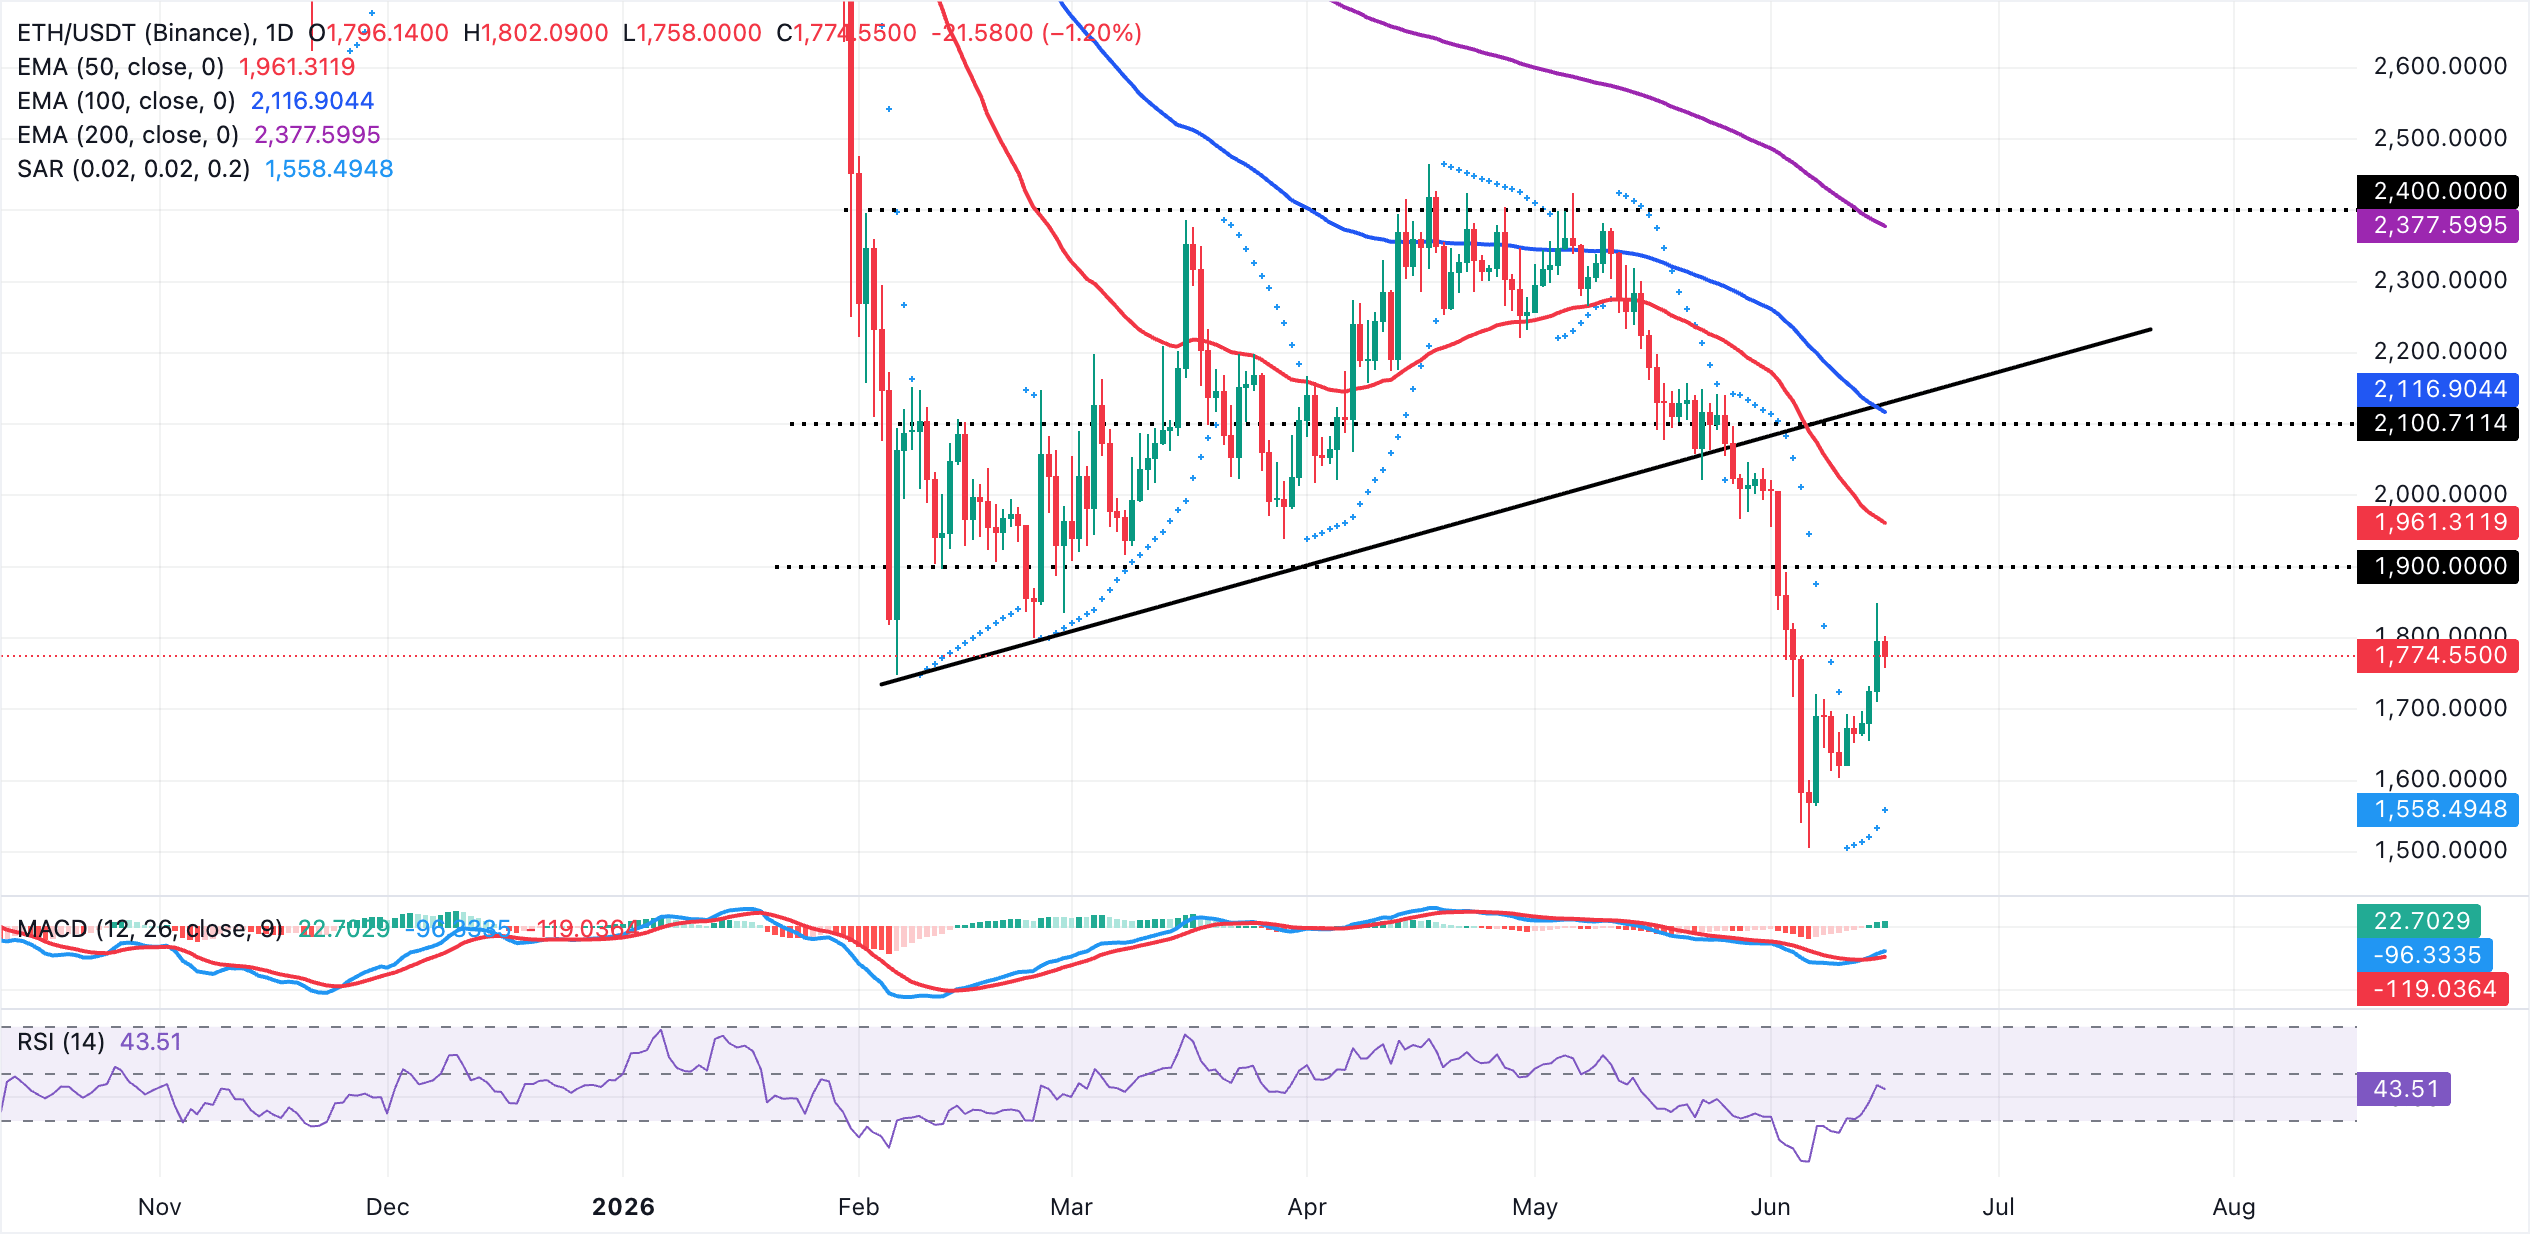
Notably, initial resistance lies at the 50-day EMA around $1,961. A daily close above this barrier would expose the next cap at the 100-day EMA near $2,117, ahead of the more distant 200-day EMA at $2,378 that defines the broader bearish ceiling.
On the downside, the first key support is provided by the Parabolic SAR level at $1,558, where failure would reopen the path toward the recent lows near $1,500.
XRP, on the other hand, trades near $1.24 amid signs of the rebound stalling below the 50-day EMA at $1.28. Nonetheless, the Bollinger Bands show price standing above the mid-line support around $1.20 while the MACD histogram has turned positive on the daily chart.
At the same time, RSI hovers near 51 on the same daily chart, hinting at improving but still tentative bullish momentum within a structurally pressured market.
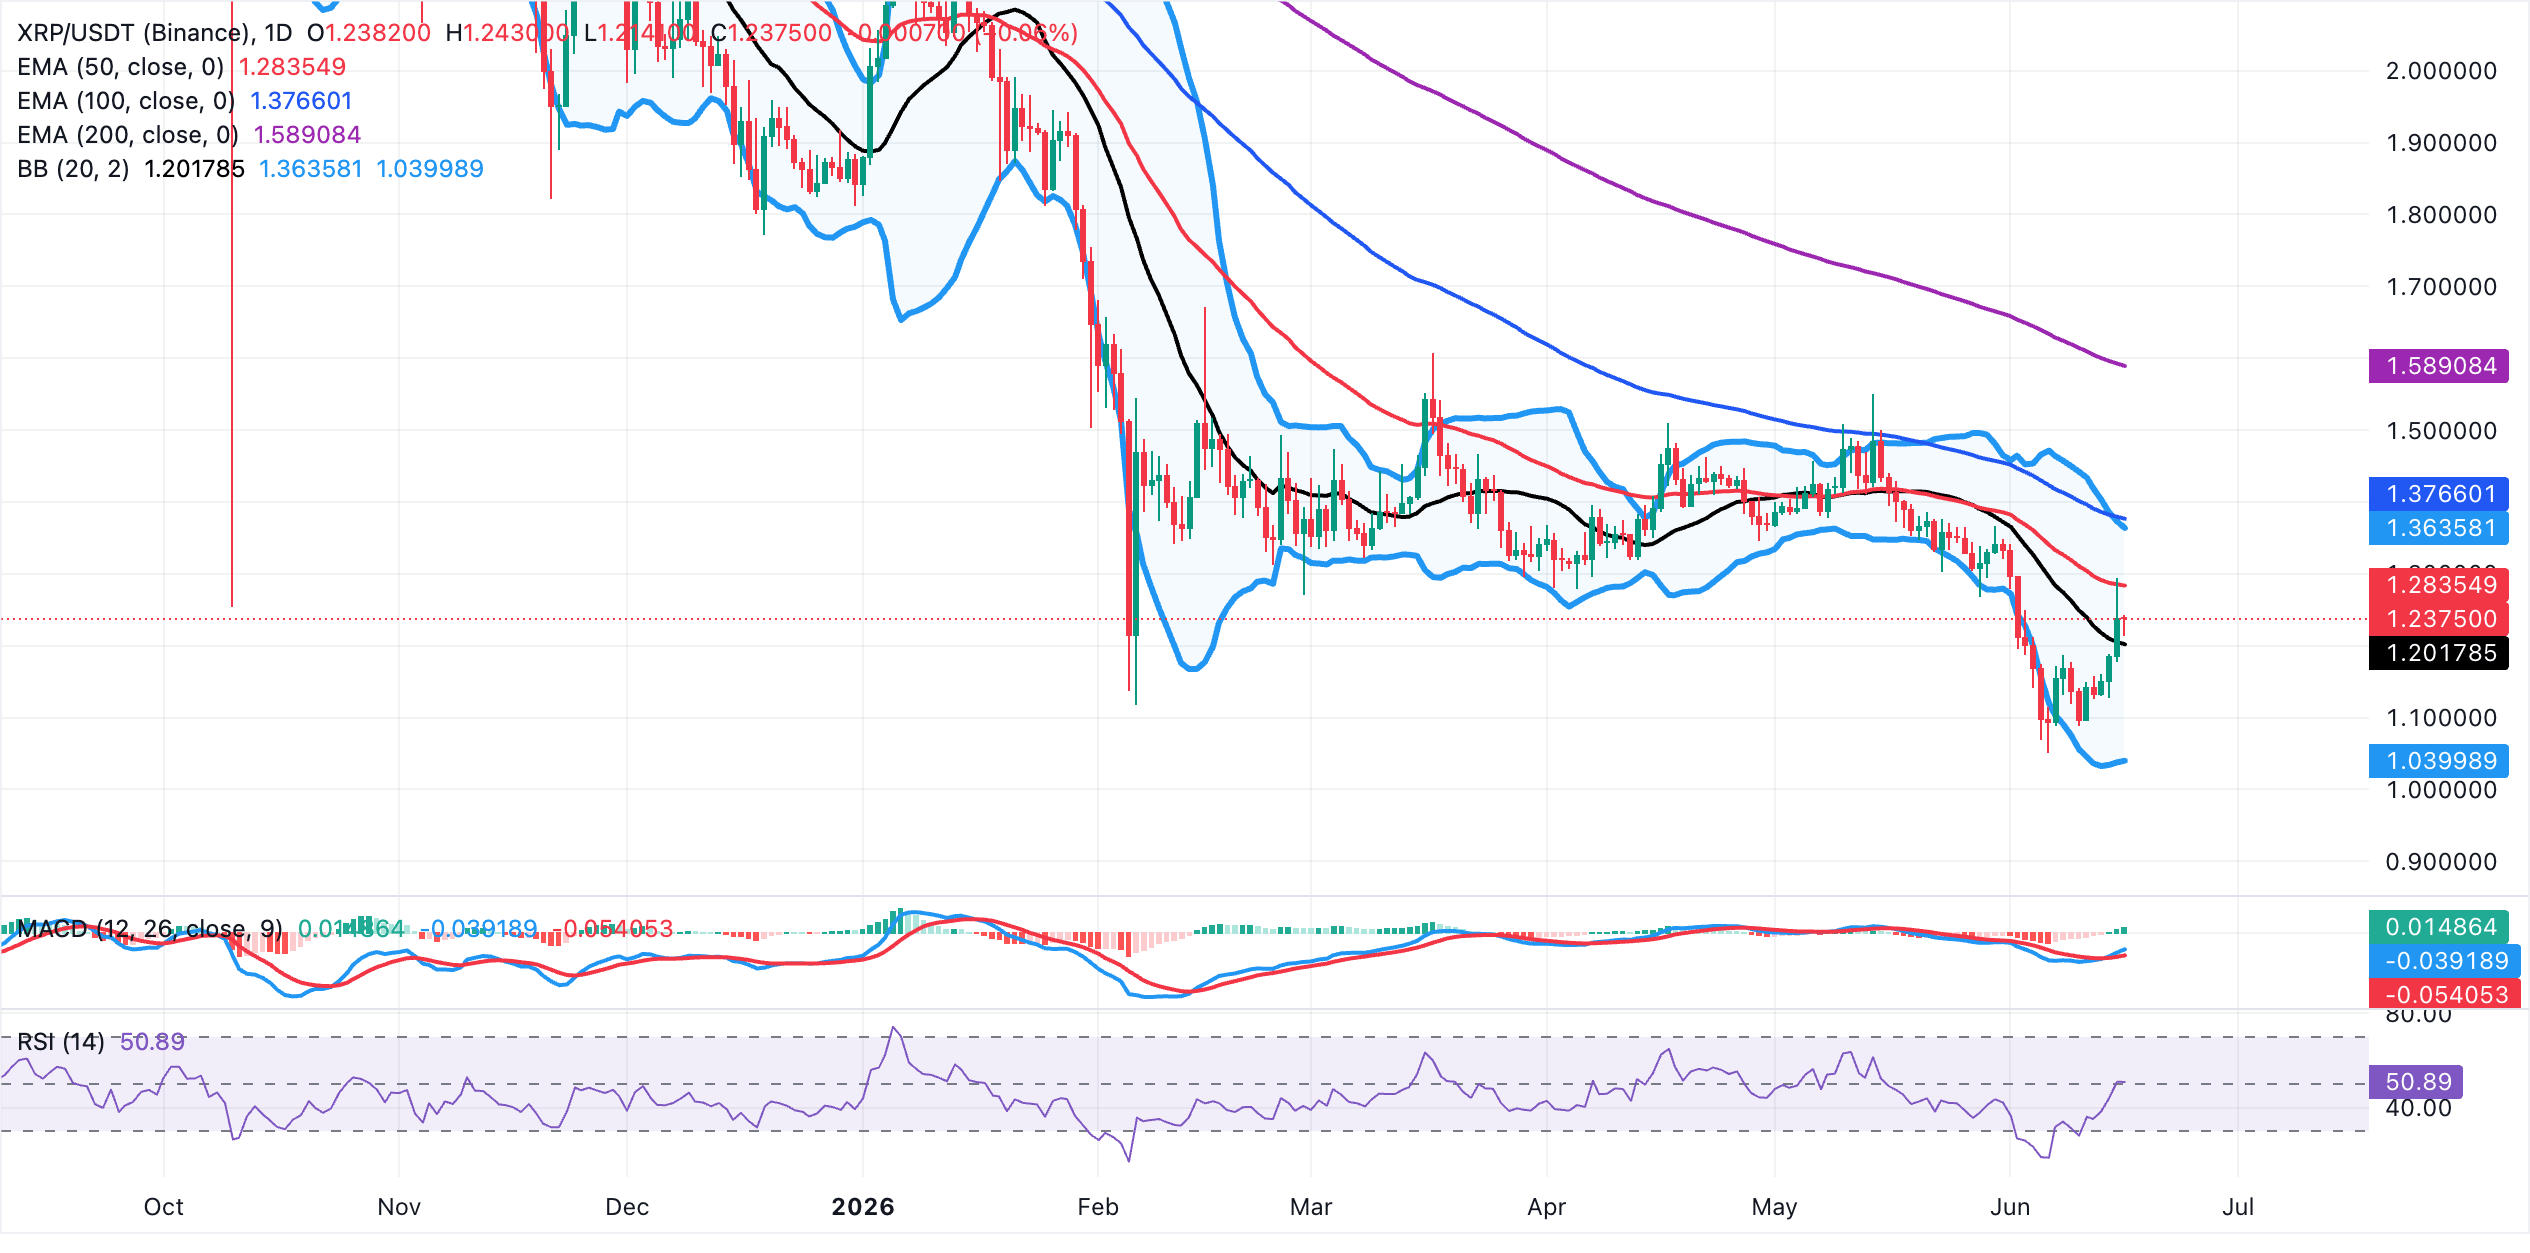
On the topside, initial resistance lies at the 50-day EMA near $1.28, followed by the Bollinger upper band around $1.36, with the 100-day EMA at roughly $1.38 and the distant 200-day EMA near $1.59 reinforcing a broader supply zone.
Looking down, immediate support emerges at the Bollinger middle band around $1.20, ahead of the lower band near $1.04. Failure to hold above these levels would reopen the path toward deeper retracement below the psychological $1.00 demand area.
(The technical analysis of this story was written with the help of an AI tool.)
Open Interest, funding rate FAQs
Higher Open Interest is associated with higher liquidity and new capital inflow to the market. This is considered the equivalent of increase in efficiency and the ongoing trend continues. When Open Interest decreases, it is considered a sign of liquidation in the market, investors are leaving and the overall demand for an asset is on a decline, fueling a bearish sentiment among investors.
Funding fees bridge the difference between spot prices and prices of futures contracts of an asset by increasing liquidation risks faced by traders. A consistently high and positive funding rate implies there is a bullish sentiment among market participants and there is an expectation of a price hike. A consistently negative funding rate for an asset implies a bearish sentiment, indicating that traders expect the cryptocurrency’s price to fall and a bearish trend reversal is likely to occur.

Mais de um milhão de usuários confiam na FXStreet para dados de mercado em tempo real, ferramentas de gráficos, insights de especialistas e notícias de Forex. Seu calendário econômico abrangente e webinars educacionais ajudam os traders a se manterem informados e tomarem decisões calculadas. A FXStreet conta com uma equipe de cerca de 60 profissionais, divididos entre a sede em Barcelona e diversas regiões globais.
Ler mais


