
Crypto Today: Bitcoin pares losses, Ethereum and XRP drift lower as Middle East conflict pressures risk assets
Por John Isige
Data de Publicação: 2 Mar 2026 | Data de Modificação: 2 Mar 2026


ARTIGOS POPULARES

Bitcoin (BTC), Ethereum (ETH) and Ripple (XRP) remain on edge as the Israel-US war on Iran risk-off sentiment. The Crypto King trades above $66,000 at the time of writing on Monday, but is struggling to break through the seller congestion around $67,000.
- Bitcoin holds above $66,000, with its upside limited to around $67,000 as the US-Iran war weighs.
- Ethereum declines for the second consecutive day, reflecting risk-off sentiment across the crypto market.
- XRP hovers well below major moving averages, weighed down by fading retail demand.
Bitcoin (BTC), Ethereum (ETH) and Ripple (XRP) remain on edge as the Israel-US war on Iran risk-off sentiment. The Crypto King trades above $66,000 at the time of writing on Monday, but is struggling to break through the seller congestion around $67,000.
Ethereum and XRP are extending their downward trajectory while holding above key support at $1,900 and $1.33, respectively.
Meanwhile, the conflict in the Middle East escalated sharply after the United States (US) and Israel launched strikes on Iran on Saturday, killing the country’s Supreme Leader Ali Khamenei.
Iran’s response to the attack has seen many Middle East nations caught up in the conflict, including the United Arab Emirates (UAE), Kuwait, Iraq, Bahrain, Qatar, Saudi Arabia and Jordan, among others. A recent report by Reuters indicates that Iran has widened the conflict by also striking Lebanon.
Global markets remain on edge as fears mount that the conflict could disrupt international trade, particularly crude Oil prices. While crypto prices haven't collapsed amid the current wave of risk-off sentiment, these are in a high-stakes balancing act as reflected by the extended weakness in the derivatives market.
Muted retail activity limits Bitcoin, Ethereum and XRP recovery potential
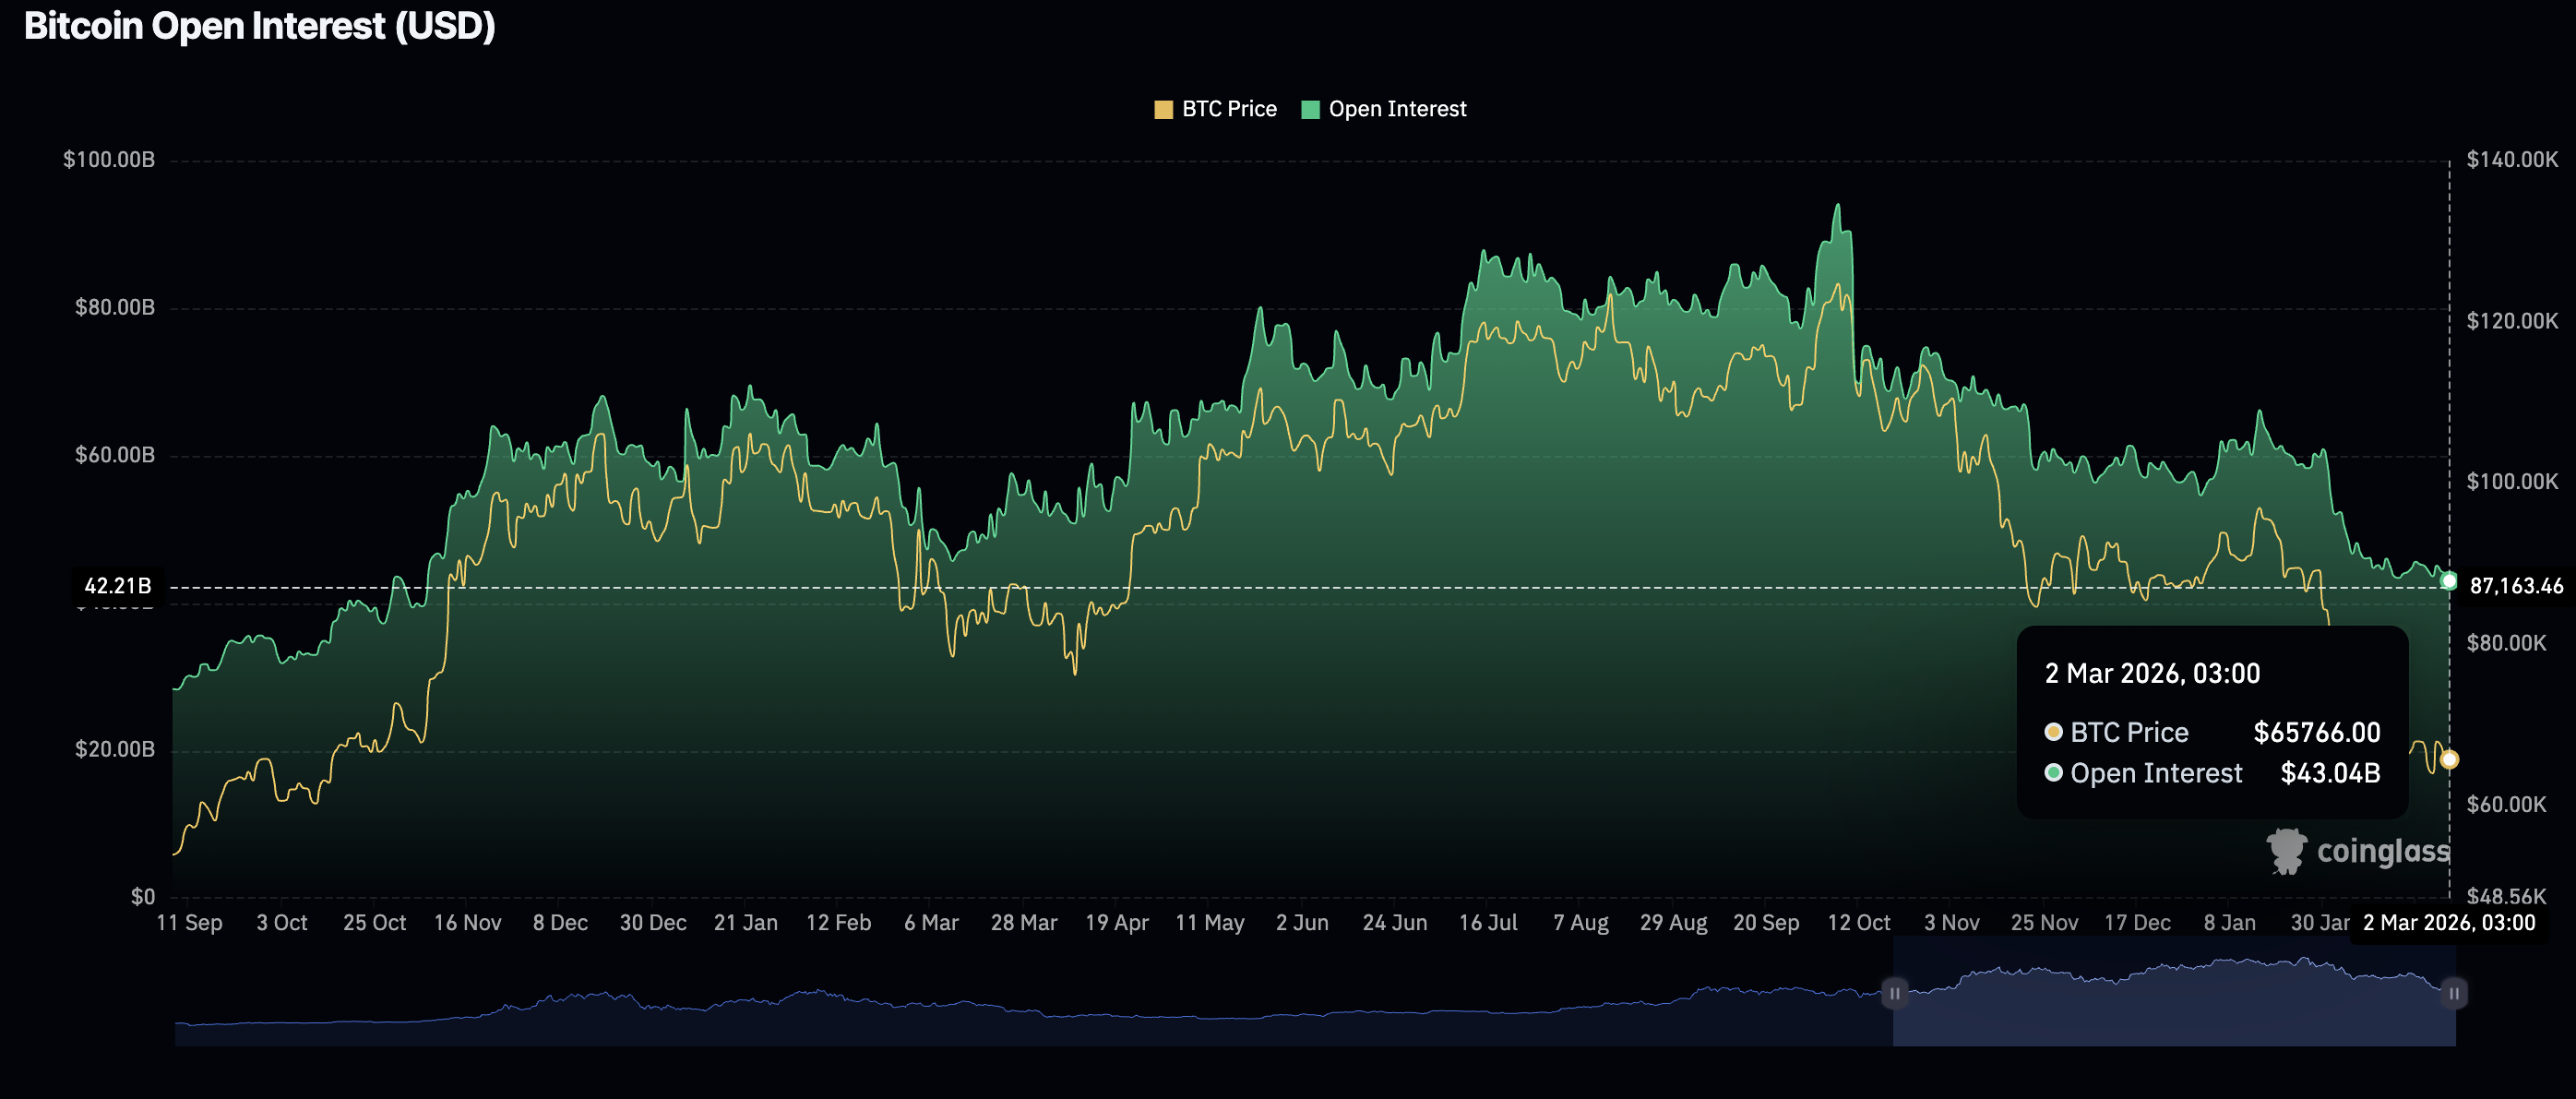
Investors are navigating high volatility and geopolitical and macroeconomic uncertainty, which generally don't favour crypto. Bitcoin’s futures Open Interest (OI) fell to $43 billion on Monday from $44 billion the previous day. This is the lowest level of OI since November 2024, underscoring the declining retail investor interest, which peaked at approximately $94 billion in October.
An extended decline in OI would align with the narrative that investors lack confidence in Bitcoin’s ability to sustain a short-term recovery, hence their willingness to close positions rather than open new ones.
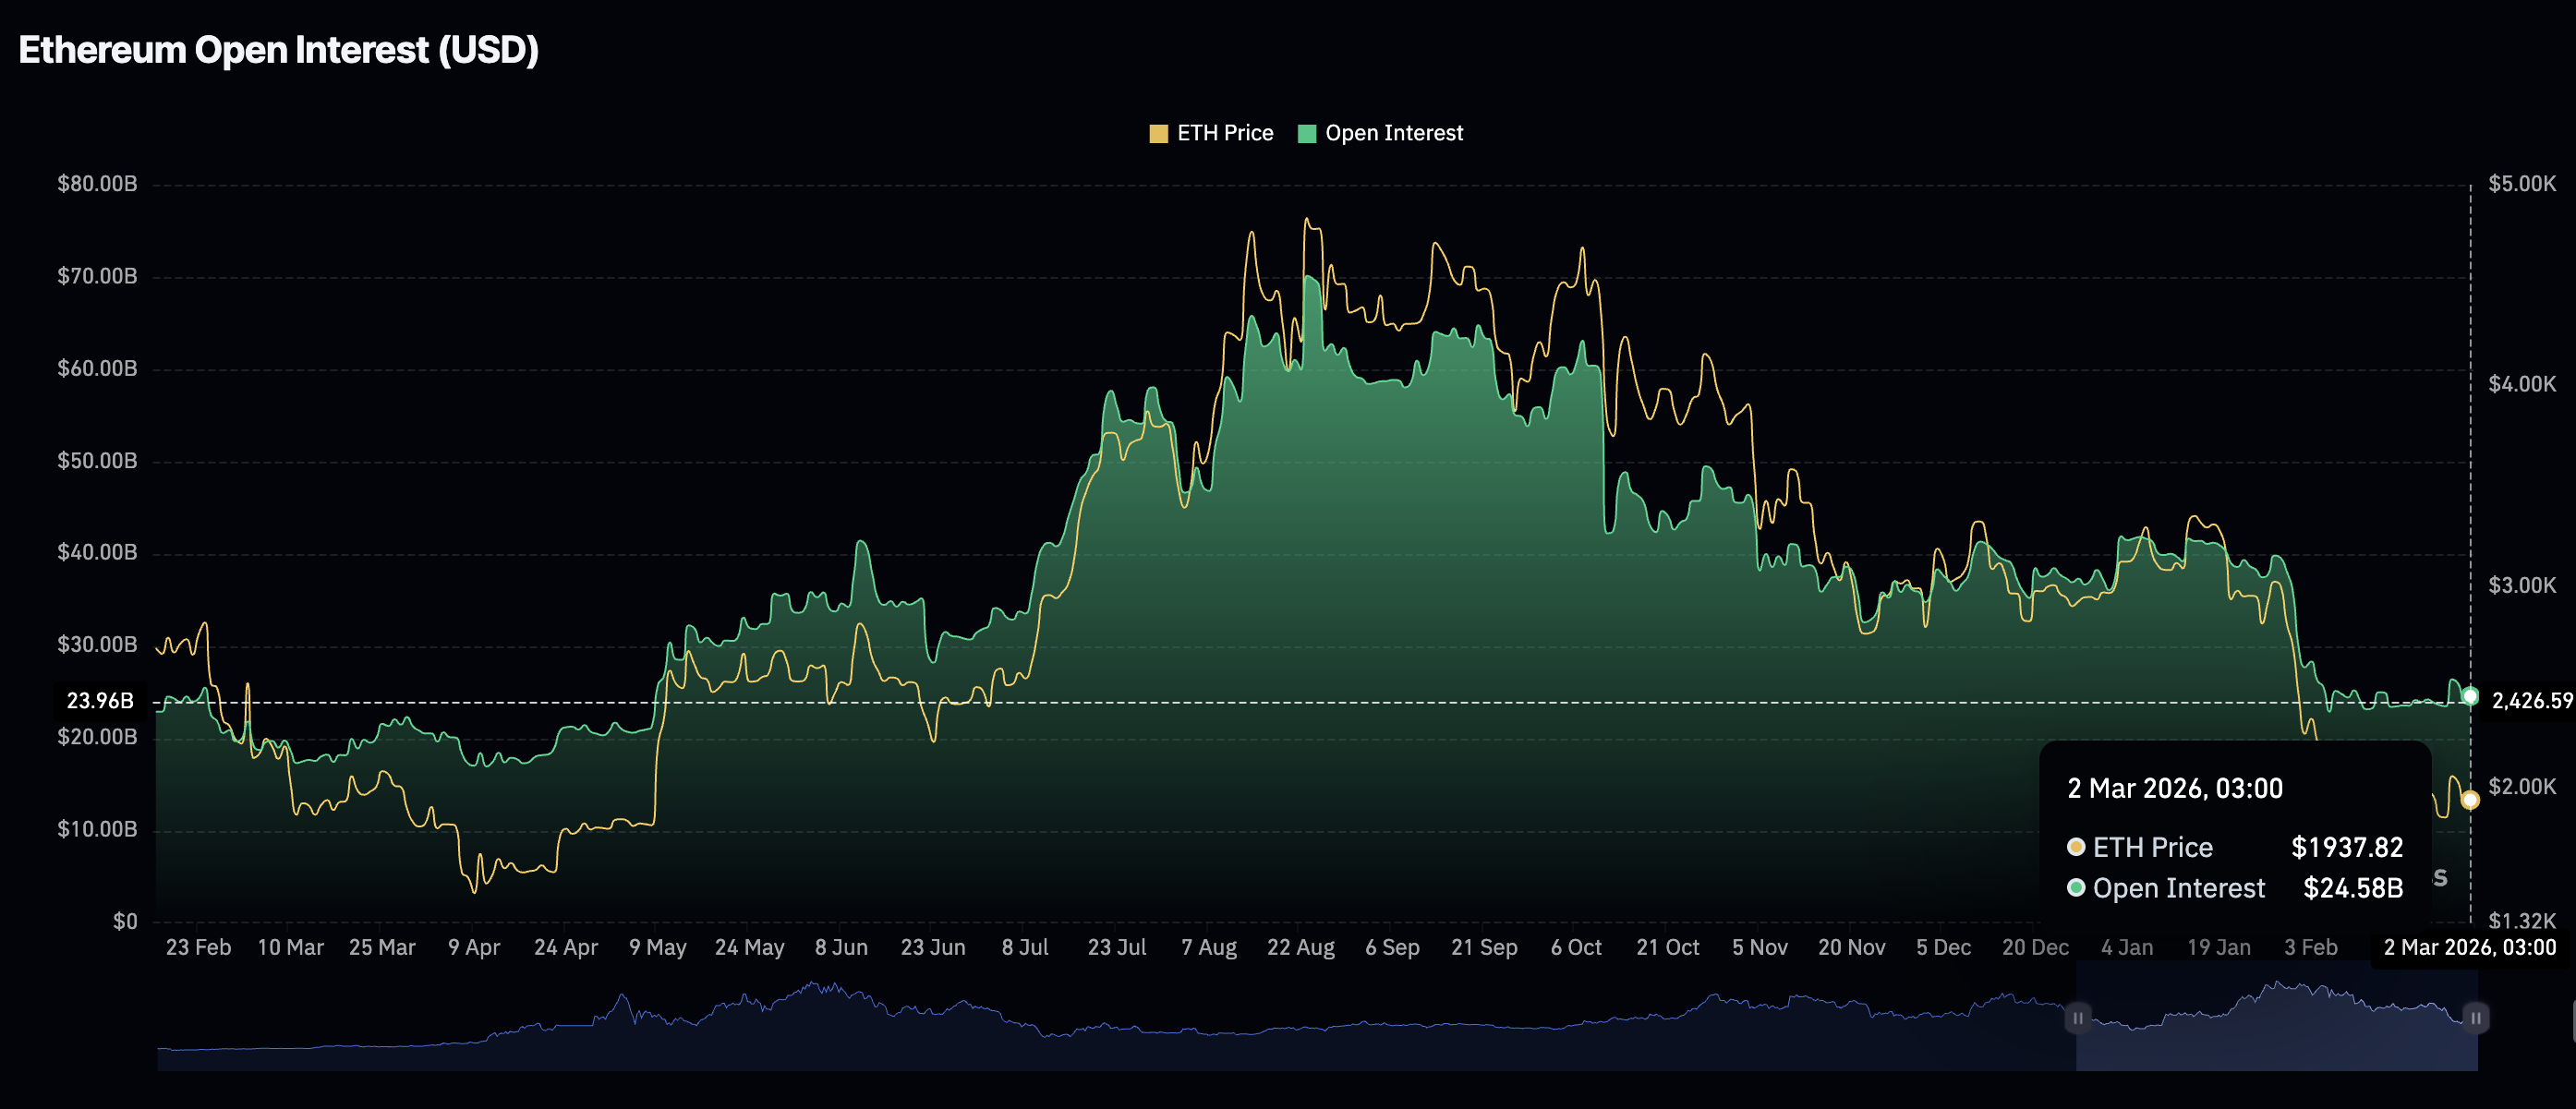
Ethereum also faces pressure in the derivatives market, with futures OI averaging $24.58 billion on Monday, up slightly from $24.38 billion the previous day. Despite this short-term pickup, the futures OI remains significantly below the record $70 billion in August.
XRP highlights a weakening retail market, just like Bitcoin and Ethereum, as futures OI has dropped $2.16 billion on Monday from $2.26 the previous day. Demand for XRP derivatives has remained on the back foot since July, when futures OI peaked at $10.94 billion, and the price hit a record $3.66. Continued weakness in futures OI would put more pressure on key support levels, leaving XRP vulnerable to an extended downtrend.
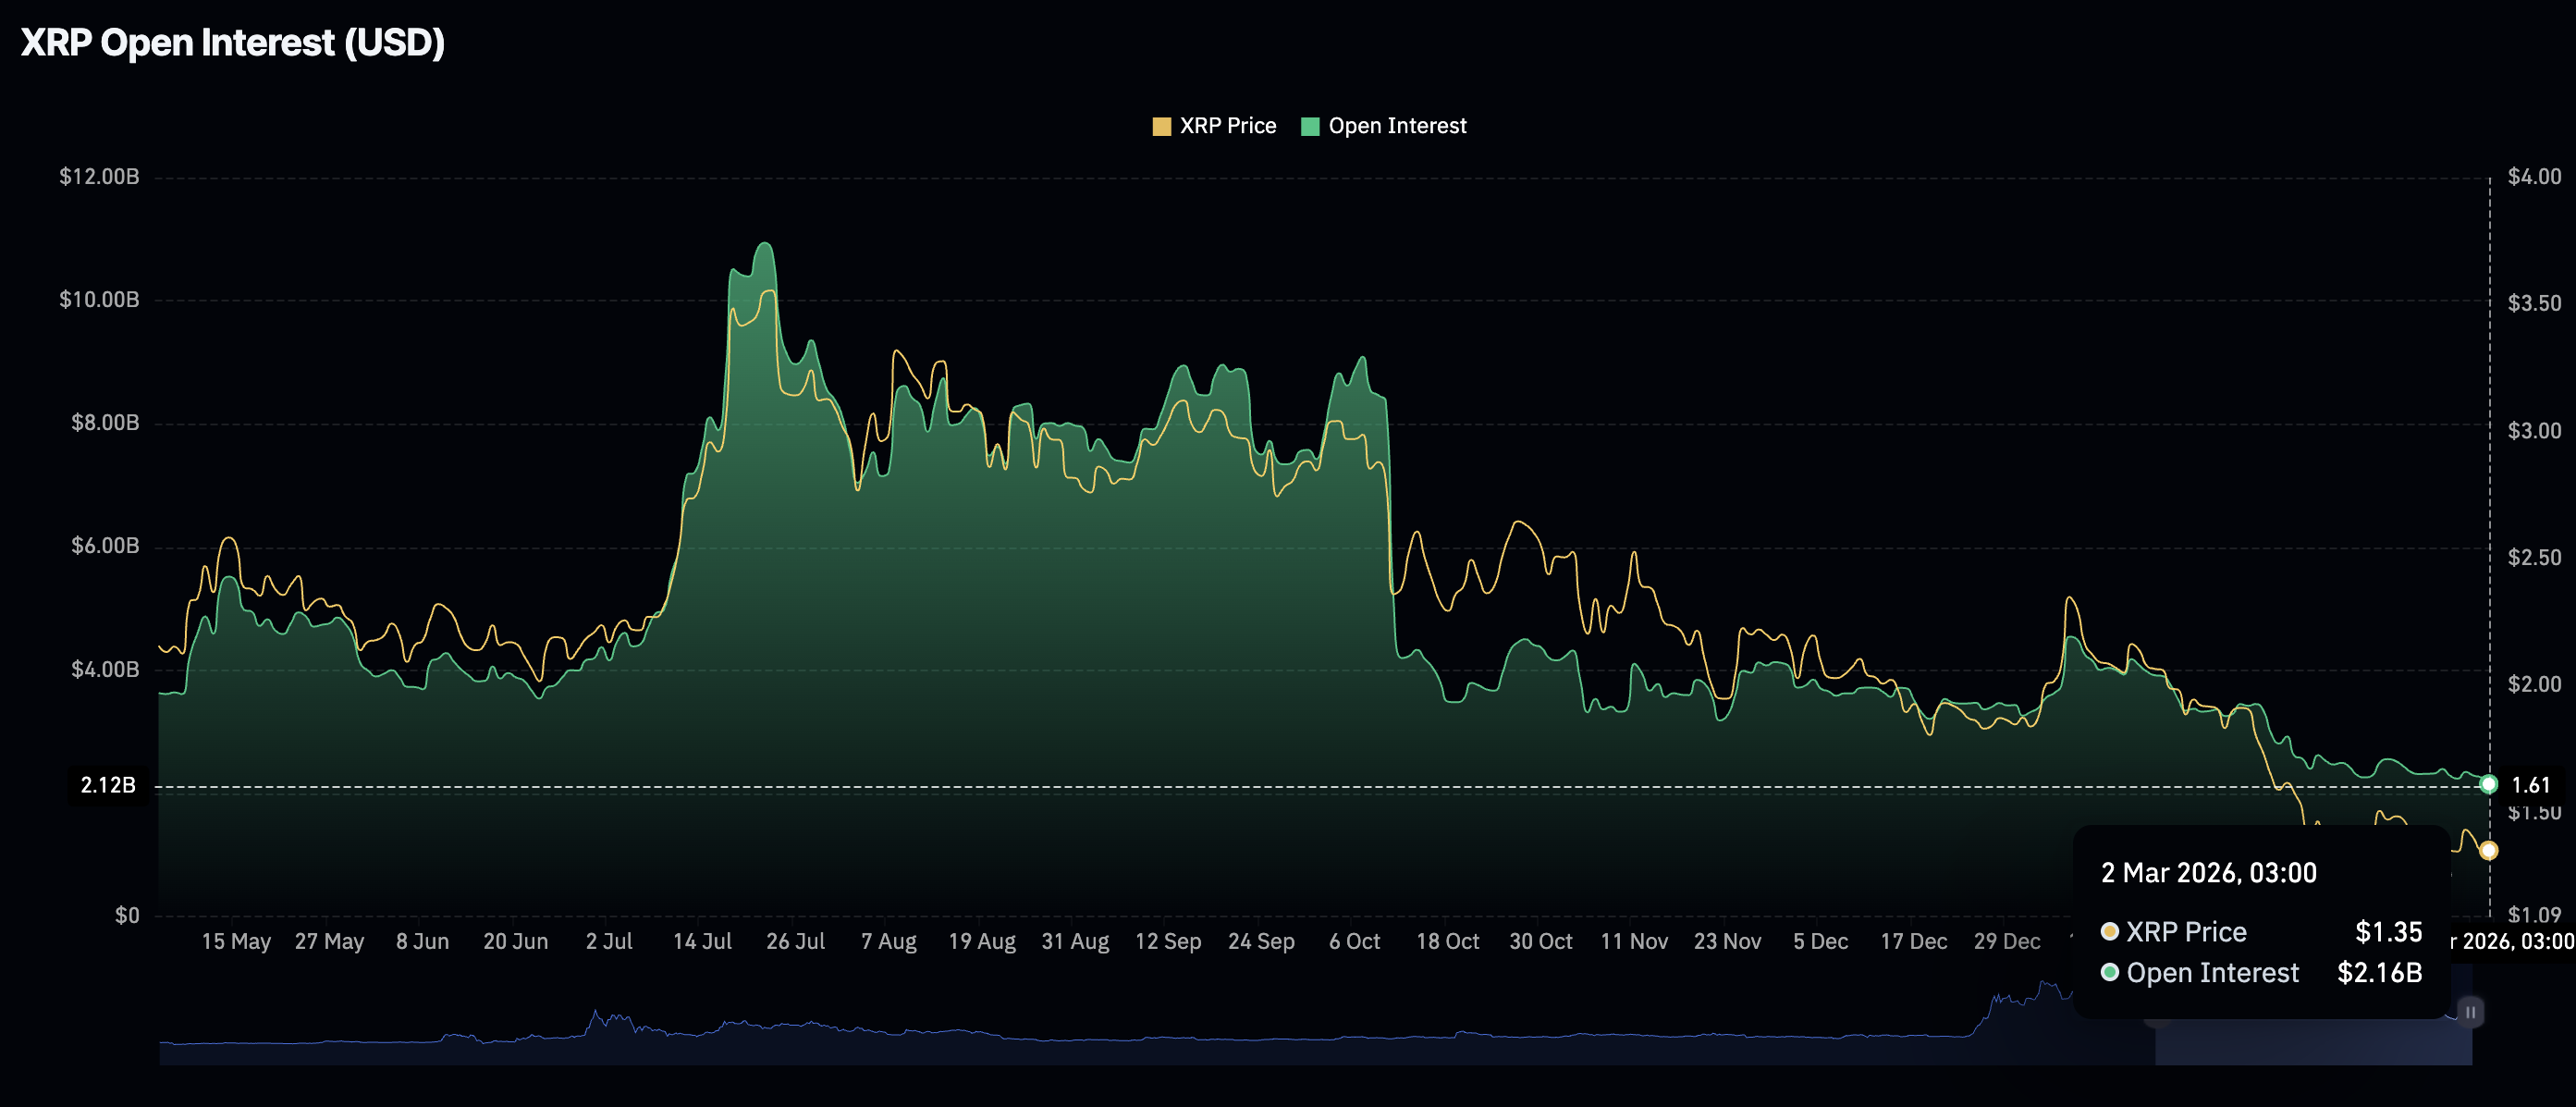
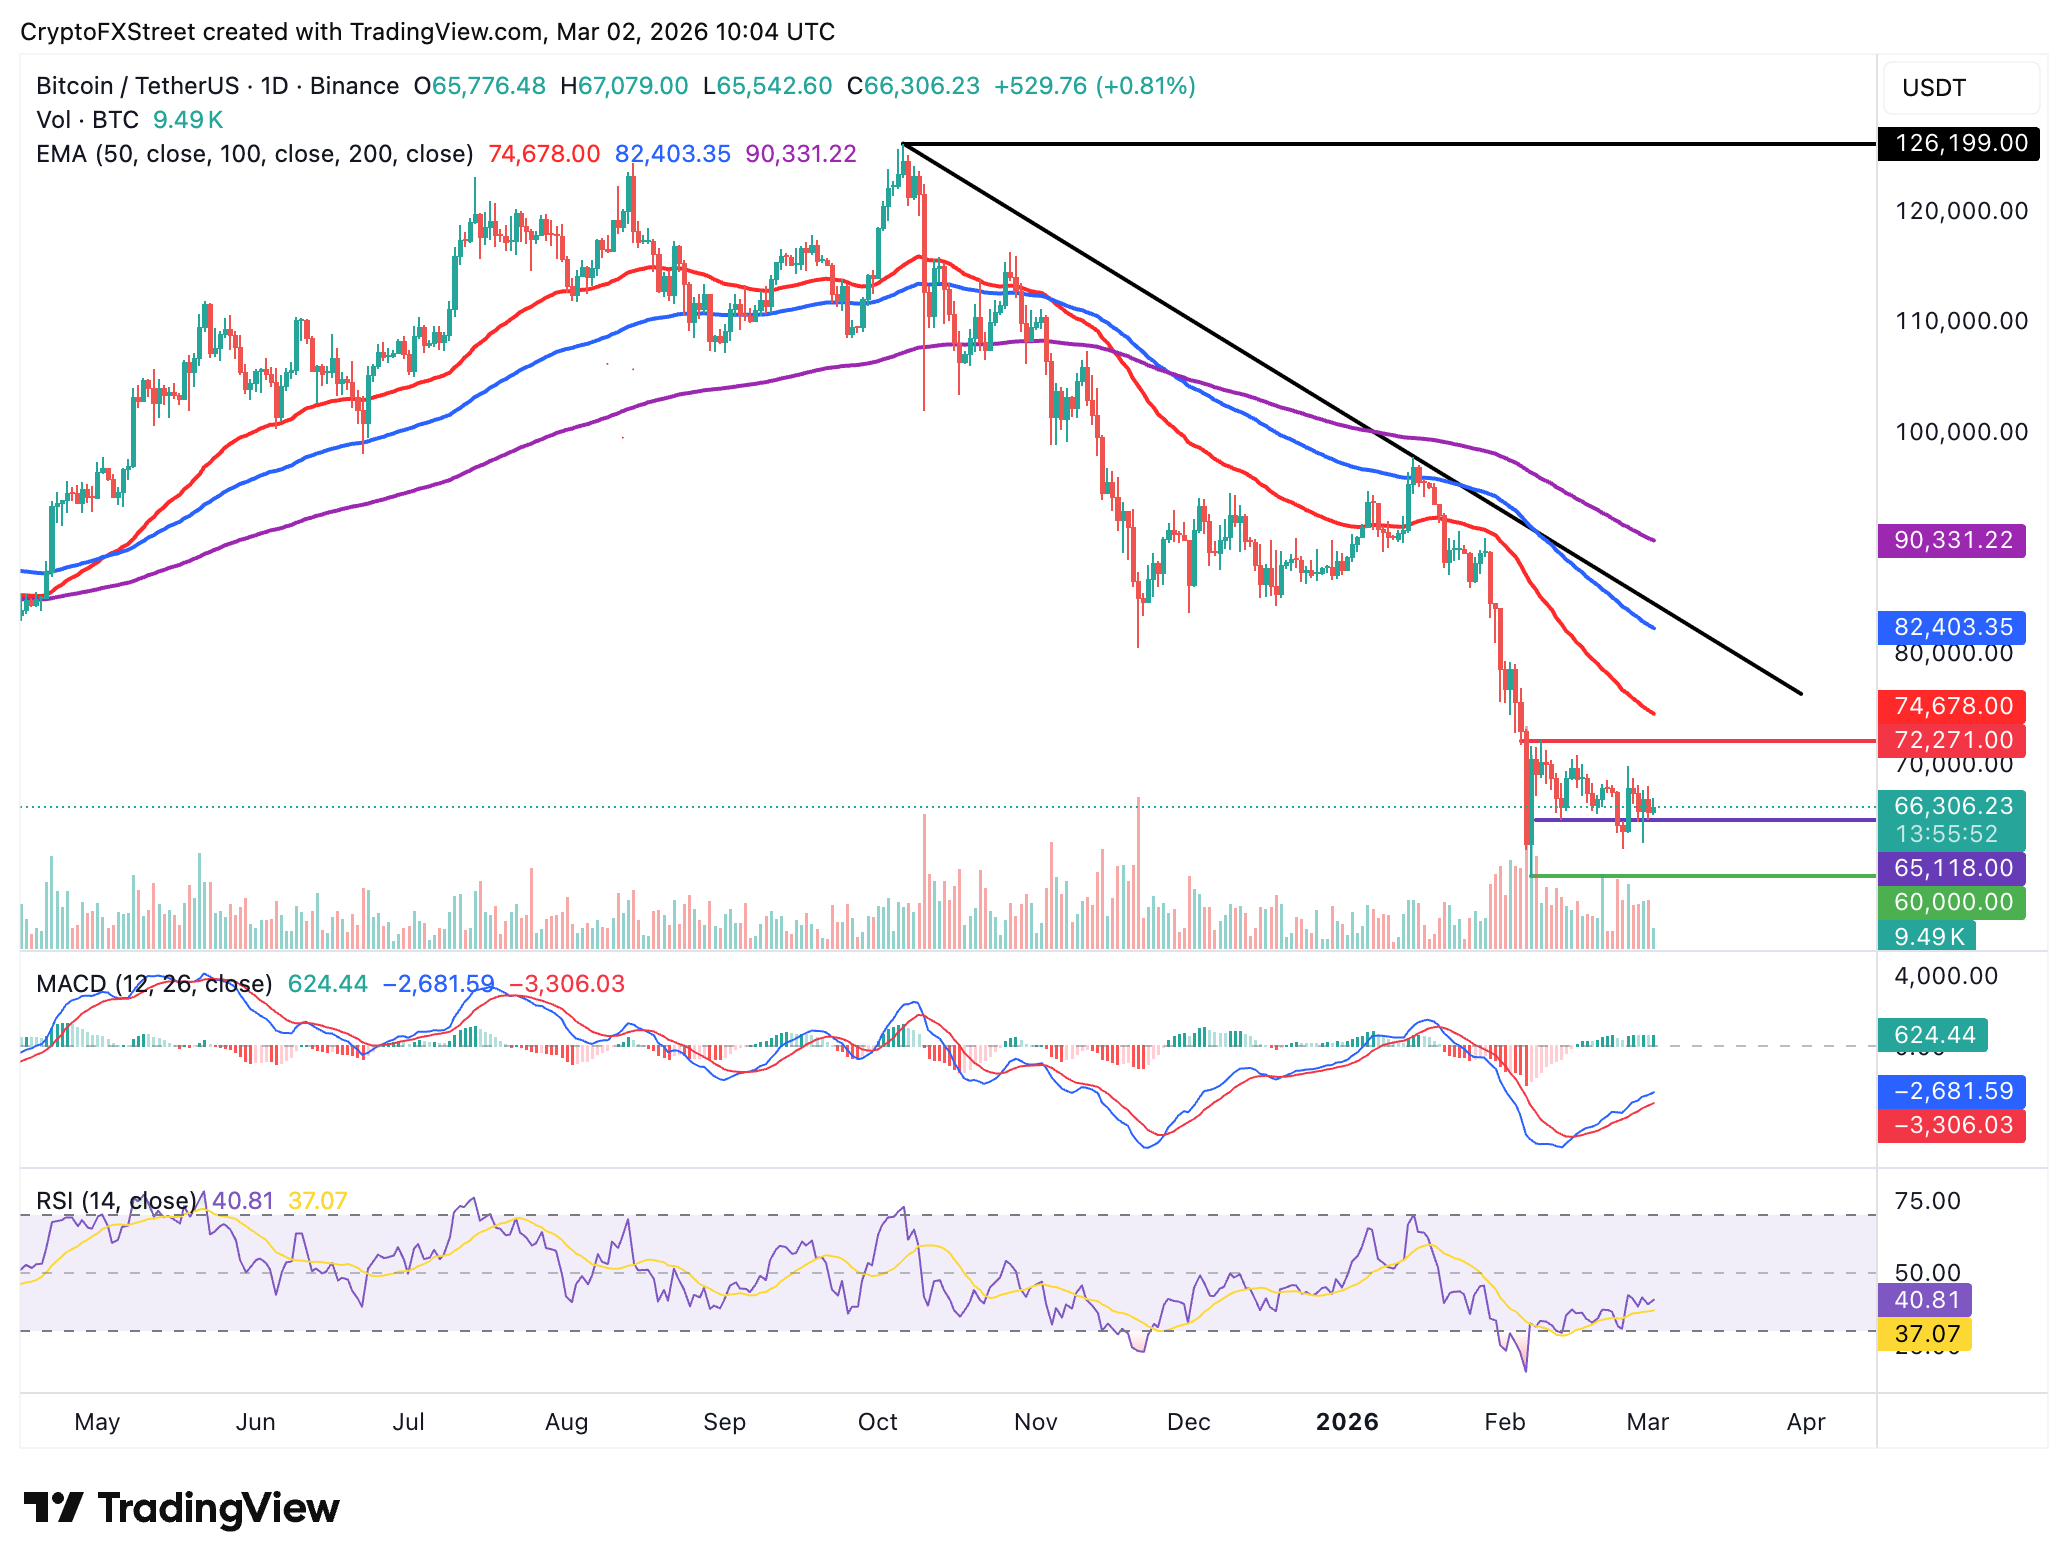
Chart of the day: Bitcoin holds key support as recovery stalls
Bitcoin is trading within a narrow range, above $66,000 and below its intraday high of $67,079. The 50-day Exponential Moving Average (EMA) at $74,678, the 100-day EMA at $82,403 and the 200-day EMA at $90,331 are drifting lower, affirming the overall downtrend.
A daily close below the weekly open at 65,776 would keep BTC’s upside constrained and extend the correction toward Saturday’s low at $63,030.
Still, the Moving Average Convergence Divergence (MACD) indicator holds above its signal line on the daily chart, while the green histogram bars expand, reinforcing a steady bullish grip.
An extended upswing of the Relative Strength Index (RSI), currently at 41 on the same chart, toward neutral levels would signal that bullish momentum is gaining traction. Traders will watch out for a break above the $67,079 hurdle to open the door to further gains, eyeing the February 8 high of $72,271.
Altcoins technical outlook: Ethereum, XRP defend baseline support
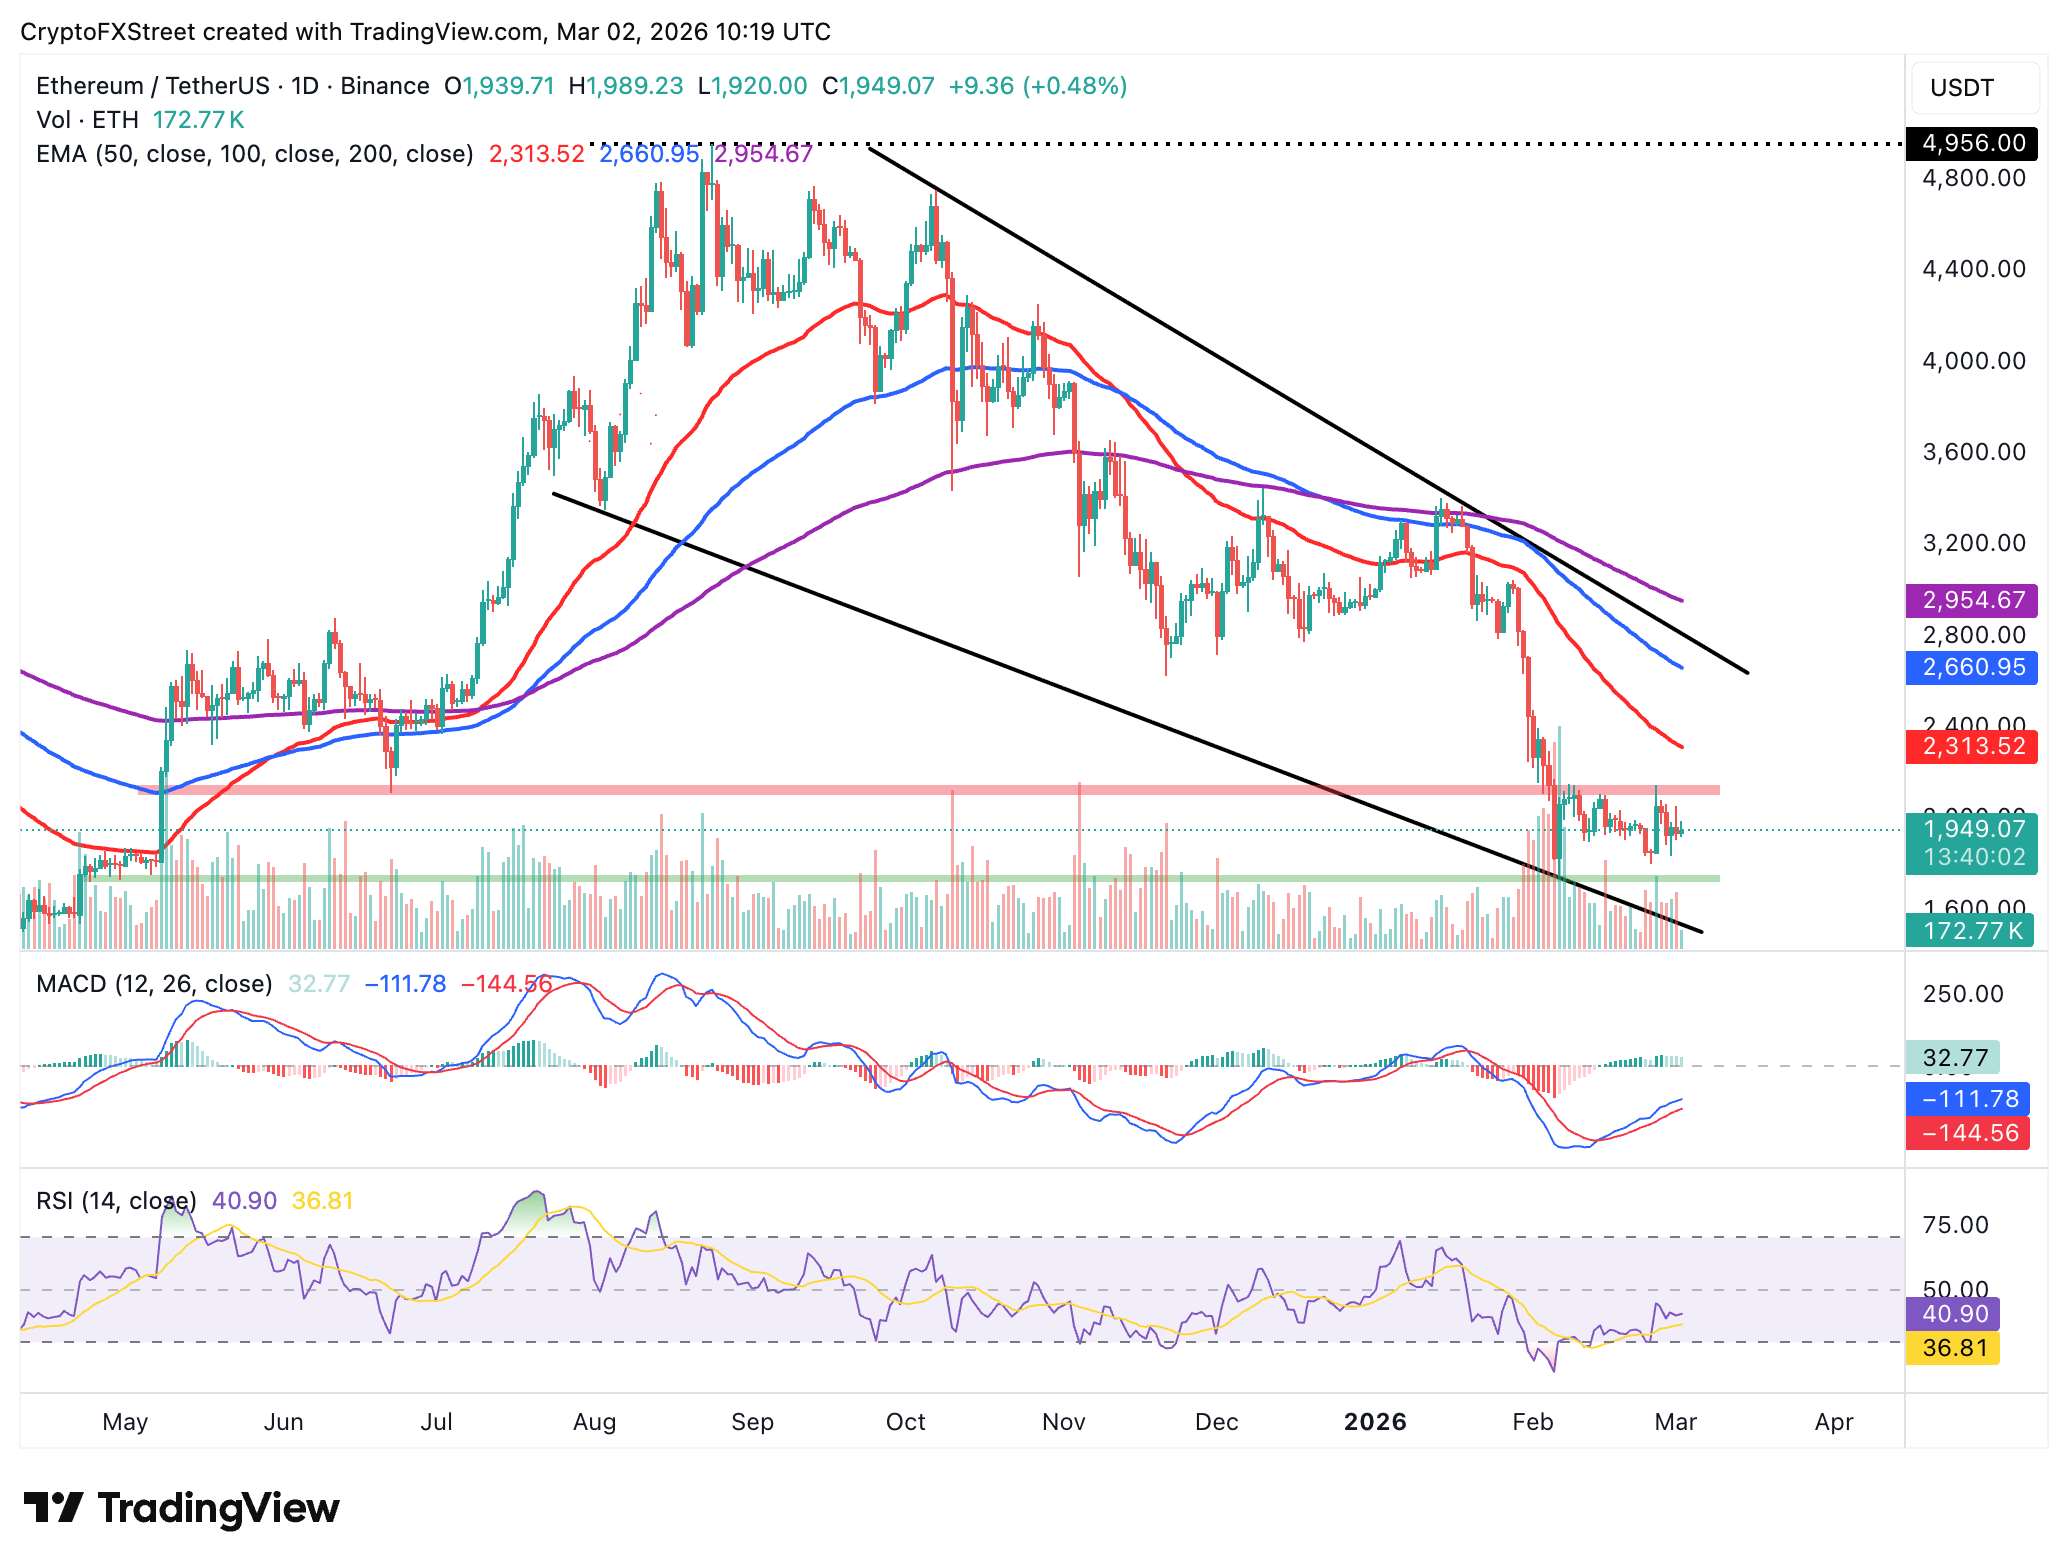
Ethereum remains above $1,900 but below the pivotal $2,000 level, weighed down by low retail interest, as mentioned earlier, and by the downward-trending 50-day EMA at $2,314, the 100-day EMA at $2,661, and the 200-day EMA at $2,955.
The RSI has stabilized around 41 on the daily chart but holds below the 50 midline, highlighting a bearish-leaning trend.
Meanwhile, the MACD indicator remains above its signal line, suggesting bullish momentum is still apparent and may steady ETH’s recovery. If the green histogram bars hold steady above the zero line, it may signal a move above $2,000. The 50-day EMA hurdle at $2,314 should be reclaimed as support to confirm the bullish shift, with the 100-day EMA at $2,661 in focus.
XRP also trades under pressure, correcting downward for the second consecutive day. The remittance token is holding above its intraday low of $1.33 at the time of writing on Monday, but below the previous day’s high of $1.43. For a steady recovery in XRP, this supply area hold be weakened to pave the way for a breakout toward the February 6 high at $1.54.
The MACD indicator is above the signal line on the daily chart, which, to some extent, supports a short-term bullish potential. However, the contracting green histogram bars suggest that XRP may lack the required momentum for a bullish shift in the short-term.
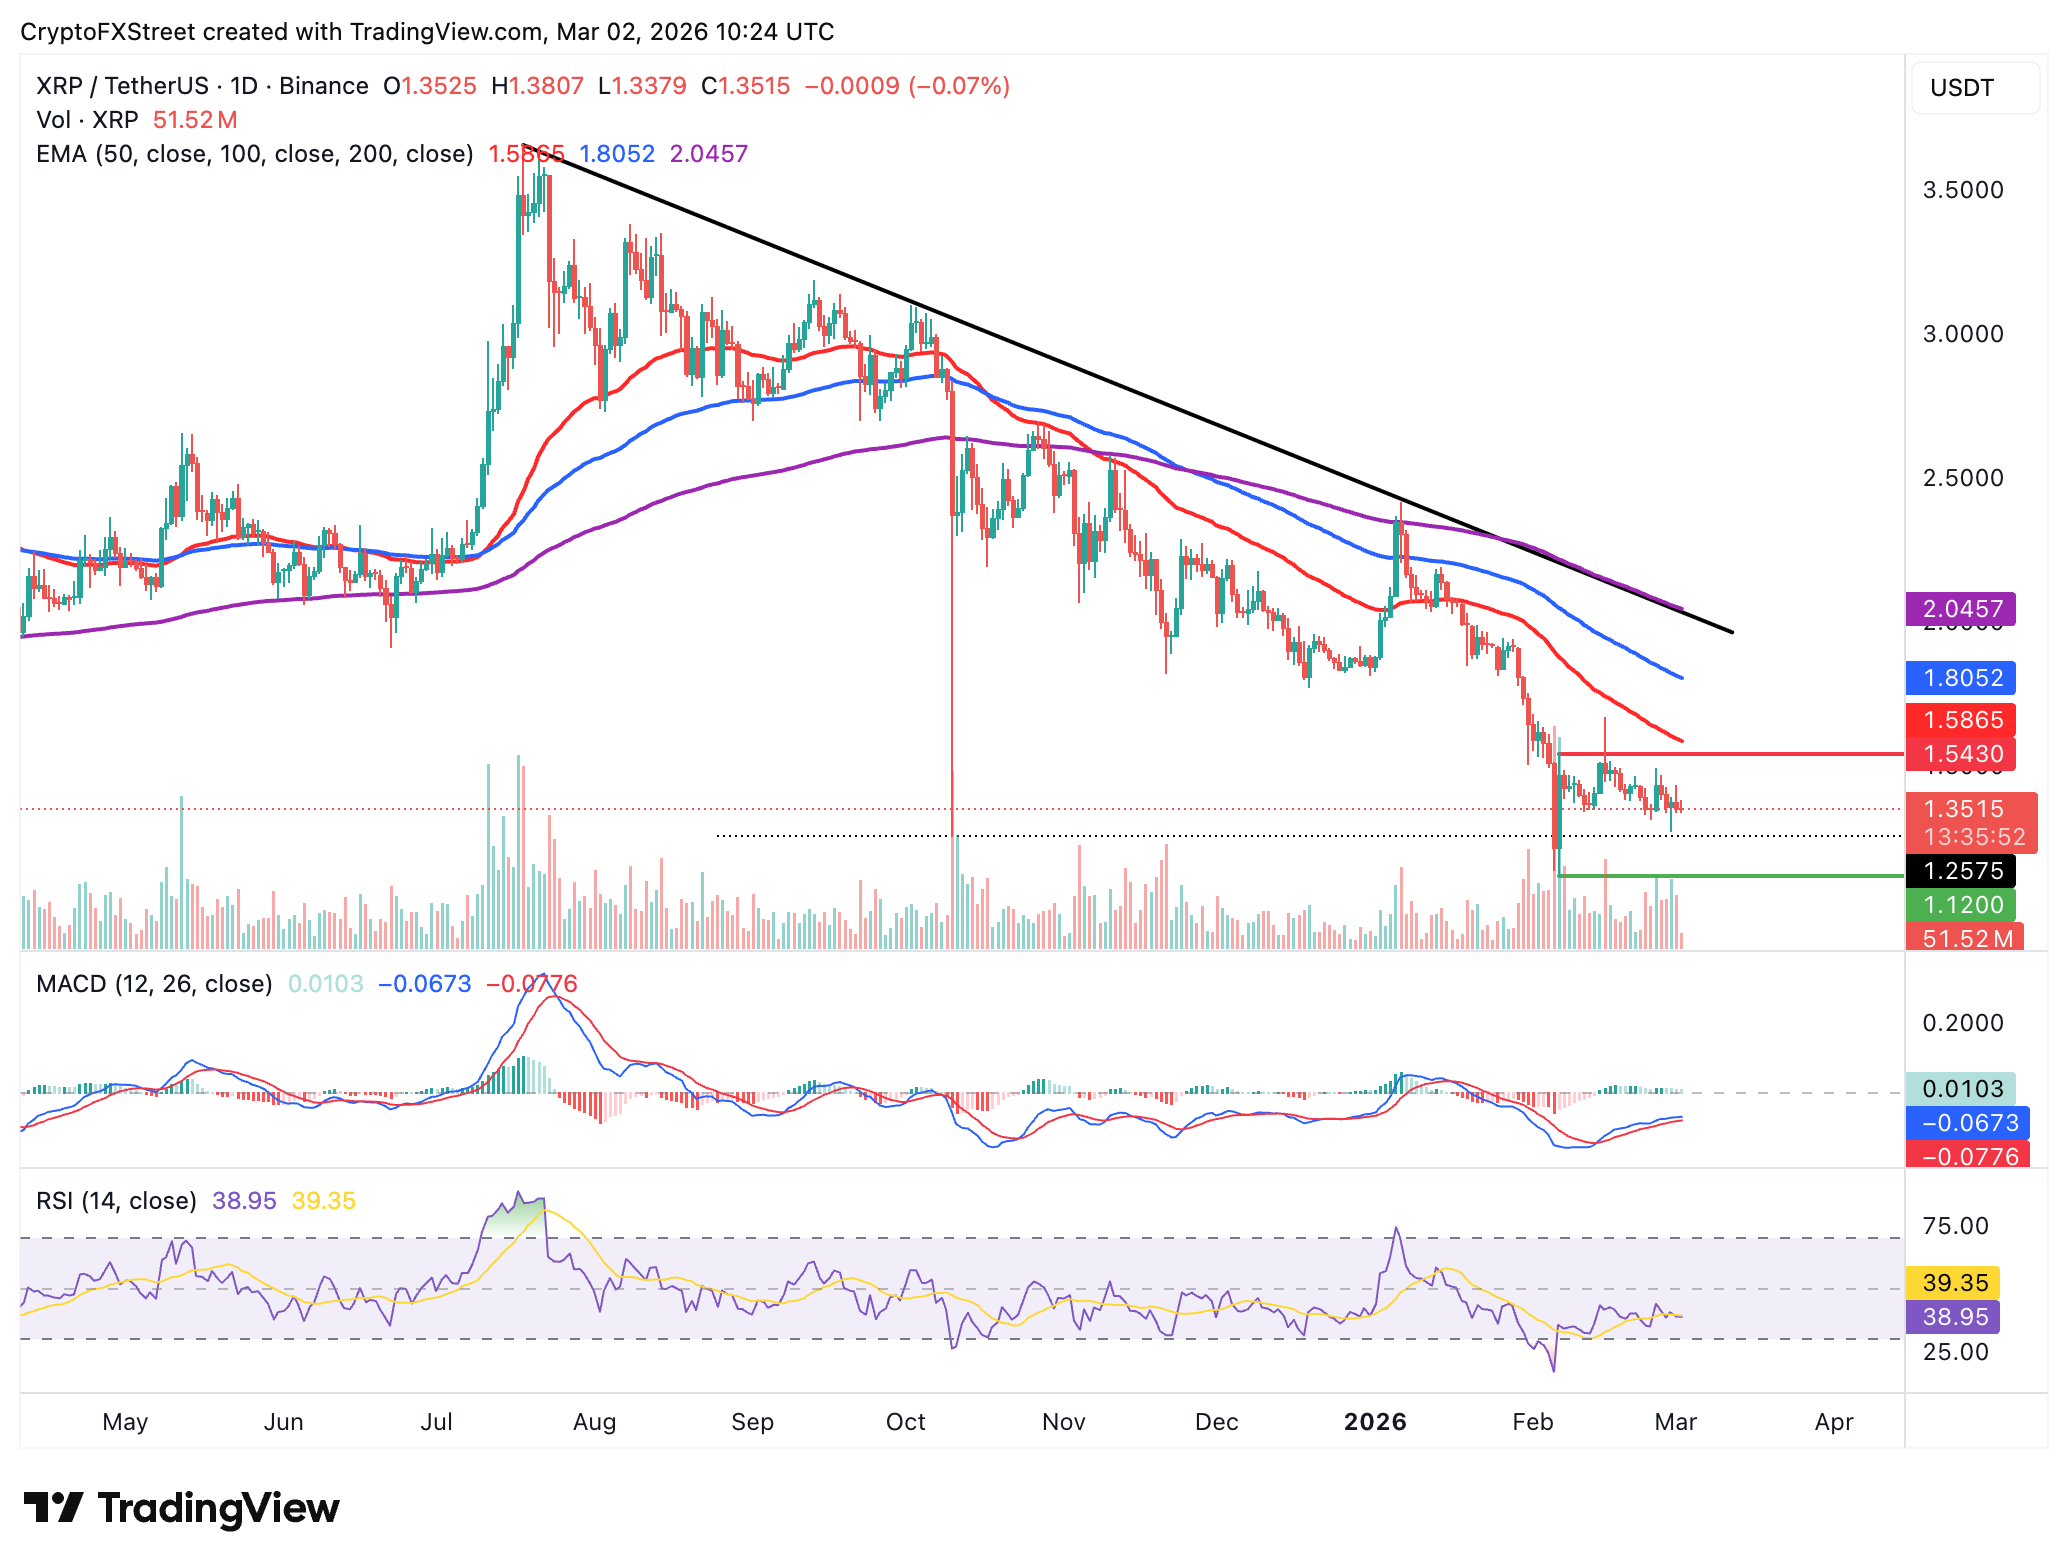
The RSI on the same chart is stable at 39 – below neutral. A reversal back into oversold territory would spur bearish momentum, potentially driving a correction to Saturday’s low at $1.27 and the February low at around $1.12.
Open Interest, funding rate FAQs
Higher Open Interest is associated with higher liquidity and new capital inflow to the market. This is considered the equivalent of increase in efficiency and the ongoing trend continues. When Open Interest decreases, it is considered a sign of liquidation in the market, investors are leaving and the overall demand for an asset is on a decline, fueling a bearish sentiment among investors.
Funding fees bridge the difference between spot prices and prices of futures contracts of an asset by increasing liquidation risks faced by traders. A consistently high and positive funding rate implies there is a bullish sentiment among market participants and there is an expectation of a price hike. A consistently negative funding rate for an asset implies a bearish sentiment, indicating that traders expect the cryptocurrency’s price to fall and a bearish trend reversal is likely to occur.

Mais de um milhão de usuários confiam na FXStreet para dados de mercado em tempo real, ferramentas de gráficos, insights de especialistas e notícias de Forex. Seu calendário econômico abrangente e webinars educacionais ajudam os traders a se manterem informados e tomarem decisões calculadas. A FXStreet conta com uma equipe de cerca de 60 profissionais, divididos entre a sede em Barcelona e diversas regiões globais.
Ler mais


