
Dogecoin Price Forecast: DOGE risks fresh yearly lows as bears tighten grip
Por Manish Chhetri
Atualizado: 23 Jun 2026


ARTIGOS POPULARES

Dogecoin (DOGE) remains under pressure, trading below $0.09 on Tuesday after failing to break above a key resistance zone and losing more than 7% last week. Weakening institutional interest, declining social dominance and a rise in bearish derivatives positioning continue to weigh on DOGE.
- Dogecoin trades below $0.09 on Tuesday after being rejected from the key resistance zone and falling over 7% in the previous week.
- Muted ETF flows, declining social dominance and increasing short bets support a bearish outlook for the meme coin.
- The technical outlook suggests a deeper correction, with momentum indicators showing signs of weakening.
Dogecoin (DOGE) remains under pressure, trading below $0.09 on Tuesday after failing to break above a key resistance zone and losing more than 7% last week. Weakening institutional interest, declining social dominance and a rise in bearish derivatives positioning continue to weigh on DOGE. In addition, deteriorating momentum indicators suggest the meme coin risks a deeper correction.
Bearish bias among traders
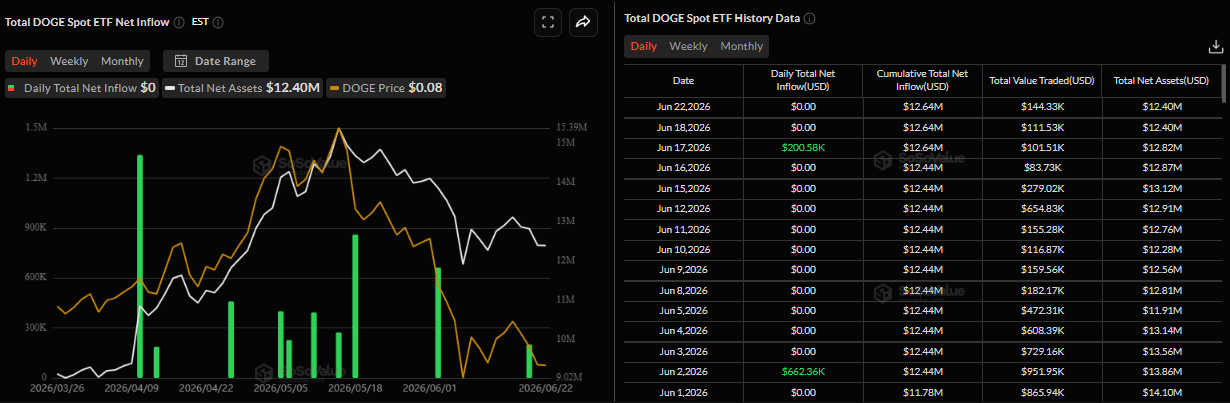
SoSoValue data shows that spot Exchange Traded Funds (ETFs) have stayed mostly silent so far this week and have been muted since early June. This indicates fading institutional demand. If the flows turn negative this week, Dogecoin could see a price correction.
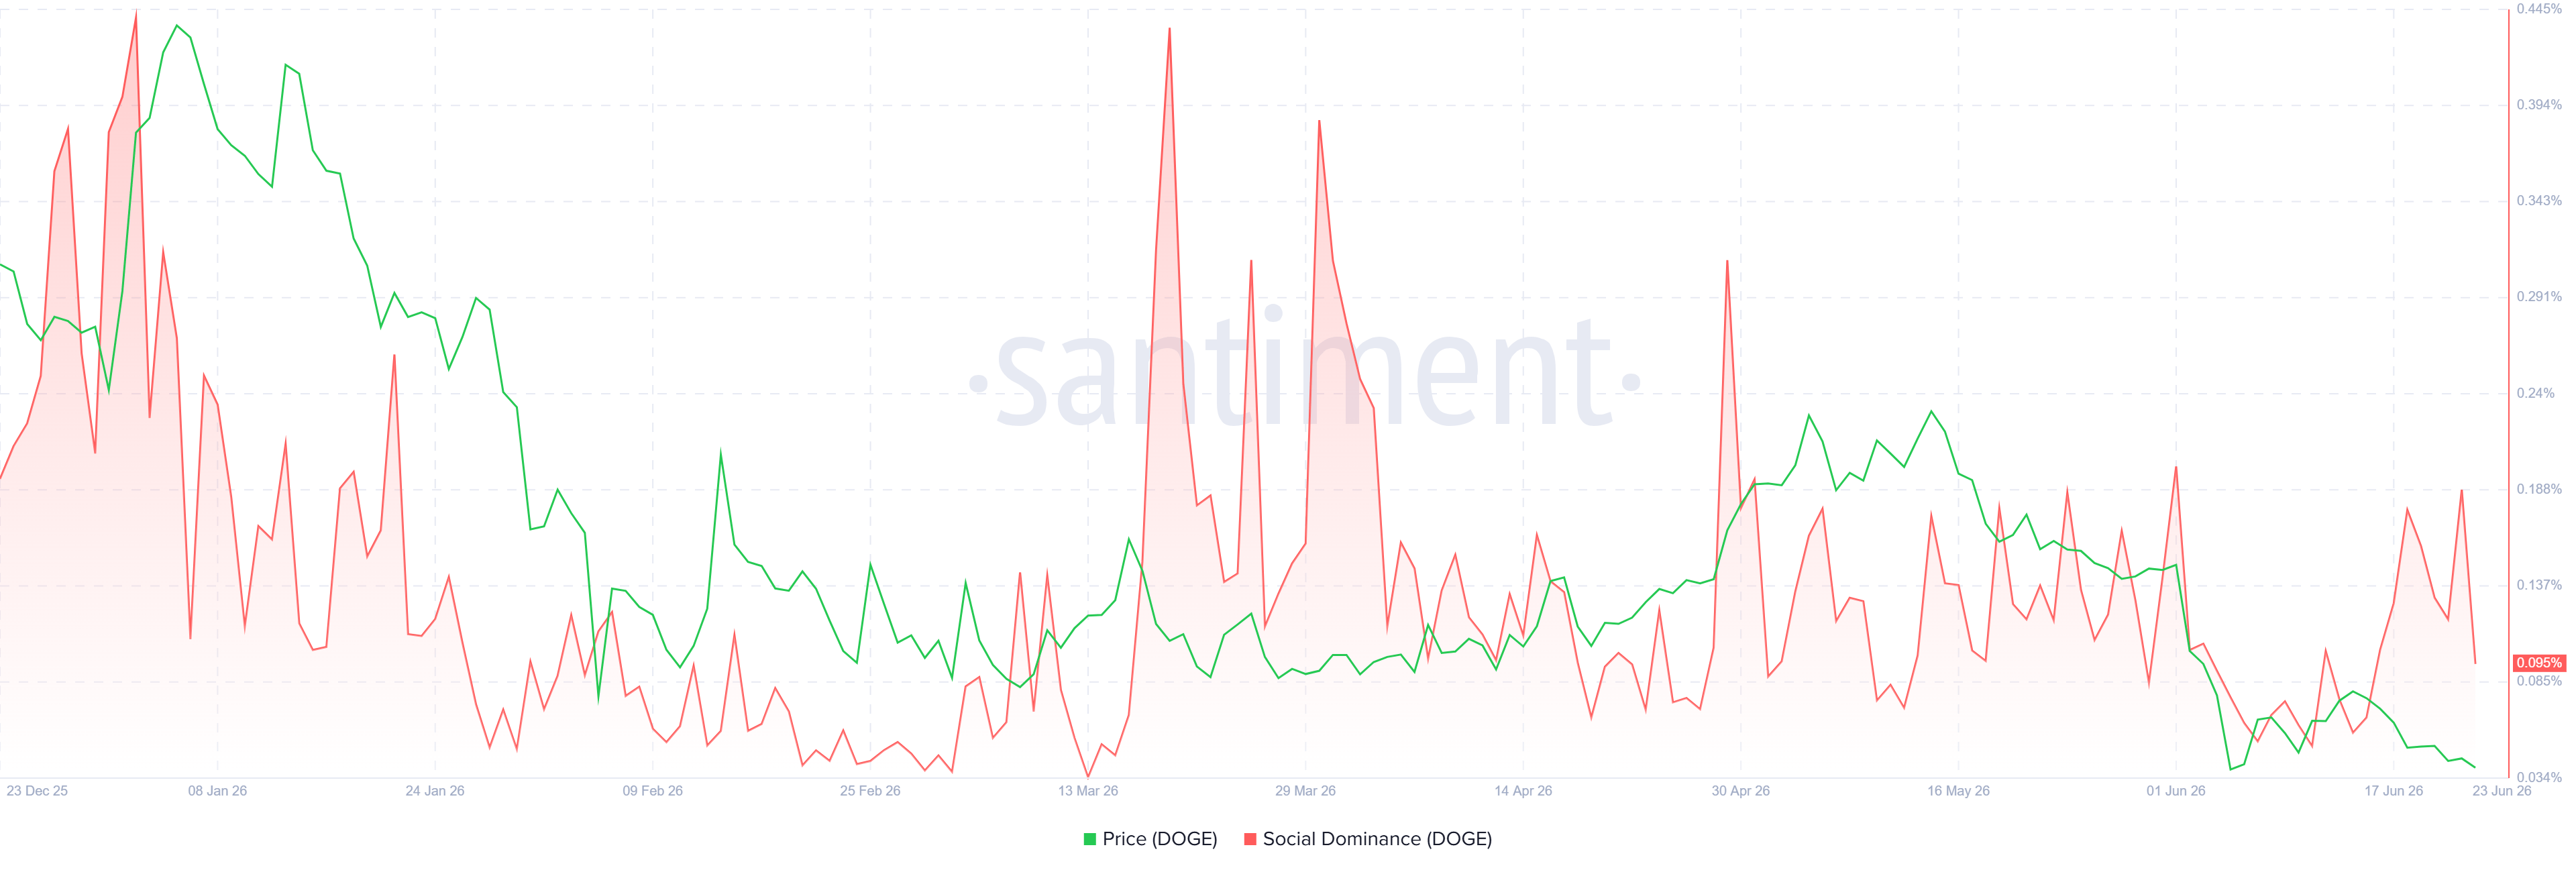
Santiment’s Social Dominance metric for the meme coin also supports a bearish outlook. The index measures the share of DOGE-related discussions across the cryptocurrency media. It has fallen sharply this week, reading 0.095% on Tuesday, gravitating toward the lows seen during early June. This fall indicates fading market interest and sentiment among DOGE investors.
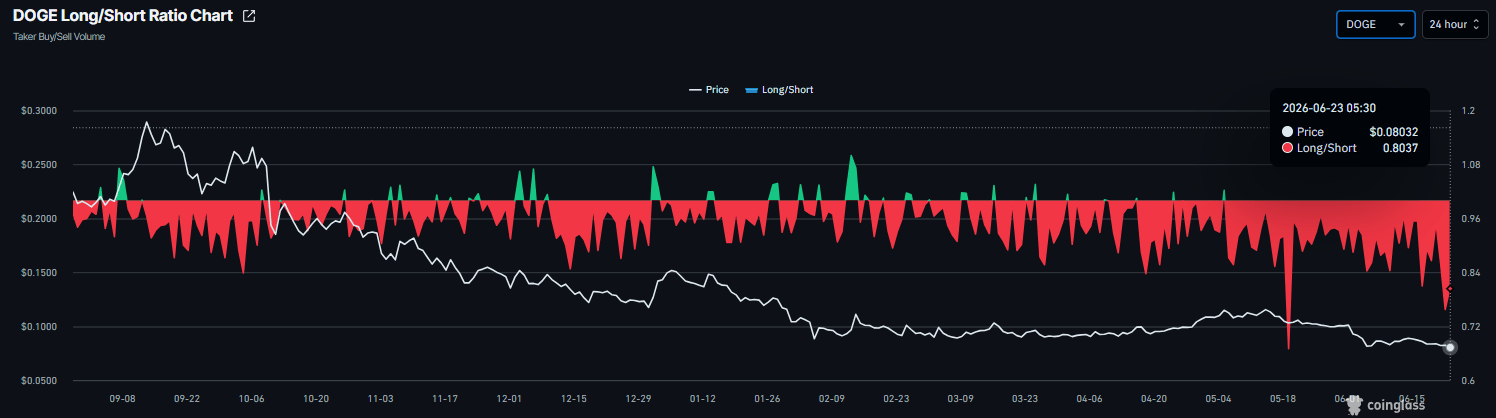
Derivatives metrics support a negative outlook for Dogecoin. CoinGlass’ long-to-short ratio for DOGE read 0.80 on Tuesday, nearing the lowest level over a month. The ratio being below one indicates bearish sentiment, as traders are betting that the assets’ prices will fall.
Dogecoin Price Forecast: How low can DOGE go?
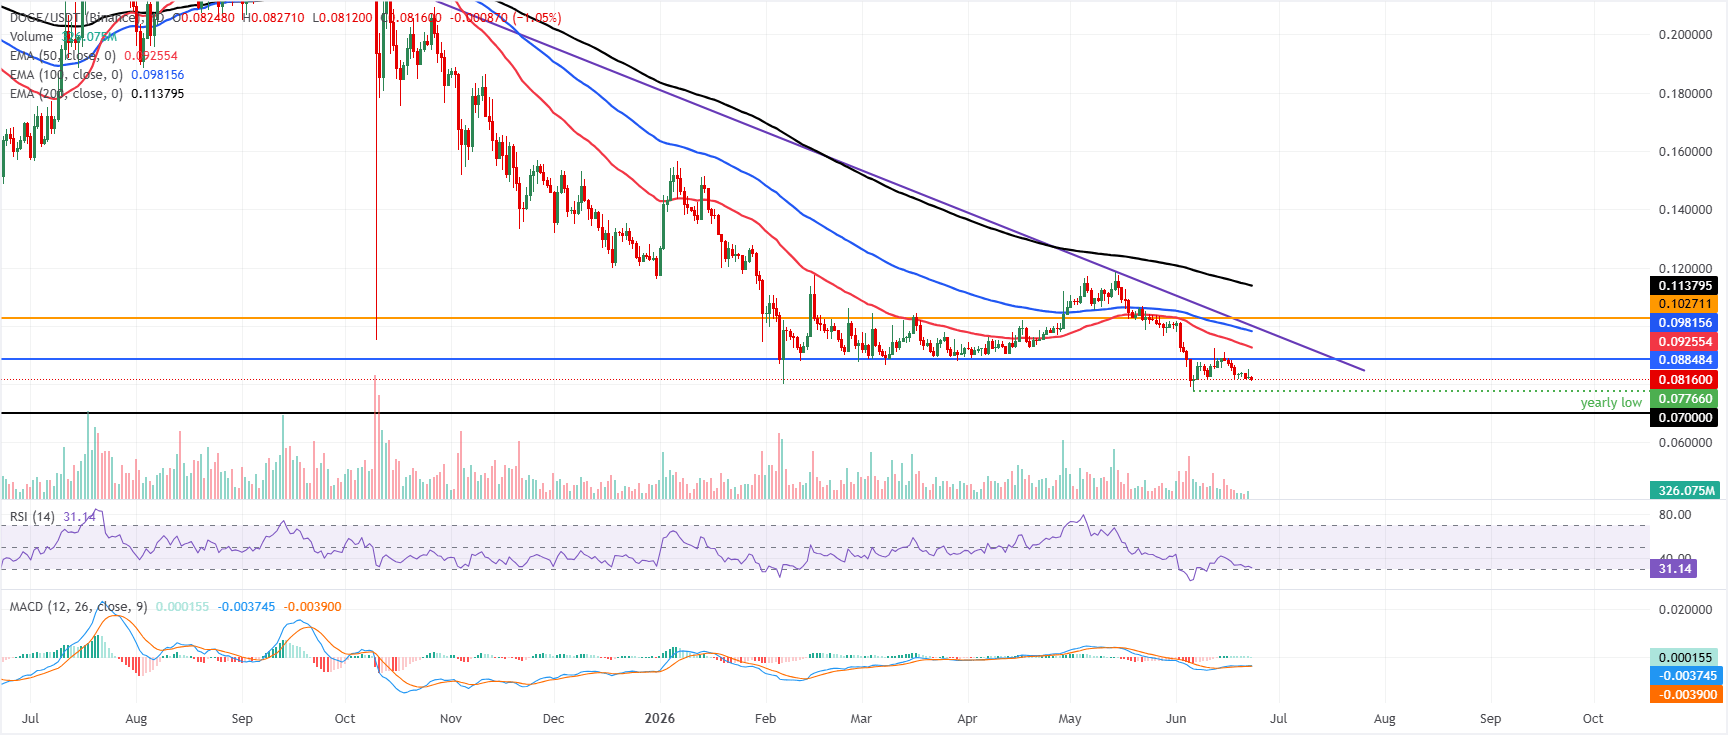
Dogecoin price trades at $0.0816 on Tuesday, maintaining a bearish near-term bias as it remains well below the 50-day, 100-day, and 200-day Exponential Moving Averages (EMAs), clustered between $0.093 and $0.114. The Relative Strength Index (RSI) sits just above oversold territory near 31, hinting that downside momentum is stretched but not yet reversed. At the same time, the slightly positive Moving Average Convergence Divergence (MACD) suggests only tentative stabilization rather than a confirmed recovery.
On the topside, initial resistance aligns with the prior horizontal cap near $0.0885, ahead of the 50-day EMA at $0.0926 and the 100-day EMA near $0.0982. Further up, the descending trendline resistance comes into play around the $0.1000 region, with an additional barrier at $0.1027 and the more distant 200-day EMA near $0.1138.
On the downside, the next notable support is at the yearly low of $0.0776 set on June 6; a close below could extend the fall toward the horizontal support level of $0.0700, where buyers could step in.
(The technical analysis of this story was written with the help of an AI tool.)

Mais de um milhão de usuários confiam na FXStreet para dados de mercado em tempo real, ferramentas de gráficos, insights de especialistas e notícias de Forex. Seu calendário econômico abrangente e webinars educacionais ajudam os traders a se manterem informados e tomarem decisões calculadas. A FXStreet conta com uma equipe de cerca de 60 profissionais, divididos entre a sede em Barcelona e diversas regiões globais.
Ler mais


