

EUR/GBP Price Forecast: RSI flirts with oversold as bears defend key resistance
- EUR/GBP rises for a second consecutive day as short-covering follows the midweek sell-off.
- The cross still heads for a fourth straight weekly loss after breaking below the 0.8600 support.
- Technically, sellers retain control while EUR/GBP trades below its major moving averages.
EUR/GBP edges higher on Friday, extending gains for a second consecutive day as traders cover short positions following the midweek sell-off. At the time of writing, the cross trades around 0.8501 but is still on track for a fourth straight weekly loss.
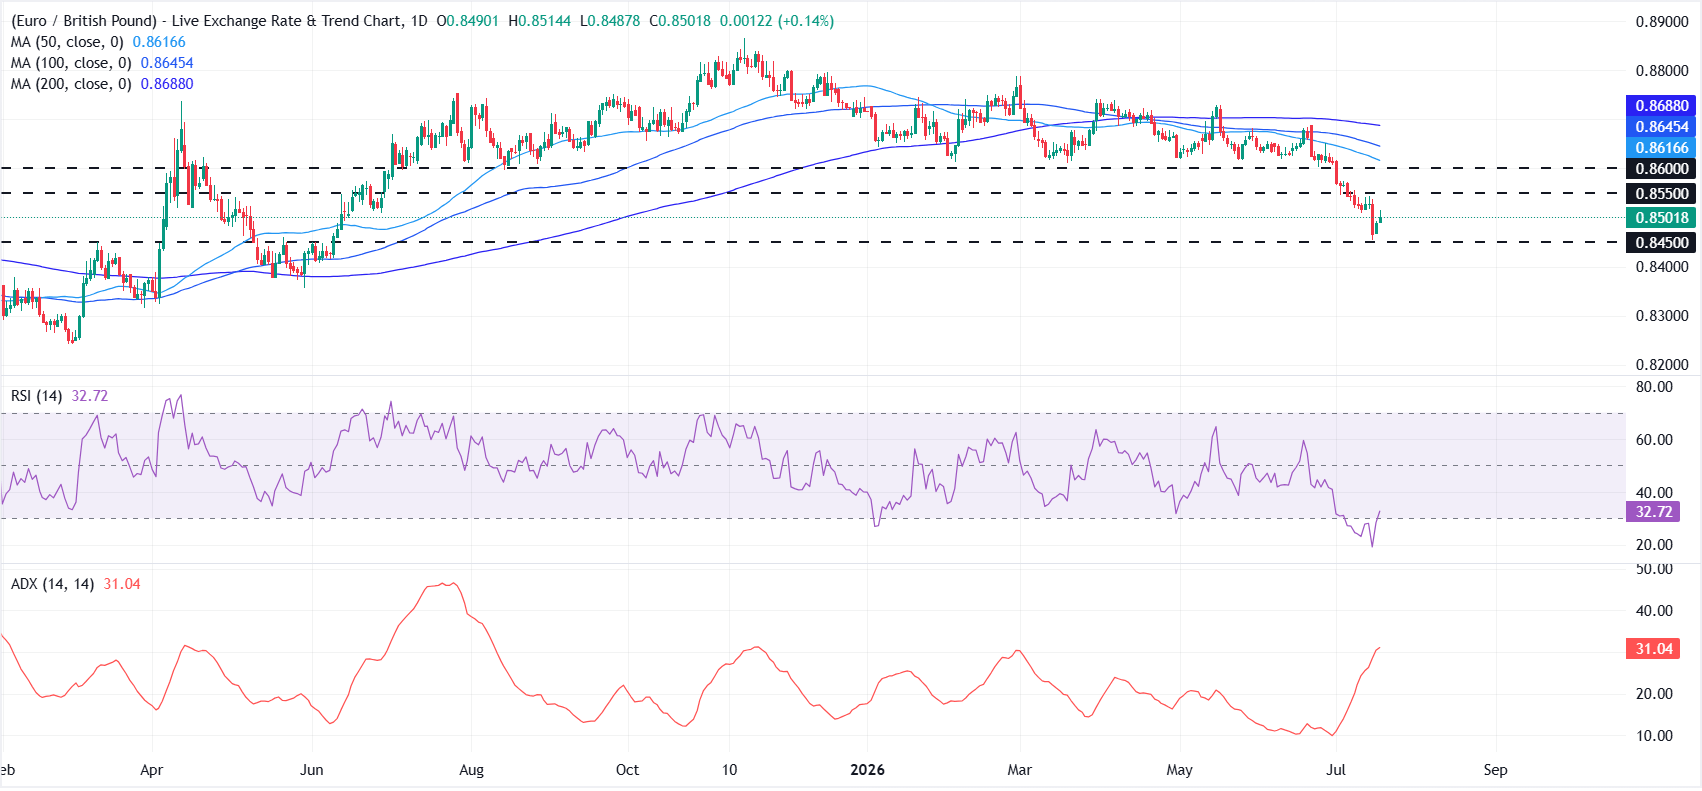
From a technical perspective, EUR/GBP faces persistent downside pressure after breaking below the multi-month support at 0.8600 on July 1, a move that pushed the cross to a one-year low.
On the daily chart, EUR/GBP trades around 0.8504 and holds below the 50-day, 100-day and 200-day Simple Moving Averages (SMAs), which are clustered between 0.8617 and 0.8688.
The Relative Strength Index (RSI) stands at 33.5, just above the oversold threshold of 30, while the Average Directional Index (ADX) at 31.0 points to a strengthening downtrend.
On the upside, initial resistance appears at 0.8550, followed by the 0.8600 horizontal barrier. Beyond that, the 50-day SMA at 0.8617 and the 100-day SMA at 0.8645 could limit recovery attempts, with the 200-day SMA at 0.8688 acting as a stronger barrier.
On the downside, the next notable support sits at 0.8450. A sustained break below this level could open the door to an extension of the current bearish move.
(The technical analysis of this story was written with the help of an AI tool. Know more.)
Euro Price Today
The table below shows the percentage change of Euro (EUR) against listed major currencies today. Euro was the strongest against the Australian Dollar.
| USD | EUR | GBP | JPY | CAD | AUD | NZD | CHF | |
|---|---|---|---|---|---|---|---|---|
| USD | 0.06% | 0.20% | -0.02% | -0.24% | 0.23% | 0.11% | -0.14% | |
| EUR | -0.06% | 0.15% | -0.11% | -0.33% | 0.19% | 0.05% | -0.21% | |
| GBP | -0.20% | -0.15% | -0.26% | -0.49% | 0.02% | -0.08% | -0.36% | |
| JPY | 0.02% | 0.11% | 0.26% | -0.23% | 0.26% | 0.12% | -0.13% | |
| CAD | 0.24% | 0.33% | 0.49% | 0.23% | 0.49% | 0.36% | 0.10% | |
| AUD | -0.23% | -0.19% | -0.02% | -0.26% | -0.49% | -0.15% | -0.40% | |
| NZD | -0.11% | -0.05% | 0.08% | -0.12% | -0.36% | 0.15% | -0.26% | |
| CHF | 0.14% | 0.21% | 0.36% | 0.13% | -0.10% | 0.40% | 0.26% |
The heat map shows percentage changes of major currencies against each other. The base currency is picked from the left column, while the quote currency is picked from the top row. For example, if you pick the Euro from the left column and move along the horizontal line to the US Dollar, the percentage change displayed in the box will represent EUR (base)/USD (quote).














