
EUR/USD Price Forecast: Tests 1.1600 amid flaring geopolitical tensions, higher Oil prices
Por Guillermo Alcala
Atualizado: 3 Jun 2026


ARTIGOS POPULARES

The Euro (EUR) resumed its downtrend against a stronger US Dollar (USD) on Wednesday, with bears testing support at the 1.1600 level.
- EUR/USD resumes its downtrend and tests support at 1.1600.
- US and Iran exchange attacks, and Oil rises, crushing risk appetite.
- Below 1.1600, bears are likely to target the bottom of the last two weeks' trading range at 1.1570.
The Euro (EUR) resumed its downtrend against a stronger US Dollar (USD) on Wednesday, with bears testing support at the 1.1600 level. Market concerns of a full-blown war in the Middle East have increased, following hostilities in the Middle East, pushing Oil prices higher and crushing investors' appetite for risk.
Market sentiment soured on Wednesday amid reports of US attacks on Iran and Iranian missile and drone strikes on Kuwait and Bahrain that are testing the limits of a fragile ceasefire. Apart from that, Al Jazeera news agency has reported an Israeli attack on the outskirts of Beirut, adding gasoline to the fire.
Against this background, the upward revisions of the final HCOB Services Purchasing Managers’ Index (PMI) and the high Producer Prices Index (PPI) released in the Eurozone on Wednesday have gone practically unnoticed. In the US, ADP Employment and the ISM Services PMI will gather some attention later on the day. Earlier in the week, bright JOLTS Job Openings and manufacturing activity data contributed to boost hopes of a Federal Reserve (Fed) rate hike before year-end, providing additional support for the USD-.
Technical Analysis: Key support is at 1.1570
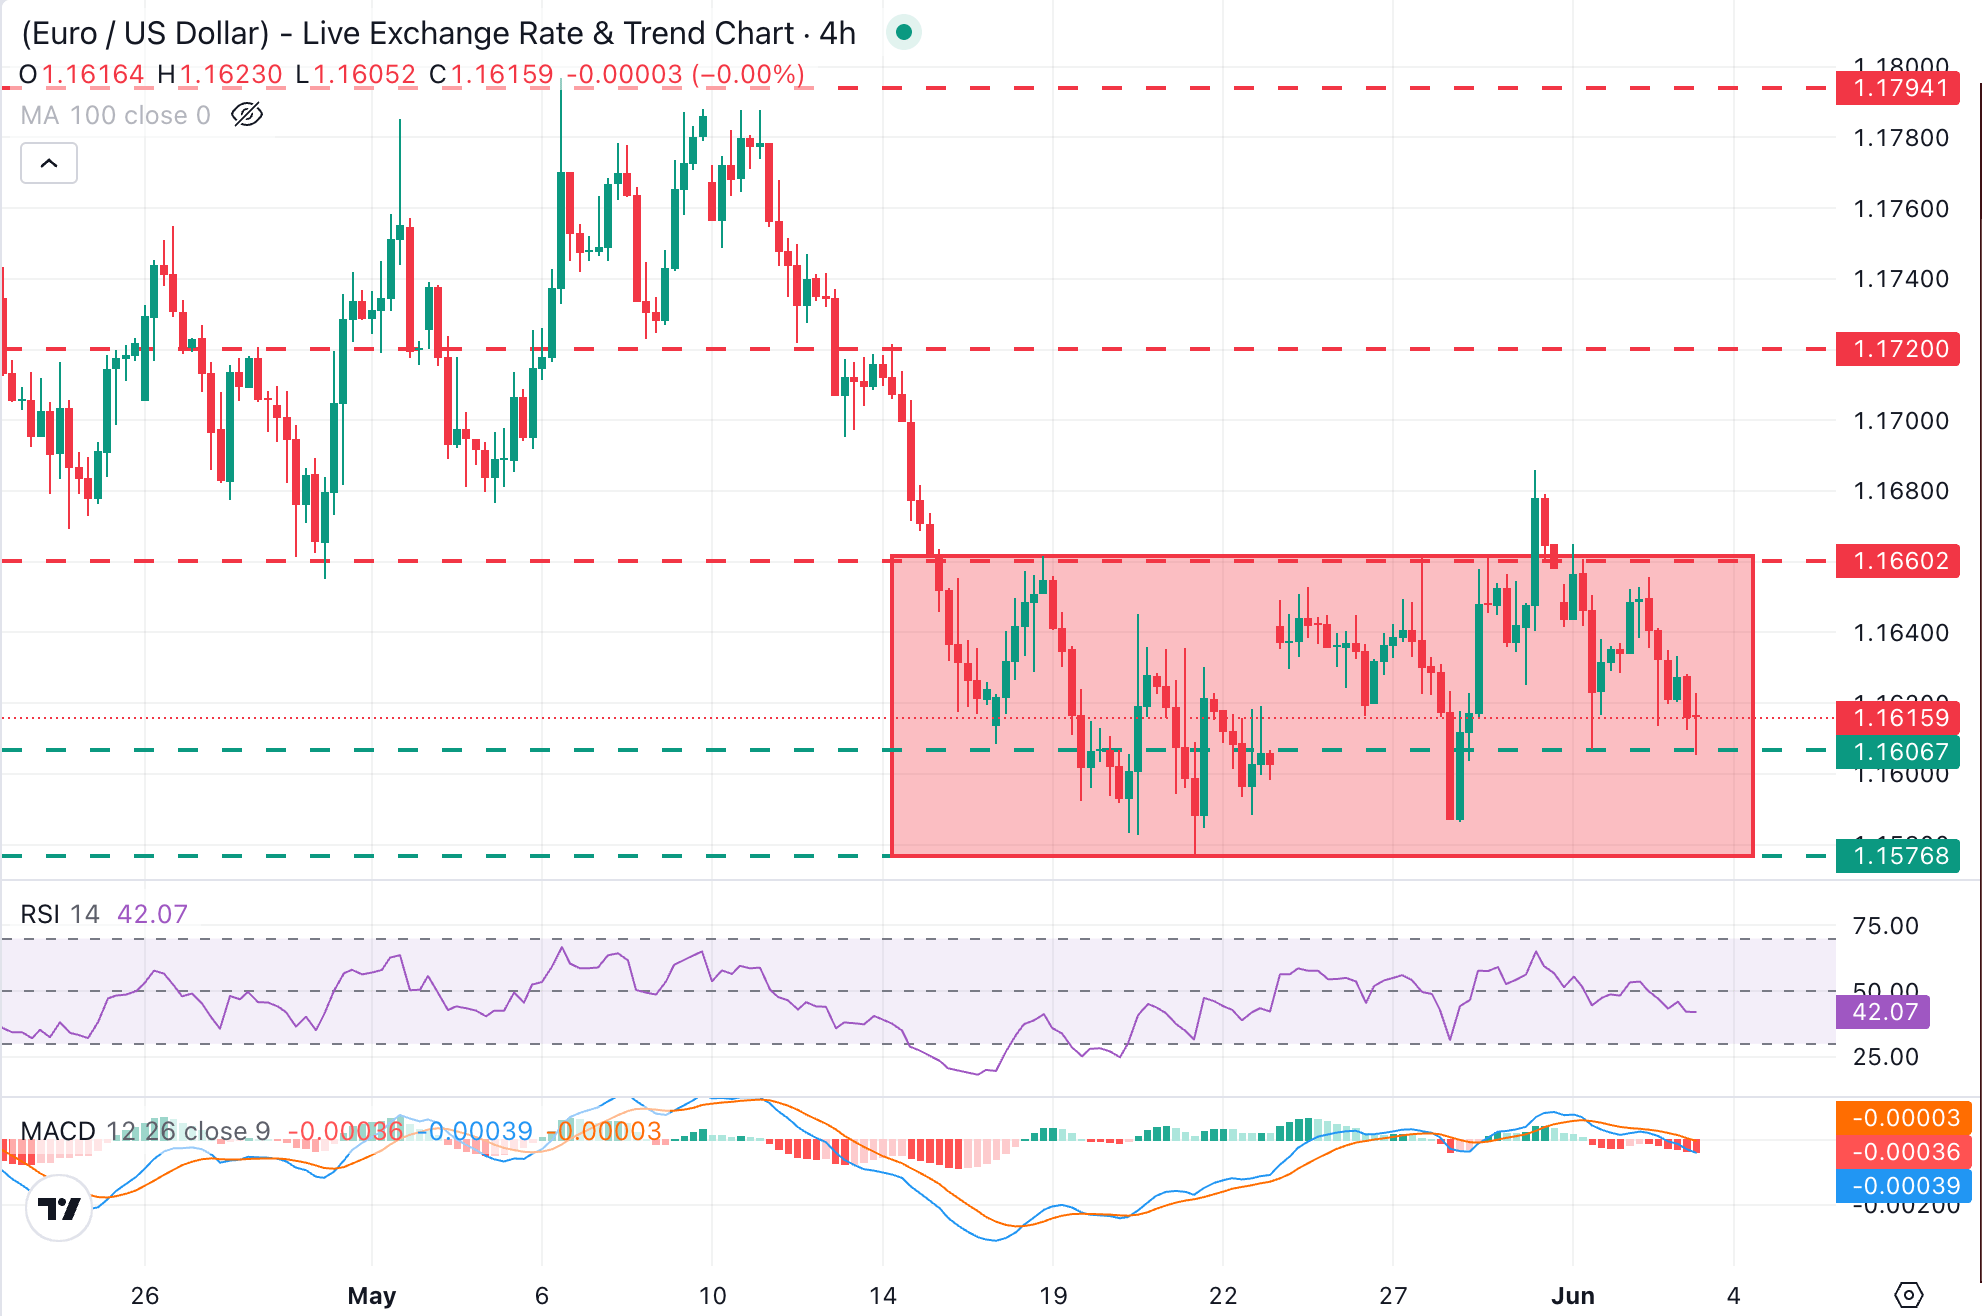
EUR/USD trades at 1.1615 amid a negative near-term tone, with bears eyeing the 1.1600 support area. The pair remains trading within the last two weeks' range with momentum indicators reinforcing the soft bias. The 4-hour Relative Strength Index (RSI) is lingering just below the 50 line, and the Moving Average Convergence Divergence (MACD) shows growing bearish pressure.
A confirmation below the 1.1600 area, which contained downside attempts on Monday, and is holding bears so far on Wednesday, would bring the bottom of the range, at the 1.1570 level (May 21 low), back to the focus. Further down, April's bottom at the 1.1505-1.1525 area emerges as the next target.
On the topside, the 1.1660 area has been capping upside attempts since mid-May and is likely to test potential bullish reversals. Above that level, the next targets are the May 14 high, at 1.1720, and May's peak, in the 1.1790 area.
(The technical analysis of this story was written with the help of an AI tool.)
Euro Price Today
The table below shows the percentage change of Euro (EUR) against listed major currencies today. Euro was the strongest against the New Zealand Dollar.
| USD | EUR | GBP | JPY | CAD | AUD | NZD | CHF | |
|---|---|---|---|---|---|---|---|---|
| USD | 0.14% | 0.13% | -0.08% | 0.08% | 0.14% | 0.47% | 0.25% | |
| EUR | -0.14% | -0.02% | -0.20% | -0.06% | -0.00% | 0.34% | 0.12% | |
| GBP | -0.13% | 0.02% | -0.17% | -0.06% | 0.00% | 0.33% | 0.13% | |
| JPY | 0.08% | 0.20% | 0.17% | 0.12% | 0.18% | 0.48% | 0.30% | |
| CAD | -0.08% | 0.06% | 0.06% | -0.12% | 0.06% | 0.40% | 0.18% | |
| AUD | -0.14% | 0.00% | -0.01% | -0.18% | -0.06% | 0.32% | 0.10% | |
| NZD | -0.47% | -0.34% | -0.33% | -0.48% | -0.40% | -0.32% | -0.20% | |
| CHF | -0.25% | -0.12% | -0.13% | -0.30% | -0.18% | -0.10% | 0.20% |
The heat map shows percentage changes of major currencies against each other. The base currency is picked from the left column, while the quote currency is picked from the top row. For example, if you pick the Euro from the left column and move along the horizontal line to the US Dollar, the percentage change displayed in the box will represent EUR (base)/USD (quote).

Mais de um milhão de usuários confiam na FXStreet para dados de mercado em tempo real, ferramentas de gráficos, insights de especialistas e notícias de Forex. Seu calendário econômico abrangente e webinars educacionais ajudam os traders a se manterem informados e tomarem decisões calculadas. A FXStreet conta com uma equipe de cerca de 60 profissionais, divididos entre a sede em Barcelona e diversas regiões globais.
Ler mais


