
EUR/USD Price Forecasts: Nearing yearly lows at 1.1330 ahead of US Inflation figures
Por Guillermo Alcala
Atualizado: 25 Jun 2026


ARTIGOS POPULARES

The Euro (EUR) trades lower against the US Dollar (USD) for the fourth consecutive day on Thursday, as investors’ hopes of Federal Reserve (Fed) rate hikes drive markets ahead of the release of the US Personal Consumption Expenditures (PCE) Price Index.
- EUR/USD remains on its back foot after a 4-day sell-off, with 1.1330 lows in the bears' focus.
- US PCE Prices Index data is expected to back Fed tightening hopes.
- The Euro consolidates losses after reaching oversold levels, with the bearish trend intact.
The Euro (EUR) trades lower against the US Dollar (USD) for the fourth consecutive day on Thursday, as investors’ hopes of Federal Reserve (Fed) rate hikes drive markets ahead of the release of the US Personal Consumption Expenditures (PCE) Price Index. The EUR/USD pair trades at 1.1345 at the time of writing, with the 13-month low of 1.1330 dangerously close.
The market consensus anticipates a further acceleration of price pressures in May, which would endorse hopes of Fed monetary tightening later this year. Headline PCE inflation is seen growing to a three-year high of 4.1%, from 3.8% in April, with the core reading seen up to 3.4% in the 12 months to May, from 3.3% in the previous month.
In the Eurozone, the German GfK Consumer Confidence Survey for July posted a weaker-than-expected recovery and reported less willingness to buy, with a majority of respondents expecting the economic outlook to deteriorate further this year. The data failed to provide any significant support to the Euro.
Technical Analysis: Consolidating losses amid a strong bearish trend
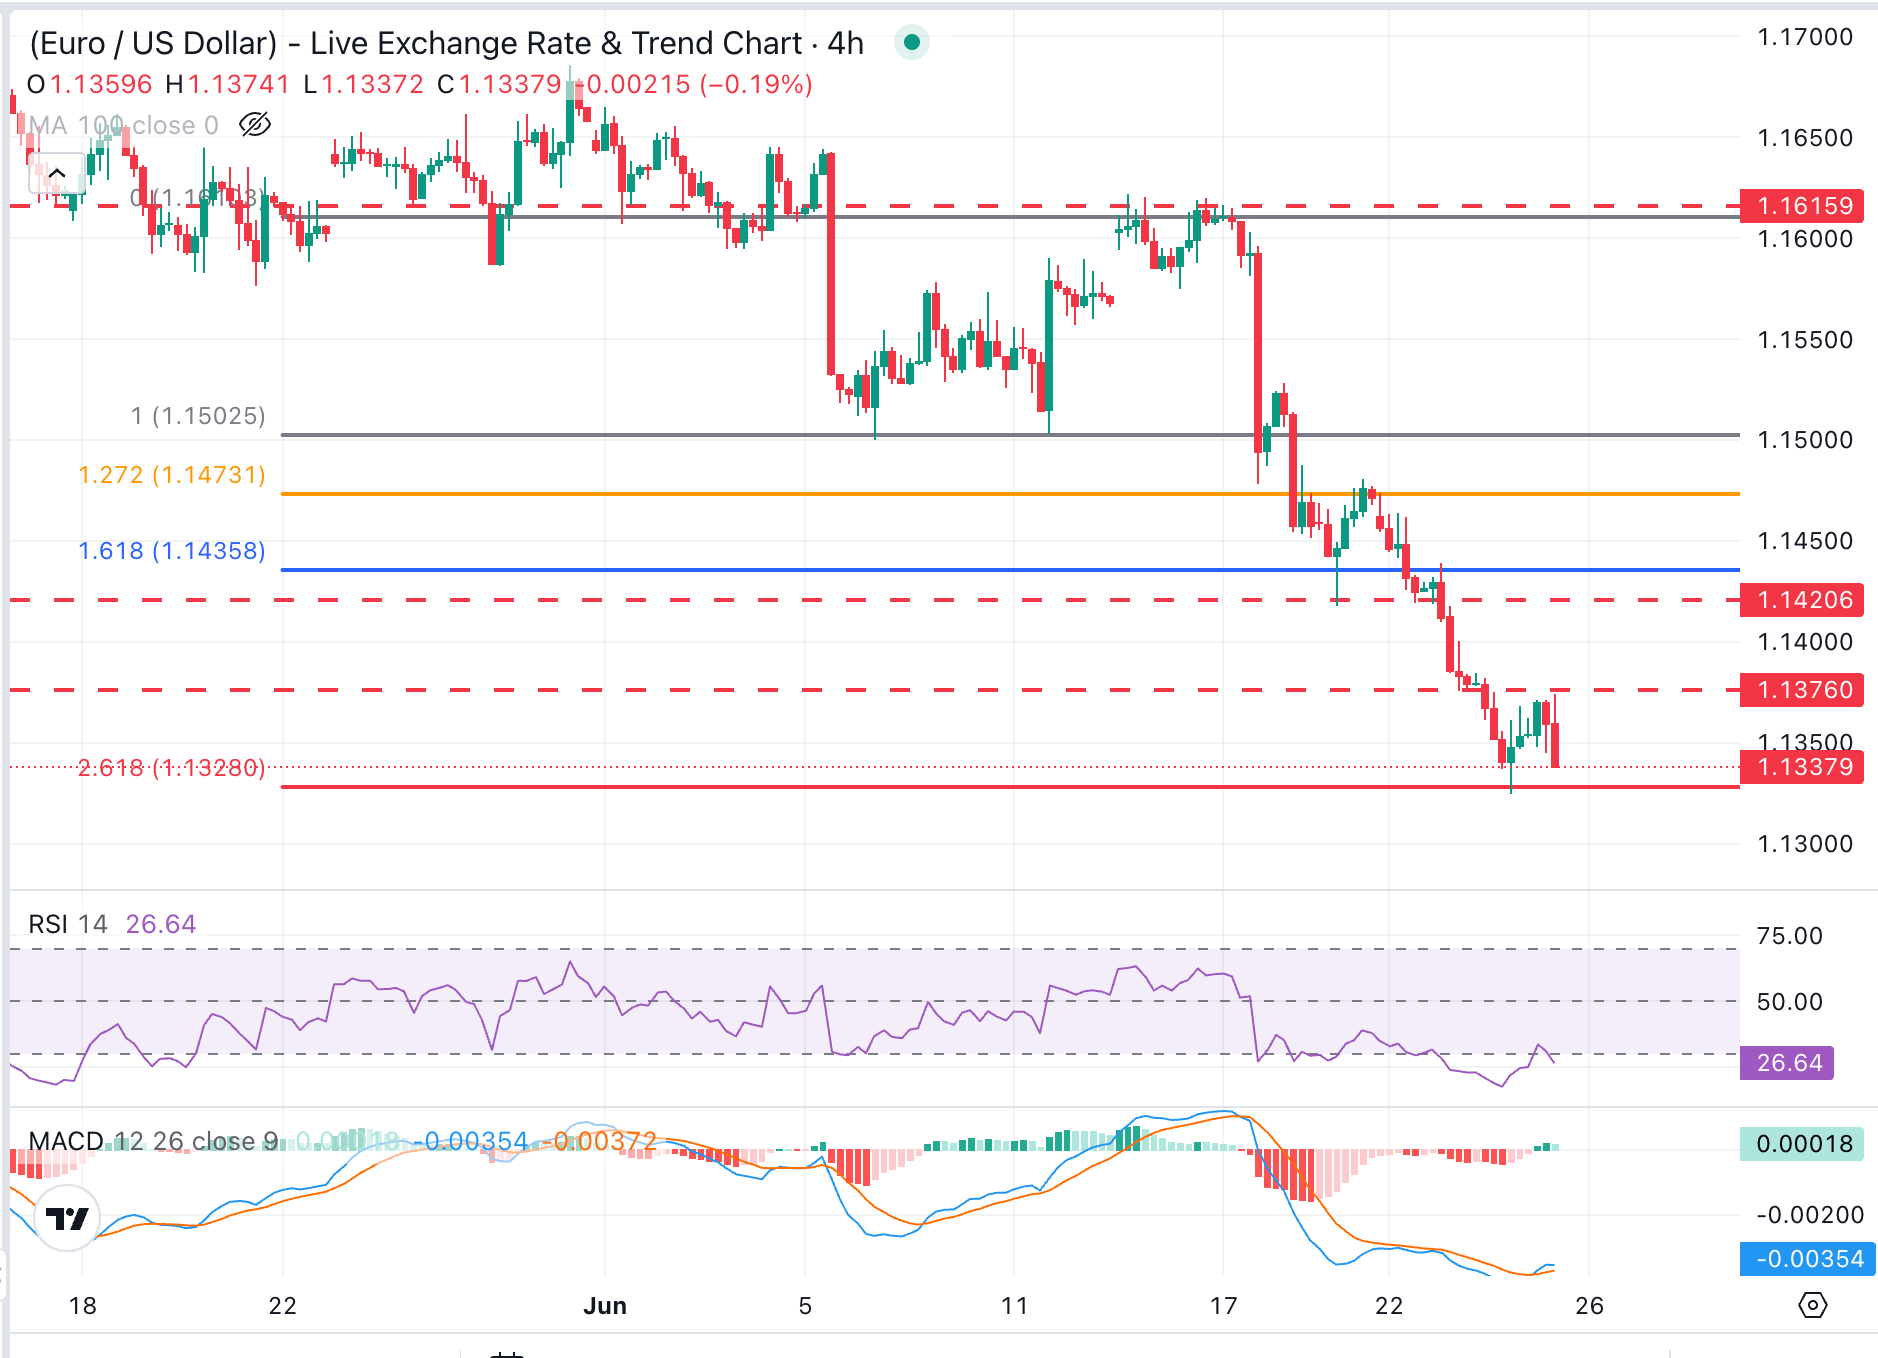
EUR/USD trades at 1.1337, extending a bearish near-term bias after dropping about 2.3% in just over a week. The pair has been consolidating gains as the 4-hour Relative Strength Index (14) picks up from extremely oversold levels, while the Moving Average Convergence Divergence (MACD), hovering near zero, reveals that upside attempts remain shallow.
The Euro has found support at the 261.8% Fibonacci retracement of the June 11-17 rally, at 1.1330. Below here, the 1.1300 psychological level might provide support ahead of the 1.1220 area, where the late May 2025 lows meet the 316.8% retracement of the mentioned cycle.
Upside attempts, on the contrary, have been contained above the 1.1370 area, which, so far, is closing the way towards a previous resistance-turned-support, around 1.1520, and the June 19 high, at 1.1480.
(The technical analysis of this story was written with the help of an AI tool.)
US Dollar Price Today
The table below shows the percentage change of US Dollar (USD) against listed major currencies today. US Dollar was the strongest against the Euro.
| USD | EUR | GBP | JPY | CAD | AUD | NZD | CHF | |
|---|---|---|---|---|---|---|---|---|
| USD | 0.21% | 0.06% | 0.05% | 0.07% | 0.11% | 0.20% | 0.07% | |
| EUR | -0.21% | -0.11% | -0.11% | -0.12% | -0.07% | 0.03% | -0.12% | |
| GBP | -0.06% | 0.11% | 0.00% | 0.03% | 0.05% | 0.16% | -0.00% | |
| JPY | -0.05% | 0.11% | 0.00% | 0.01% | 0.05% | 0.13% | -0.01% | |
| CAD | -0.07% | 0.12% | -0.03% | -0.01% | 0.03% | 0.14% | -0.03% | |
| AUD | -0.11% | 0.07% | -0.05% | -0.05% | -0.03% | 0.09% | -0.03% | |
| NZD | -0.20% | -0.03% | -0.16% | -0.13% | -0.14% | -0.09% | -0.17% | |
| CHF | -0.07% | 0.12% | 0.00% | 0.00% | 0.03% | 0.03% | 0.17% |
The heat map shows percentage changes of major currencies against each other. The base currency is picked from the left column, while the quote currency is picked from the top row. For example, if you pick the US Dollar from the left column and move along the horizontal line to the Japanese Yen, the percentage change displayed in the box will represent USD (base)/JPY (quote).

Mais de um milhão de usuários confiam na FXStreet para dados de mercado em tempo real, ferramentas de gráficos, insights de especialistas e notícias de Forex. Seu calendário econômico abrangente e webinars educacionais ajudam os traders a se manterem informados e tomarem decisões calculadas. A FXStreet conta com uma equipe de cerca de 60 profissionais, divididos entre a sede em Barcelona e diversas regiões globais.
Ler mais


