
Gold Price Forecast: XAU/USD hovers near YTD lows at $3,941 weighed by higher US yields
Por Guillermo Alcala
Atualizado: 1 Jul 2026


ARTIGOS POPULARES

Gold (XAU/USD) extends losses for the fourth consecutive day on Wednesday, hitting session lows at $3,960, with the year-to-date lows at $3,945 within a short distance.
- Gold remains depressed below $4,000 amid bright US data and Fed hiking bets.
- US Treasury yields jumped on Tuesday following bright job openings data.
- XAU/USD is not giving signs of a trend shift despite bullish divergence in RSI charts.
Gold (XAU/USD) extends losses for the fourth consecutive day on Wednesday, hitting session lows at $3,960, with the year-to-date lows at $3,945 within a short distance. Technical indicators show softer bearish momentum, but the strong US Job Openings figures reported on Tuesday and higher US Treasury yields are acting as headwinds to precious metal rallies.
Bullion is struggling on Wednesday amid its inverse correlation with US Treasury yields, which jumped on Tuesday after Job Openings data showed their highest level in two years in May. This confirms the recovery of the US labour market, and provides further reasons for the Federal Reserve (Fed) to hike interest rates in the coming months.
Later on Wednesday, the ADP Employment report is expected to show that job creation remained at healthy levels in June. These figures are likely to frame the speech of Fed Chairman Kevin Warsh at the European Central Bank summit in Sintra, Portugal, although the new Fed chief seems more reluctant than his predecessor, Jerome Powell, to signal any specific rate path.
Technical Analysis: Consolidating at YTD lows around $4,000
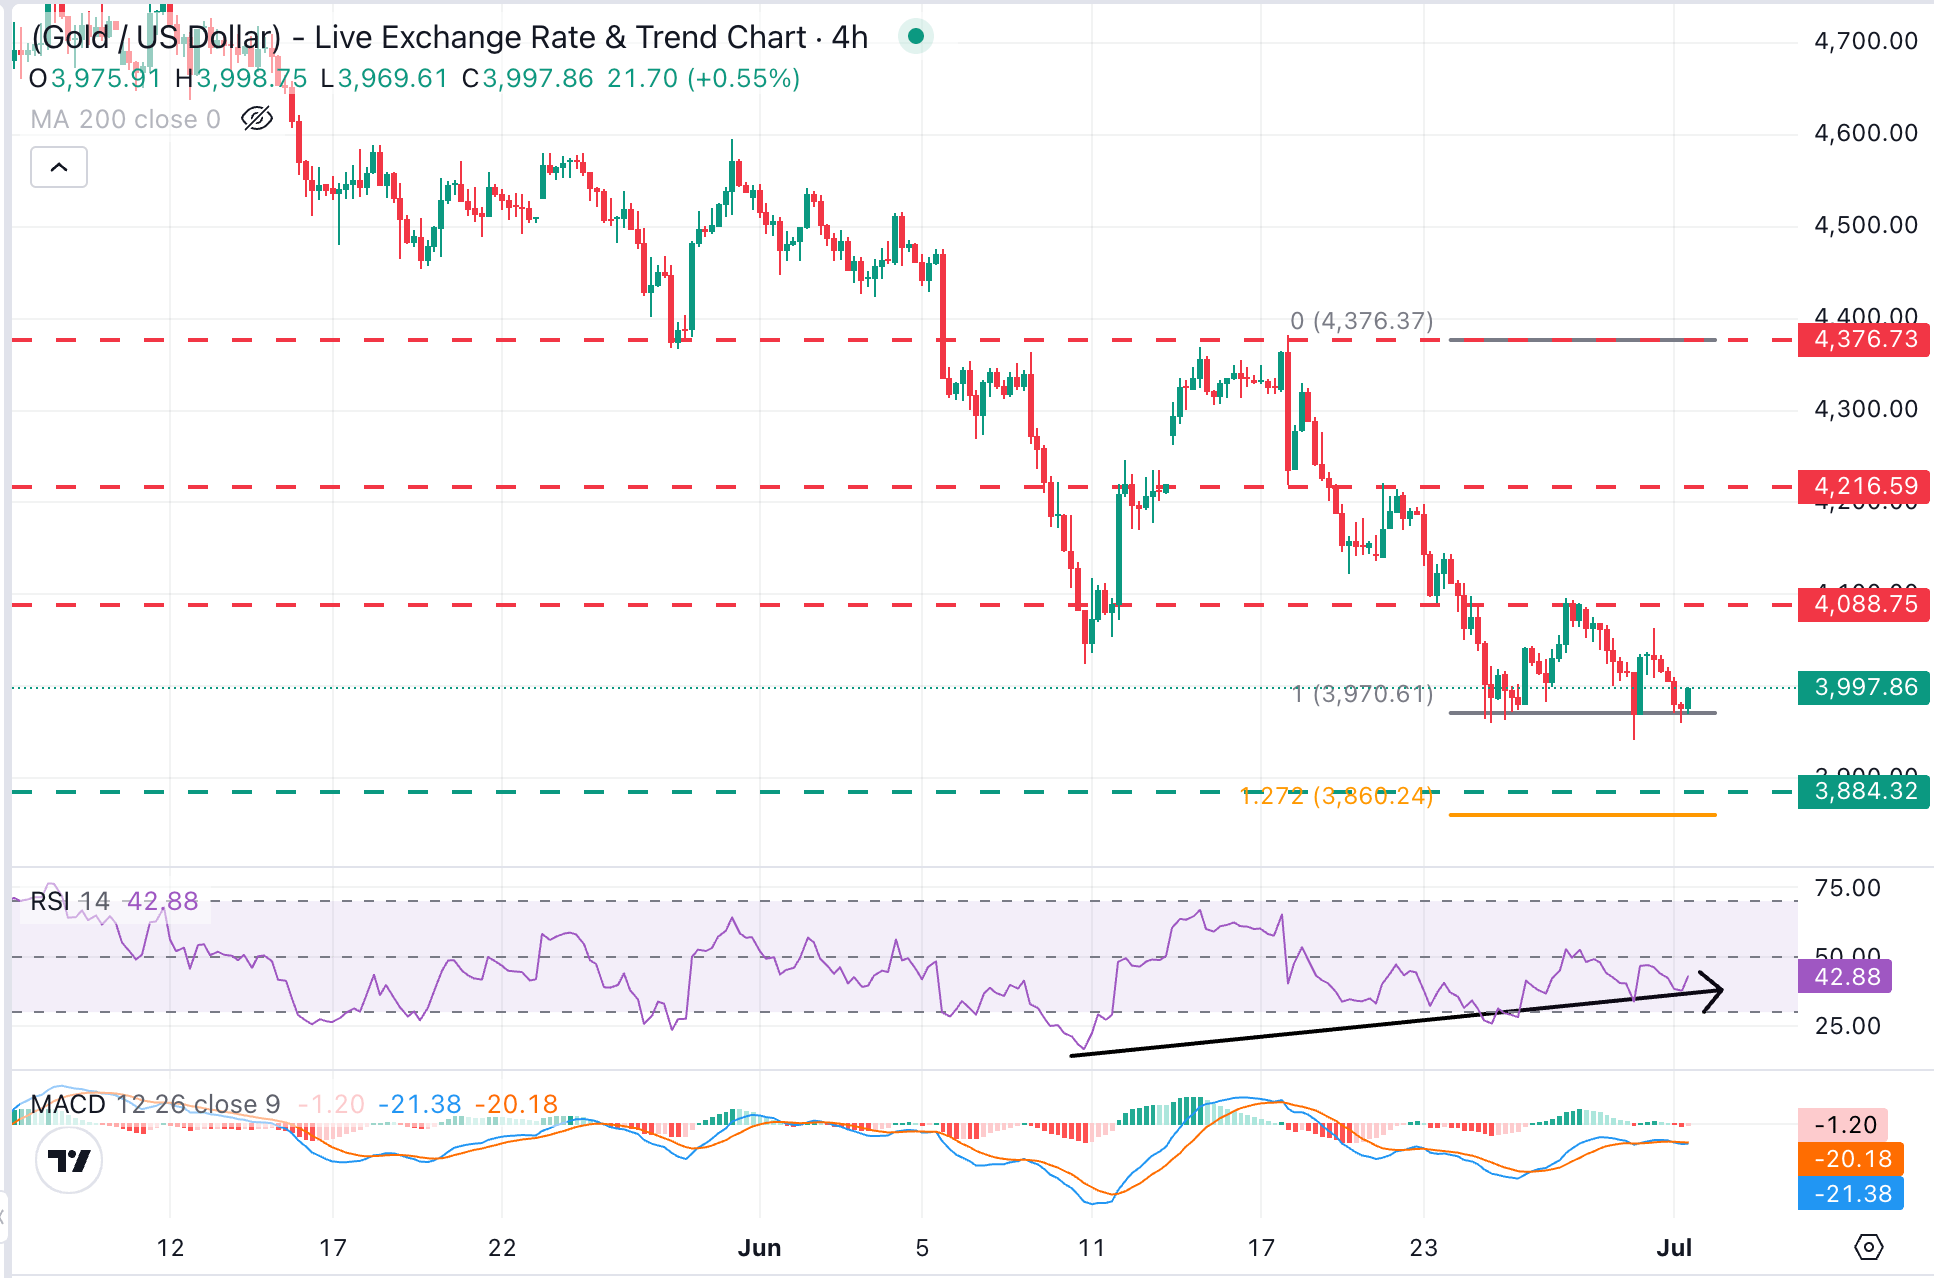
XAU/USD keeps trading in a choppy and sideways manner, both sides of the $4,000 level, after hitting fresh seven-month lows at $$3,941 on Tuesday. Bearish momentum is fading, but the pair is not giving signs of a trend shift, other than the bearish divergence in the Relative Strength Index (RSI). The four-hour Moving Average Convergence Divergence (MACD) indicator hovers slightly negative, hinting that any recovery attempts could struggle.
Bears remain contained above last week's lows in the area of $3,970, despite Tuesday's journey to $3,941. A clear break below these levels would expose the area between late October 2025 lows, at $3,886, and the 127,2% Fibonacci extension of the mid-June downleg, at $3,860.
Bulls, on the other hand, are likely to be challenged in the area between the intra-week highs, near $4,060, and Friday's high of $4,096. Further up, the June 17 low and June 22 high in the area of $4,215 will come into focus.
(The technical analysis of this story was written with the help of an AI tool.)
Gold FAQs
Gold has played a key role in human’s history as it has been widely used as a store of value and medium of exchange. Currently, apart from its shine and usage for jewelry, the precious metal is widely seen as a safe-haven asset, meaning that it is considered a good investment during turbulent times. Gold is also widely seen as a hedge against inflation and against depreciating currencies as it doesn’t rely on any specific issuer or government.
Central banks are the biggest Gold holders. In their aim to support their currencies in turbulent times, central banks tend to diversify their reserves and buy Gold to improve the perceived strength of the economy and the currency. High Gold reserves can be a source of trust for a country’s solvency. Central banks added 1,136 tonnes of Gold worth around $70 billion to their reserves in 2022, according to data from the World Gold Council. This is the highest yearly purchase since records began. Central banks from emerging economies such as China, India and Turkey are quickly increasing their Gold reserves.
Gold has an inverse correlation with the US Dollar and US Treasuries, which are both major reserve and safe-haven assets. When the Dollar depreciates, Gold tends to rise, enabling investors and central banks to diversify their assets in turbulent times. Gold is also inversely correlated with risk assets. A rally in the stock market tends to weaken Gold price, while sell-offs in riskier markets tend to favor the precious metal.
The price can move due to a wide range of factors. Geopolitical instability or fears of a deep recession can quickly make Gold price escalate due to its safe-haven status. As a yield-less asset, Gold tends to rise with lower interest rates, while higher cost of money usually weighs down on the yellow metal. Still, most moves depend on how the US Dollar (USD) behaves as the asset is priced in dollars (XAU/USD). A strong Dollar tends to keep the price of Gold controlled, whereas a weaker Dollar is likely to push Gold prices up.

Mais de um milhão de usuários confiam na FXStreet para dados de mercado em tempo real, ferramentas de gráficos, insights de especialistas e notícias de Forex. Seu calendário econômico abrangente e webinars educacionais ajudam os traders a se manterem informados e tomarem decisões calculadas. A FXStreet conta com uma equipe de cerca de 60 profissionais, divididos entre a sede em Barcelona e diversas regiões globais.
Ler mais


