
Hyperliquid Price Forecast: HYPE risks further losses as demand wanes
Por Vishal Dixit
Data de Publicação: 9 Dec 2025 | Data de Modificação: 9 Dec 2025


ARTIGOS POPULARES

Hyperliquid (HYPE) edges lower by 3% at press time on Tuesday, extending the downtrend for the sixth consecutive day. Derivatives data support the bearish outlook as risk-off sentiment spreads among traders, driven by heavy long liquidations.
- Hyperliquid is down 3% on Tuesday, extending its decline below $30.
- Derivatives data suggest a significant decline in demand as Open Interest wanes amid sharp long liquidations.
- The technical outlook for HYPE remains bearish after the Death Cross pattern between two crucial moving averages.
Hyperliquid (HYPE) edges lower by 3% at press time on Tuesday, extending the downtrend for the sixth consecutive day. Derivatives data support the bearish outlook as risk-off sentiment spreads among traders, driven by heavy long liquidations. The technical outlook remains bearish, suggesting a decline to $20.
Demand dries up in derivatives markets
Hyperliquid is losing retail interest as the broader cryptocurrency market dries up ahead of the US Federal Reserve’s (Fed) potential rate cut on Wednesday. CoinGlass data shows that the HYPE futures Open Interest (OI) is down 5.91% in the last 24 hours to $1.44 billion. This indicates a significant liquidity loss in HYPE derivatives as traders adopt a wait-and-watch strategy.
Along the same lines, the long liquidations over the last 24 hours totaled $1.28 million, outpacing short liquidations of $88,160.

Hyperliquid could target $20 as selling pressure grows
Hyperliquid extends a bearish reversal from the resistance trendline formed by connecting the October 30 and November 18 highs on the daily chart. At the time of writing, HYPE trades below $30 on Tuesday, exceeding the November 22 low at $29.37.
A decisive close below this level could extend the decline to the S1 Pivot Point at $26.03, followed by the October 10 low at $20.84.
On a more bearish note, the 50-day Exponential Moving Average (EMA) crossed below the 200-day EMA on Thursday, signaling a fresh bearish trend as short-term selling outpaces the prevailing trend.
Other technical indicators bolster the bearish case, including the Relative Strength Index (RSI) at 34, which is slipping toward the oversold zone, suggesting a sell-side dominance. Meanwhile, the Moving Average Convergence Divergence (MACD) indicates a rise in bearish momentum as the average lines descend into the negative territory after a crossover on Saturday.
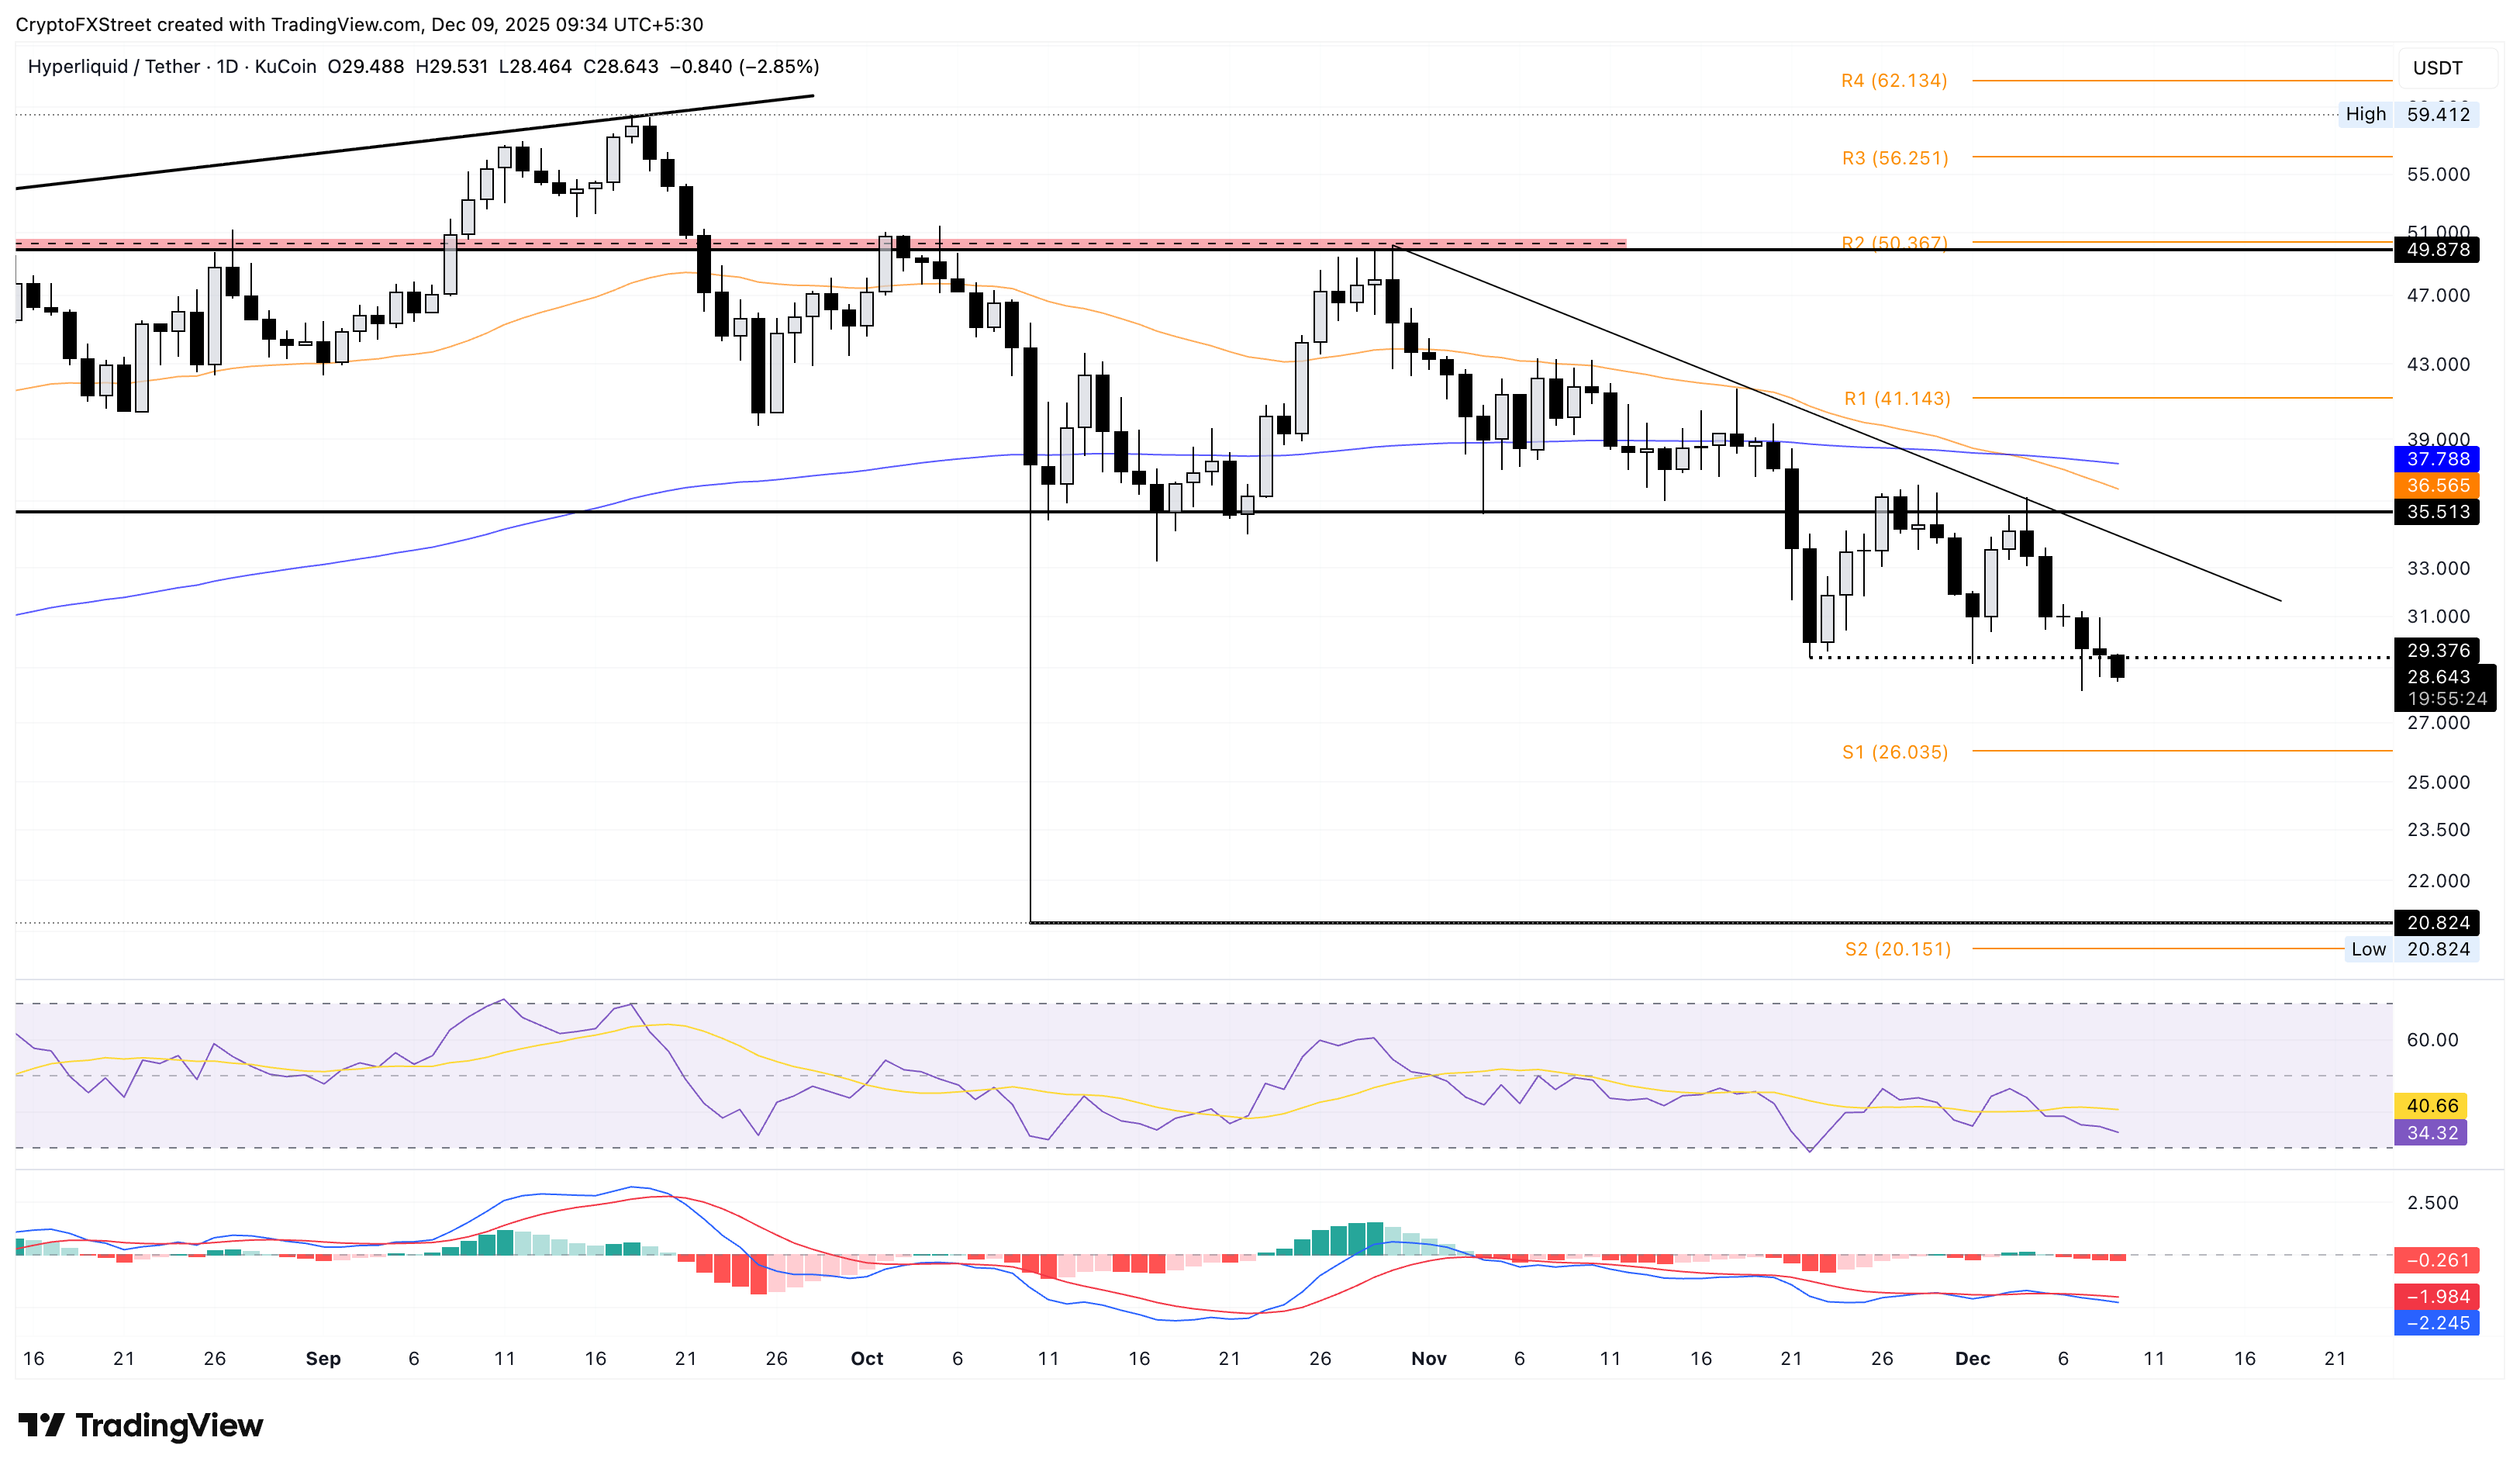
To reinstate an uptrend, the HYPE token should surface above $30 to challenge the resistance trendline near $34.00.

Mais de um milhão de usuários confiam na FXStreet para dados de mercado em tempo real, ferramentas de gráficos, insights de especialistas e notícias de Forex. Seu calendário econômico abrangente e webinars educacionais ajudam os traders a se manterem informados e tomarem decisões calculadas. A FXStreet conta com uma equipe de cerca de 60 profissionais, divididos entre a sede em Barcelona e diversas regiões globais.
Ler mais


