
NZD/USD Price Forecast: Kiwi hits fresh YTD lows below 0.5650 as the US Dollar soars
Por Guillermo Alcala
Atualizado: 24 Jun 2026


ARTIGOS POPULARES

The New Zealand Dollar (NZD) is failing to find a bottom as rising hopes of monetary tightening by the US Federal Reserve (Fed) and dismal market mood are boosting the safe-haven US Dollar (USD) on Wednesday.
- NZD/USD depreciates 5.3% in the last six days and hits fresh seven-month highs below 0.5650.
- A selloff in stock markets and rising hopes of Fed rate hikes are boosting the US Dollar this week.
- The measured target of May's double top, at 0.5625, might provide some support for the Kiwi.
The New Zealand Dollar (NZD) is failing to find a bottom as rising hopes of monetary tightening by the US Federal Reserve (Fed) and dismal market mood are boosting the safe-haven US Dollar (USD) on Wednesday. The pair trades at seven-month lows at 0.5640 on Wednesday after a 3.2% sell-off in the last six days.
The risk-sensitive Kiwi remains under strong bearish pressure, weighed by the risk-off sentiment: Investors’ concerns about overspending in AI have triggered a sharp sell-off in tech shares, raising questions about the consequences of the AI bubble burst in a global economy still in shock amid the Middle East conflict.
Beyond that, the solid US macroeconomic figures and the stubbornly high inflation have prompted Fed policymakers to adopt a more hawkish rhetoric and traders to brace for upcoming rate hikes. All in all, an ideal background for the US Dollar, which has propelled the USD Index to 13-month highs.
Technical Analysis: Kiwi might find support above the 0.5600 line
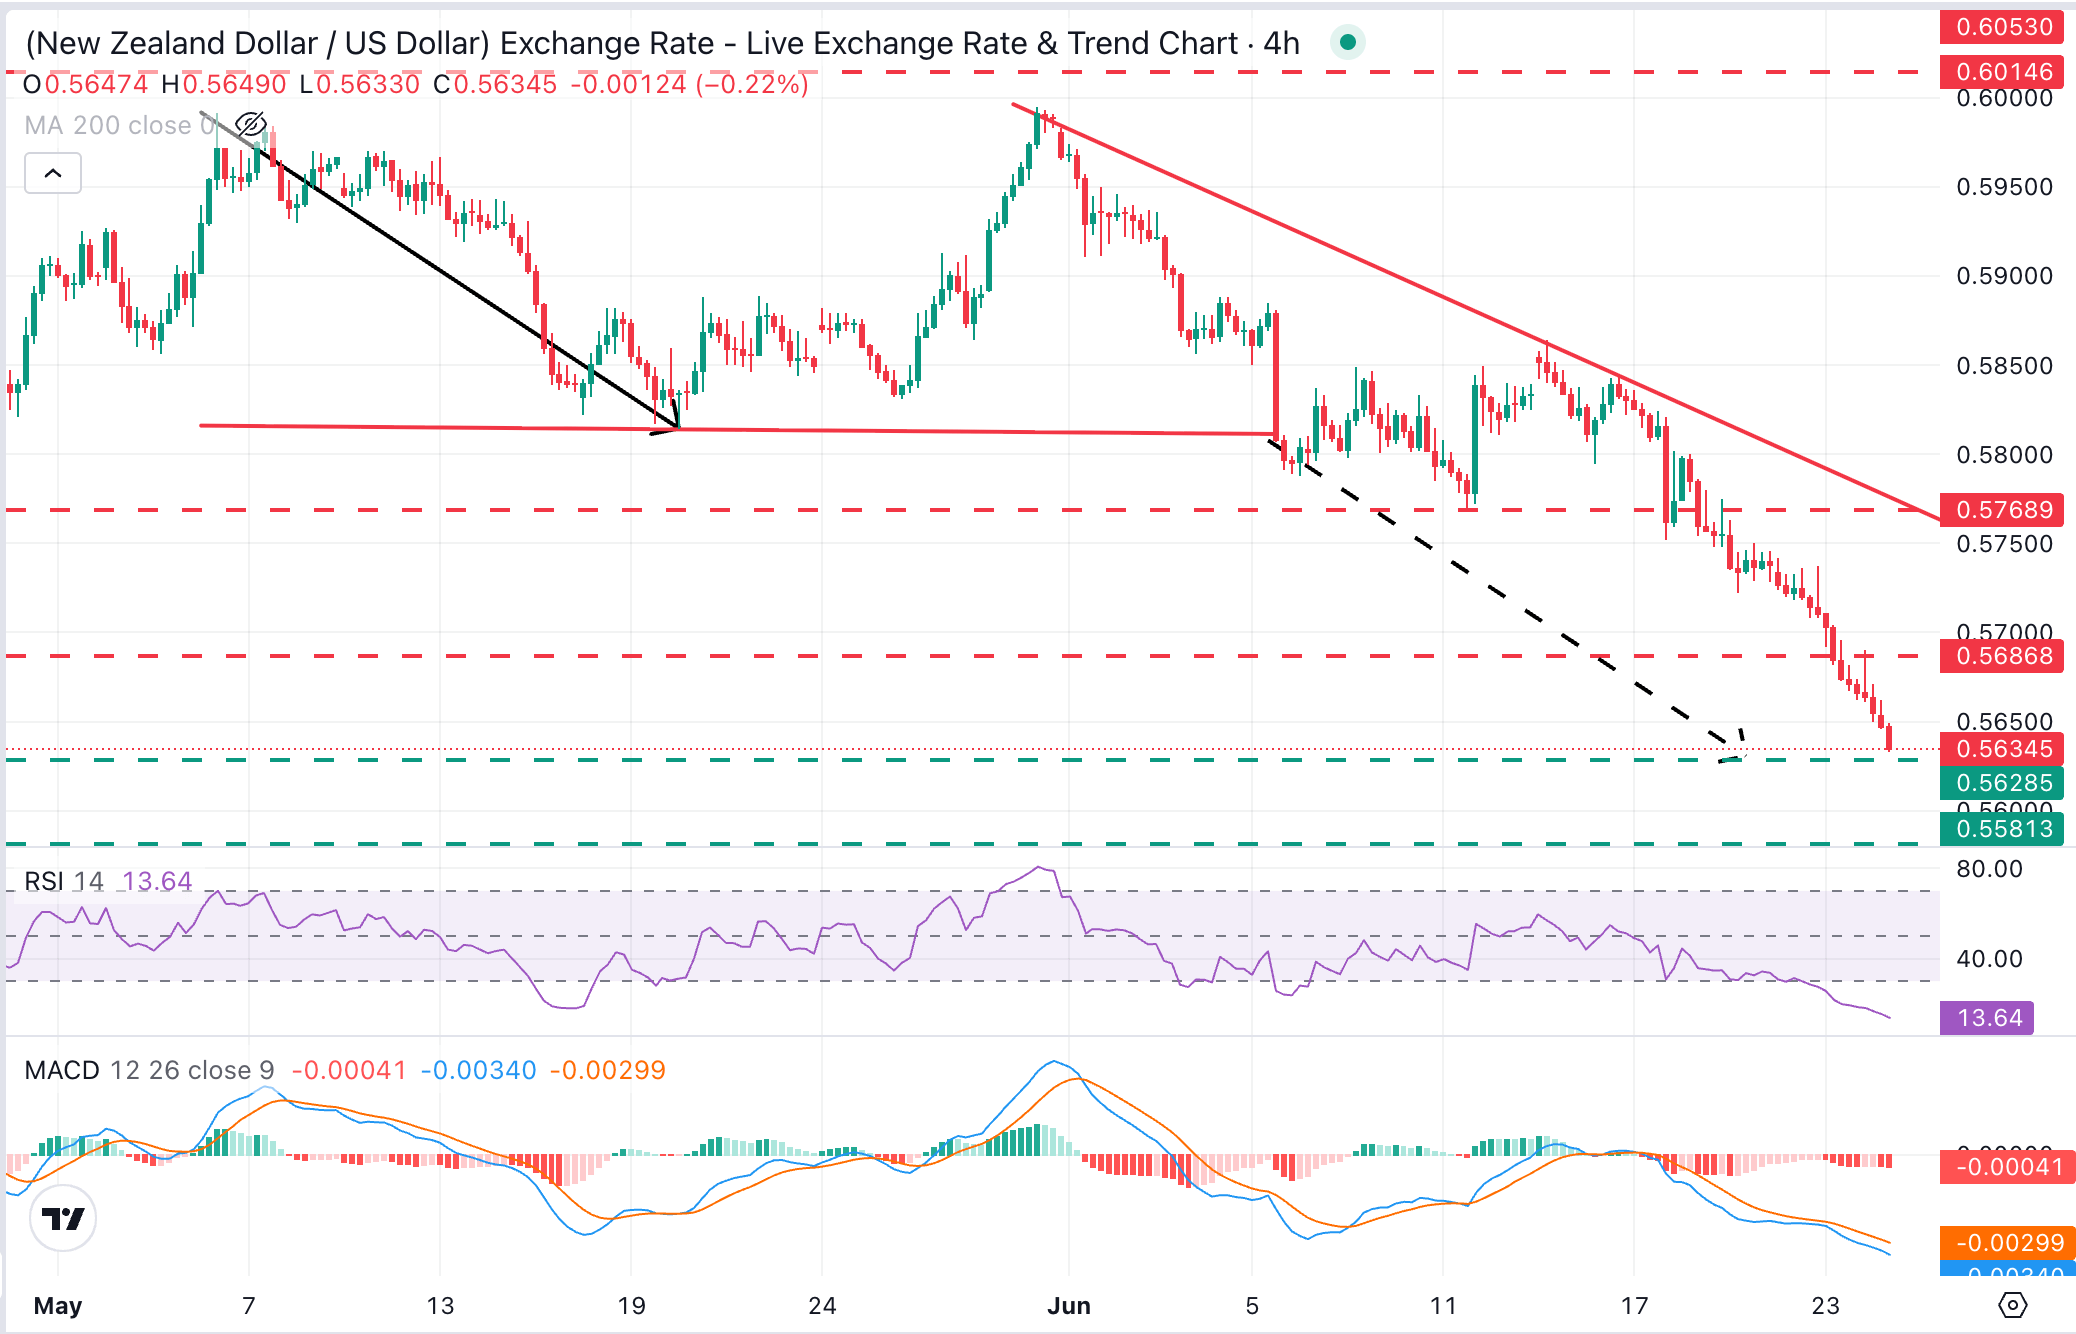
NZD/USD trades at 0.5639, extending a clear bearish phase, yet with momentum indicators showing heavily oversold levels. The Relative Strength Index, around 14, and the Moving Average Convergence Divergence (MACD) line holding below zero with a flat, negative profile, suggest that scope for a corrective rebound is building.
Bears are nearing the measured target of May's double top at 0.5625 and the 0.5600 psychological level, where they might meet some support. In the current conditions, the next bearish target, at the November 2025 low of 0.5584, seems out of reach for today. Upside attempts, on the contrary, are likely to be tested at the previous support area near 0.5685, ahead of the trendline resistance, now around 0.5770.
(The technical analysis of this story was written with the help of an AI tool.)
New Zealand Dollar Price Today
The table below shows the percentage change of New Zealand Dollar (NZD) against listed major currencies today. New Zealand Dollar was the strongest against the Australian Dollar.
| USD | EUR | GBP | JPY | CAD | AUD | NZD | CHF | |
|---|---|---|---|---|---|---|---|---|
| USD | 0.35% | 0.31% | 0.10% | 0.17% | 0.44% | 0.63% | 0.36% | |
| EUR | -0.35% | -0.05% | -0.26% | -0.19% | 0.08% | 0.24% | 0.01% | |
| GBP | -0.31% | 0.05% | -0.21% | -0.15% | 0.13% | 0.28% | 0.05% | |
| JPY | -0.10% | 0.26% | 0.21% | 0.07% | 0.34% | 0.48% | 0.25% | |
| CAD | -0.17% | 0.19% | 0.15% | -0.07% | 0.27% | 0.40% | 0.20% | |
| AUD | -0.44% | -0.08% | -0.13% | -0.34% | -0.27% | 0.15% | -0.10% | |
| NZD | -0.63% | -0.24% | -0.28% | -0.48% | -0.40% | -0.15% | -0.23% | |
| CHF | -0.36% | -0.01% | -0.05% | -0.25% | -0.20% | 0.10% | 0.23% |
The heat map shows percentage changes of major currencies against each other. The base currency is picked from the left column, while the quote currency is picked from the top row. For example, if you pick the New Zealand Dollar from the left column and move along the horizontal line to the US Dollar, the percentage change displayed in the box will represent NZD (base)/USD (quote).

Mais de um milhão de usuários confiam na FXStreet para dados de mercado em tempo real, ferramentas de gráficos, insights de especialistas e notícias de Forex. Seu calendário econômico abrangente e webinars educacionais ajudam os traders a se manterem informados e tomarem decisões calculadas. A FXStreet conta com uma equipe de cerca de 60 profissionais, divididos entre a sede em Barcelona e diversas regiões globais.
Ler mais


