
Pepe Price Forecast: PEPE remains muted despite Canary Capital’s PEPE ETF filing with the US SEC
Por Manish Chhetri
Atualizado: 9 Apr 2026


ARTIGOS POPULARES

Pepe (PEPE) price trades in red, below $0.0000036 at the time of writing on Thursday.
- Pepe price steadies at $0.000035 on Thursday after a mild recovery so far this week.
- Canary Capital filed an S-1 registration with the US SEC on Wednesday to launch a Canary Pepe ETF, signaling growing institutional interest.
- Mixed sentiment, with a slight bearish bias in on-chain and derivatives data, continues to cap PEPE’s upside potential.
Pepe (PEPE) price trades in red, below $0.0000036 at the time of writing on Thursday. Price action remained muted despite Canary Capital filing an S-1 registration with the US Securities and Exchange Commission (SEC) on Wednesday to launch a Canary Pepe Exchange-Traded Fund (ETF), highlighting increasing institutional attention toward meme coins. On-chain and derivatives data suggest cautious positioning among traders, capping the recovery of the meme coin.
Canary Capital files for Pepe ETF
Asset manager Canary Capital announced on Wednesday that it has filed an S-1 registration with the US SEC to launch a Canary Pepe ETF. This move highlights the growing institutional interest in the frog-themed meme coin.
A filing like this is generally considered a bullish sign for PEPE and its token price in the long term, as an ETF can make it easier for traditional investors to gain exposure to PEPE without needing to purchase and store the cryptocurrency directly. Moreover, approving an ETF could lend more legitimacy to PEPE and increase liquidity.
However, in the short term, the market failed to respond positively to this news, with Pepe’s price declining 4.58% on Wednesday and continuing its pullback as of writing on Thursday, as geopolitical uncertainty continues to drive broader market direction.
Mixed sentiment with a slight bearish bias
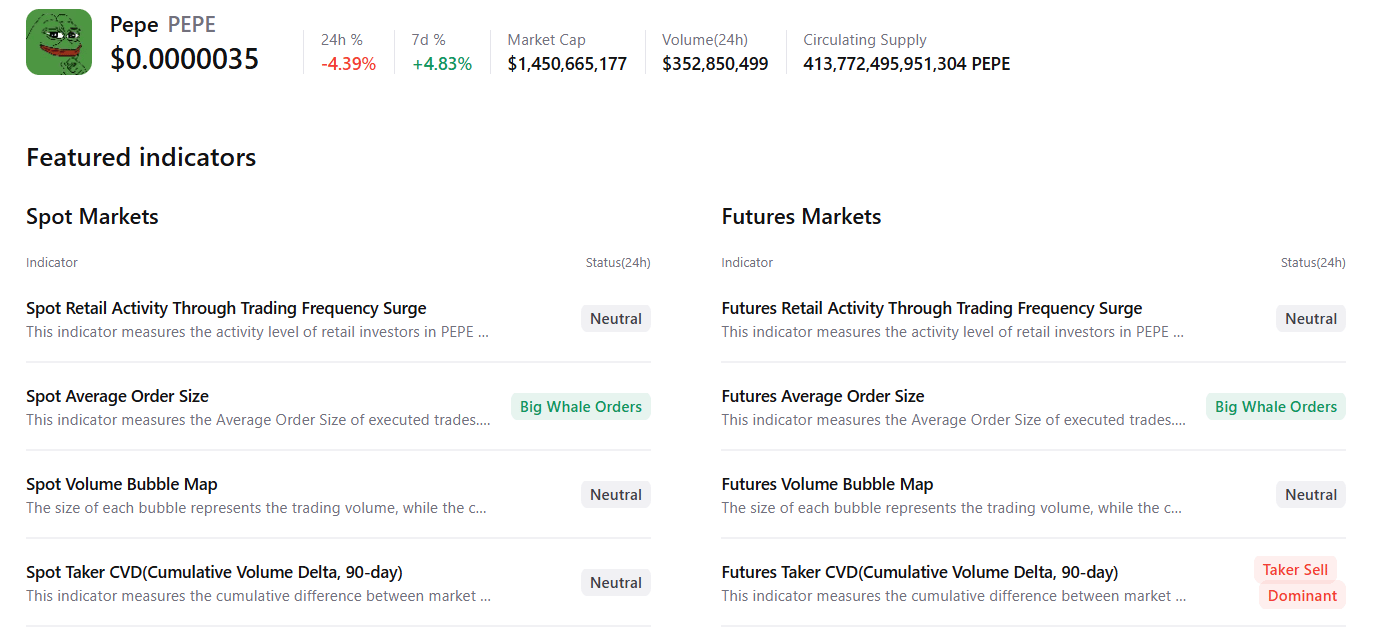
PEPE’s CryptoQuant summary data shows mixed conditions with early signs of bearishness. Activity across futures markets suggests sellers’ dominance, reflecting negative sentiment among investors. However, the presence of large whale orders in spot and futures markets suggests a slightly optimistic outlook for Pepe.
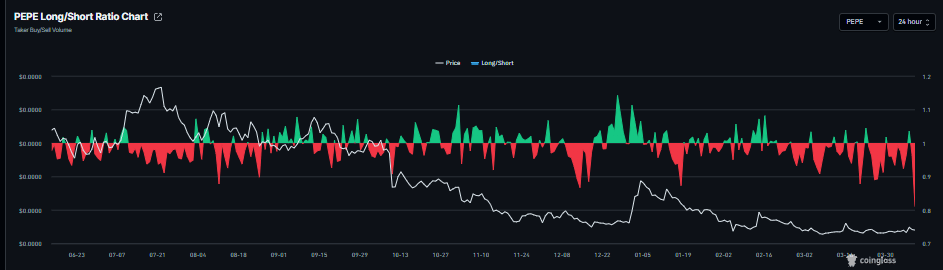
On the derivatives side, Pepe shows a negative outlook. CoinGlass data shows Pepe’s long-to-short ratio reads 0.81 on Thursday, the lowest level in over a month. This ratio, being below one, reflects bearish sentiment in the markets, as more traders are betting on the meme coin to fall.
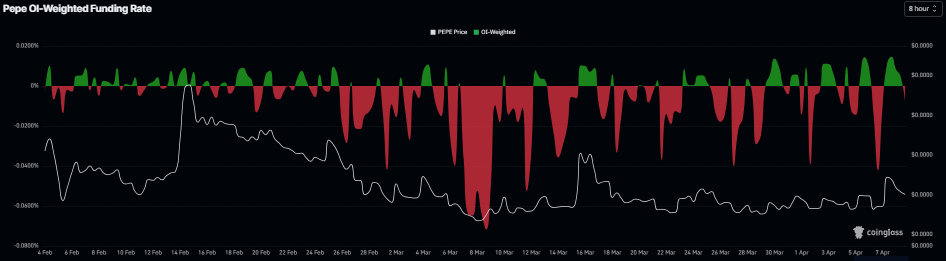
In addition, PEPE funding rates data has flipped to negative on Thursday, reading -0.0081%, indicating that shorts are paying the longs and projecting a bearish outlook.
Pepe Price Forecast: PEPE fails to hold the 50-day EMA
Pepe price rose over 11% on Tuesday, closing above the 50-day Exponential Moving Average (EMA) at $0.0000036. However, it failed to find support around this level and declined 4.58% the next day. As of Thursday, Pepe is continuing its pullback, trading below $0.0000036.
If PEPE continues to correct, it could extend the decline toward Tuesday’s low at $0.0000033. A close below this could extend the fall toward the February 6 low at $0.0000031.
The Relative Strength Index (RSI) on the daily chart reads 50, pointing downward toward the neutral level, indicating fading bullish momentum. However, the Moving Average Convergence Divergence (MACD) showed a bullish crossover last week, which remains intact, supporting a positive outlook.
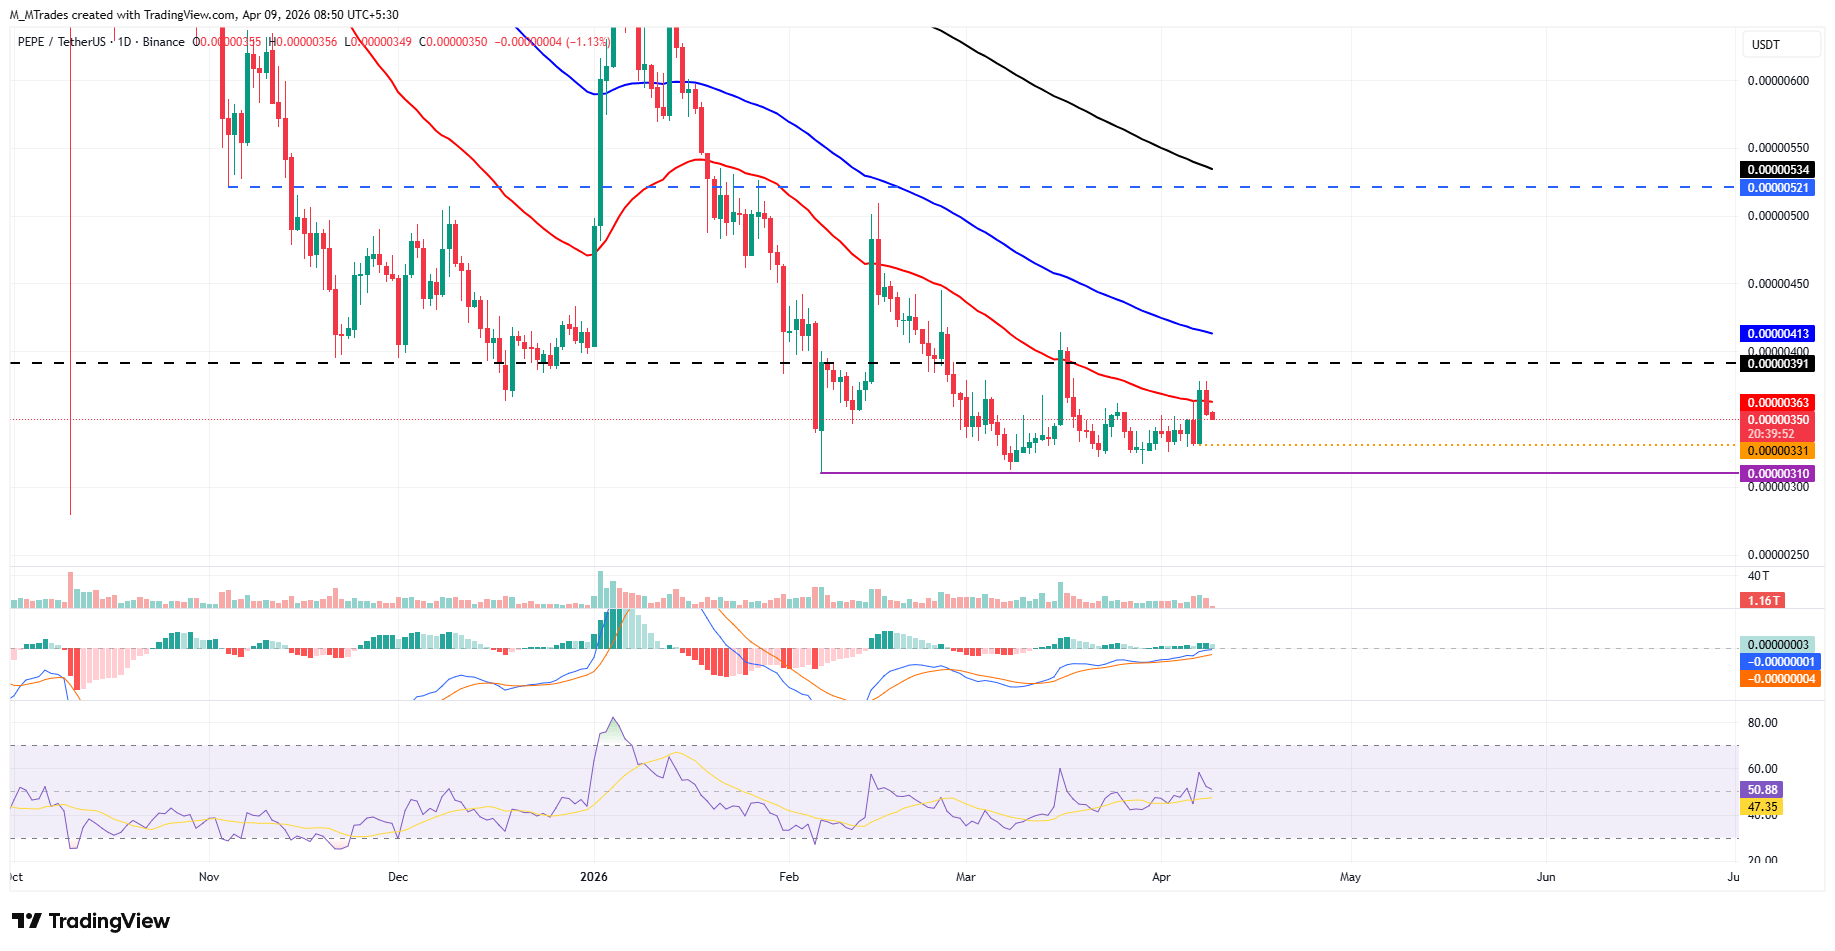
If PEPE recovers, it could extend the advance toward the 50-day EMA at $0.0000036.

Mais de um milhão de usuários confiam na FXStreet para dados de mercado em tempo real, ferramentas de gráficos, insights de especialistas e notícias de Forex. Seu calendário econômico abrangente e webinars educacionais ajudam os traders a se manterem informados e tomarem decisões calculadas. A FXStreet conta com uma equipe de cerca de 60 profissionais, divididos entre a sede em Barcelona e diversas regiões globais.
Ler mais


