
Pepe Price Forecast: PEPE stalls as on-chain, derivatives data flash bullish signals
Por Vishal Dixit
Data de Publicação: 9 Dec 2025 | Data de Modificação: 9 Dec 2025


ARTIGOS POPULARES

Pepe (PEPE) trades in the red on Tuesday after failing to secure a daily close above the $0.00000500 psychological level on Monday. The technical outlook remains mixed as the meme coin consolidates.
- Pepe is down 3% on Tuesday, following Monday's 7% rise, and is extending its consolidation below $0.00000500.
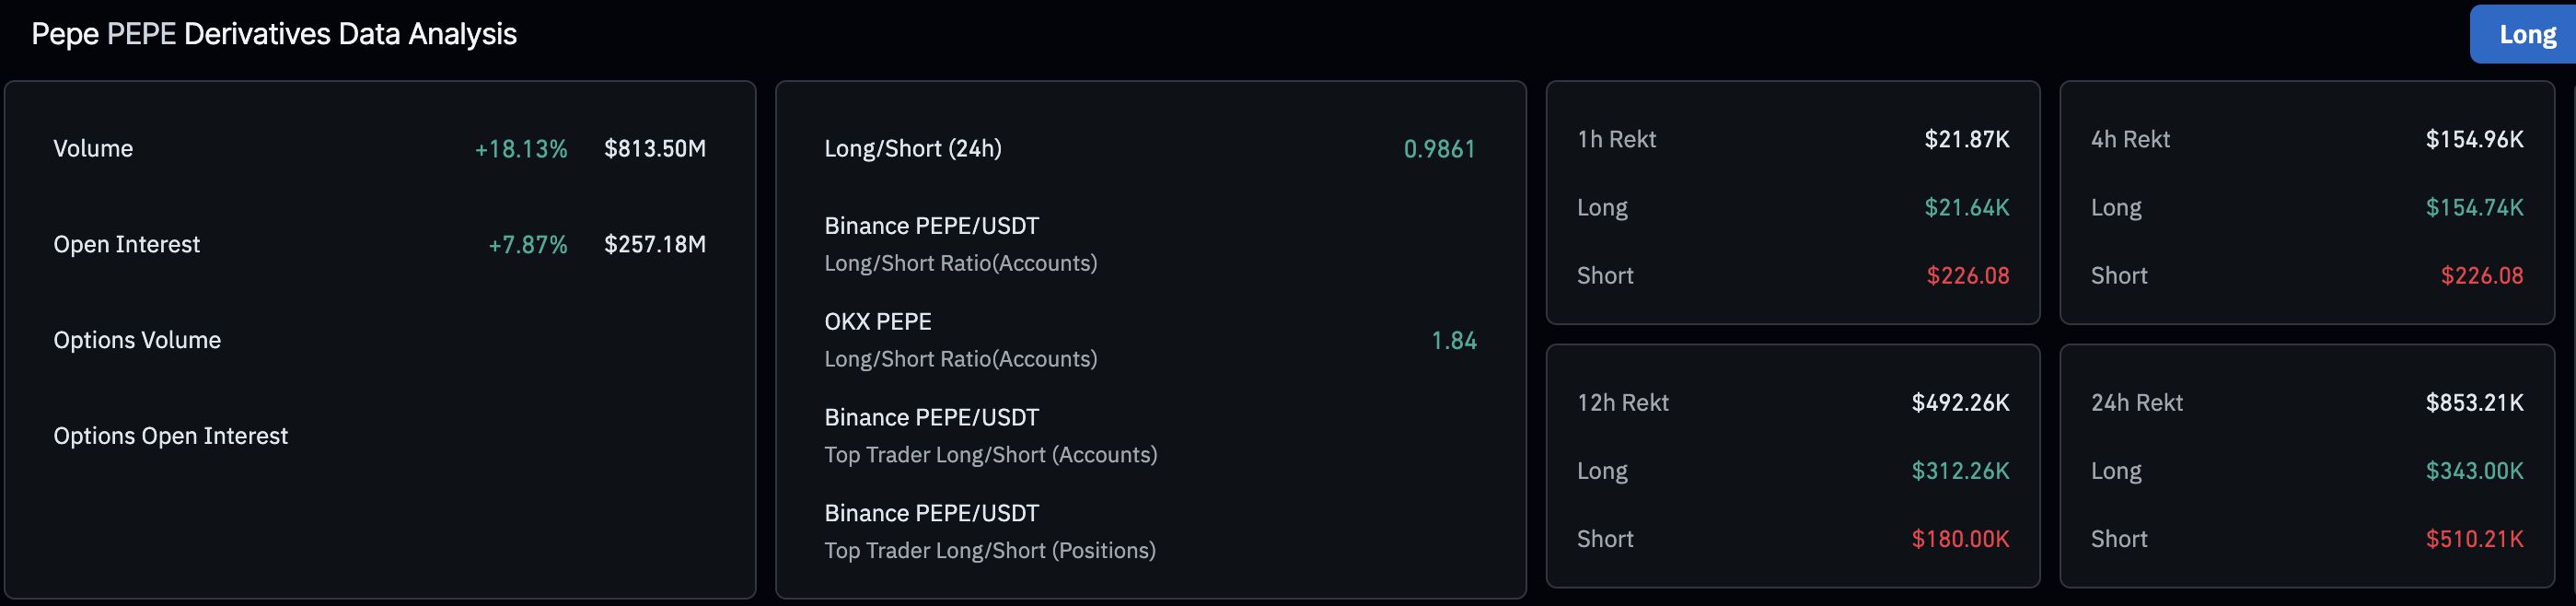
- A sudden surge in Pepe futures Open Interest points to increased investors’ confidence.
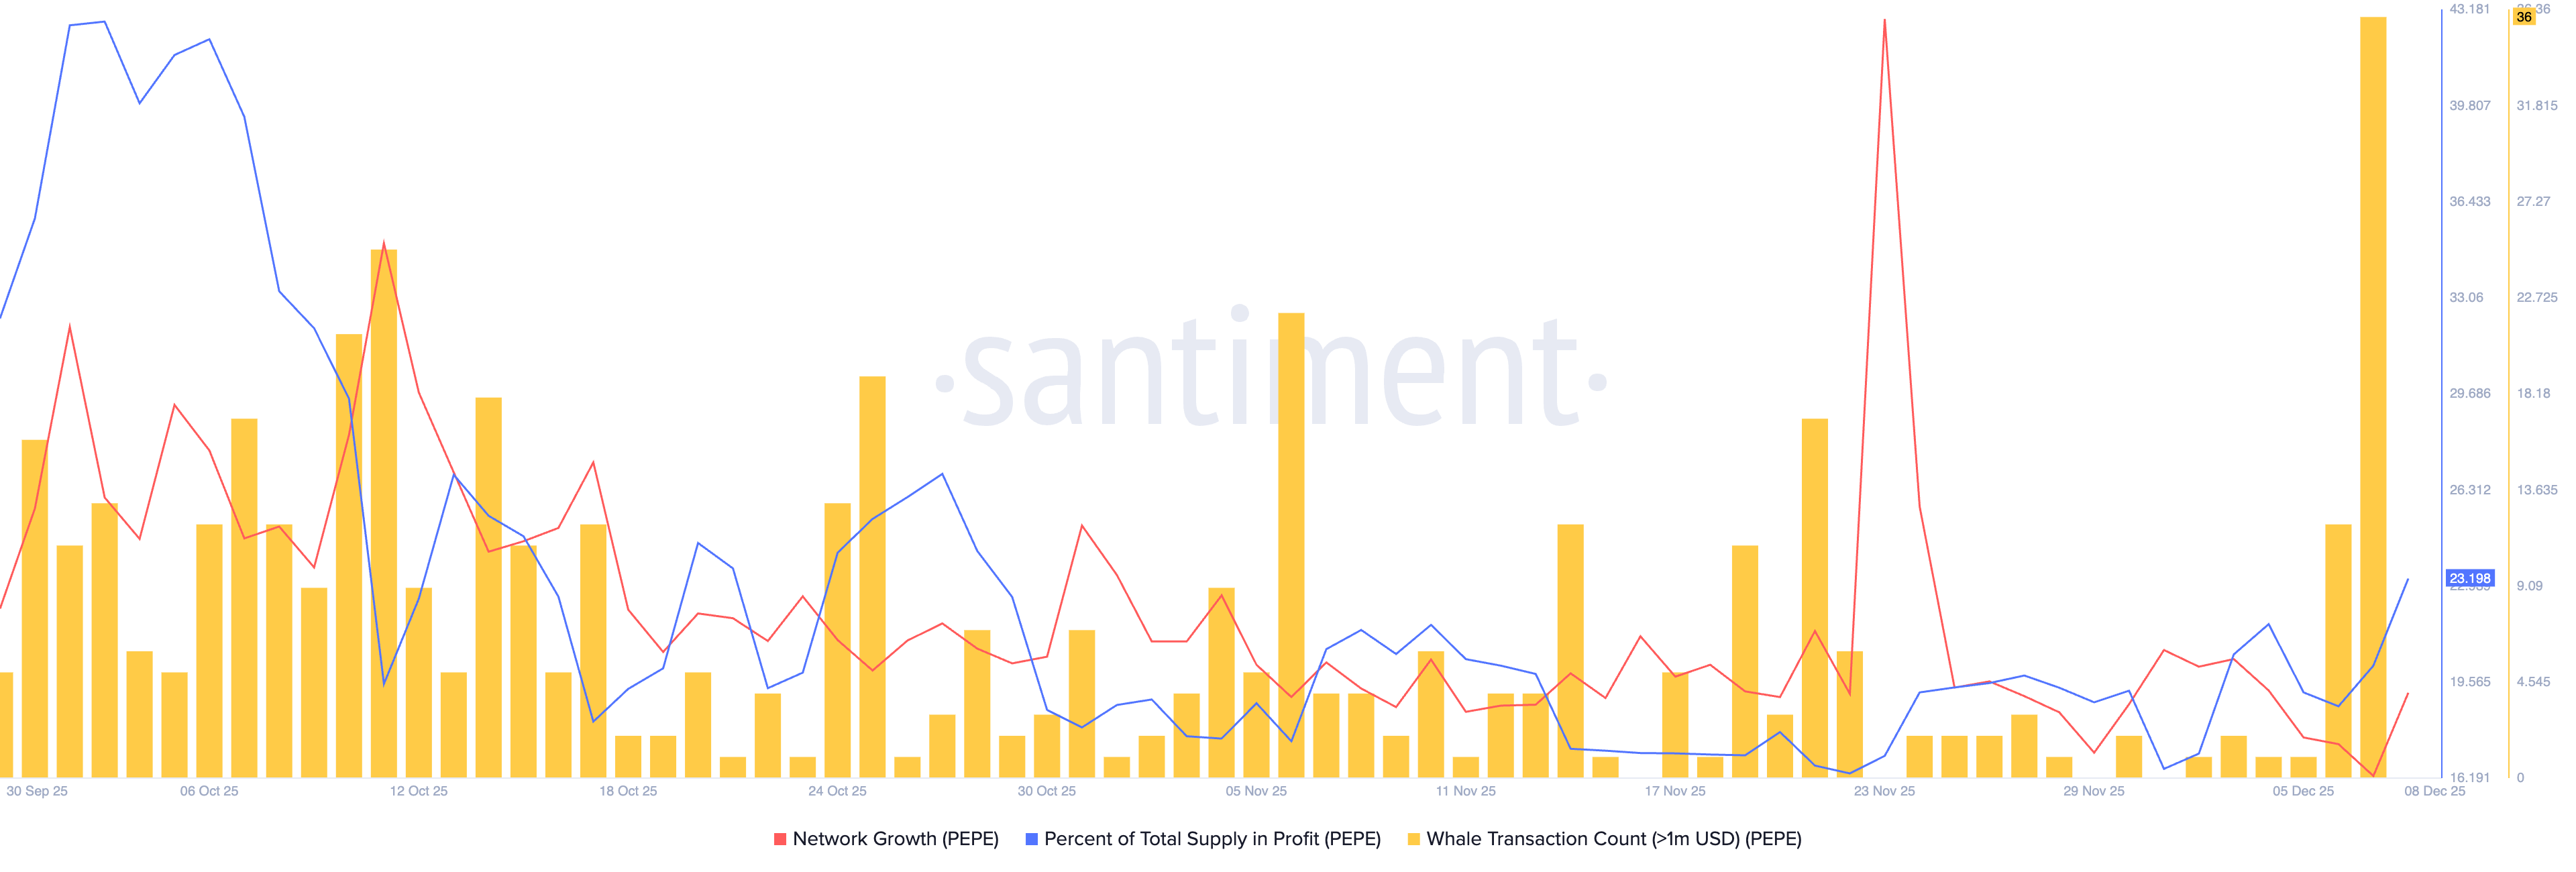
- On-chain data flashes bullish potential on rising network growth, supply in profit, and whale transactions.
Pepe (PEPE) trades in the red on Tuesday after failing to secure a daily close above the $0.00000500 psychological level on Monday. The technical outlook remains mixed as the meme coin consolidates. Still, the derivatives and on-chain data indicate a resurgence in retail interest that could boost the next rally in this frog-themed meme coin.
Derivatives and on-chain data flash bullish signals for PEPE
Pepe is regaining retail demand as derivatives traders are increasing risk exposure overnight. CoinGlass data shows a 7.87% surge in PEPE futures Open Interest (OI) in the last 24 hours, rising to $257.18 million. Generally, recovery runs in Pepe, and other meme coins are mainly driven by retail demand and speculation.
On the on-chain side, Santiment data shows a spike in network growth to 623 on Monday, up from 448 on Sunday, indicating a rise in the number of new addresses transferring PEPE for the first time. Meanwhile, the percentage of PEPE supply in profit stood at 23.20% on Monday, up from 20.14% on the previous day.
Large wallet investors, commonly referred to as whales, executed 36 transactions worth over $1 million on Sunday, signaling increased interest that fueled Monday’s 7% gains. As whales rekindle their interest in PEPE, the meme coin could regain lost levels.
Technical outlook: Could PEPE rally toward the 200-day EMA?
Pepe is trading below $0.000005000, down 3% by press time on Tuesday, potentially aiming for the $0.00000395 support level, which aligns with the November 21 low.
Still, the momentum indicators on the daily chart maintain a broadly neutral-to-bullish stance. The Relative Strength Index (RSI) at 45 is rising toward the midpoint from oversold territory, suggesting a decline in selling pressure.
Additionally, the Moving Average Convergence Divergence (MACD) remains steady near the zero line, with mainly green histogram bars, indicating bullish momentum.
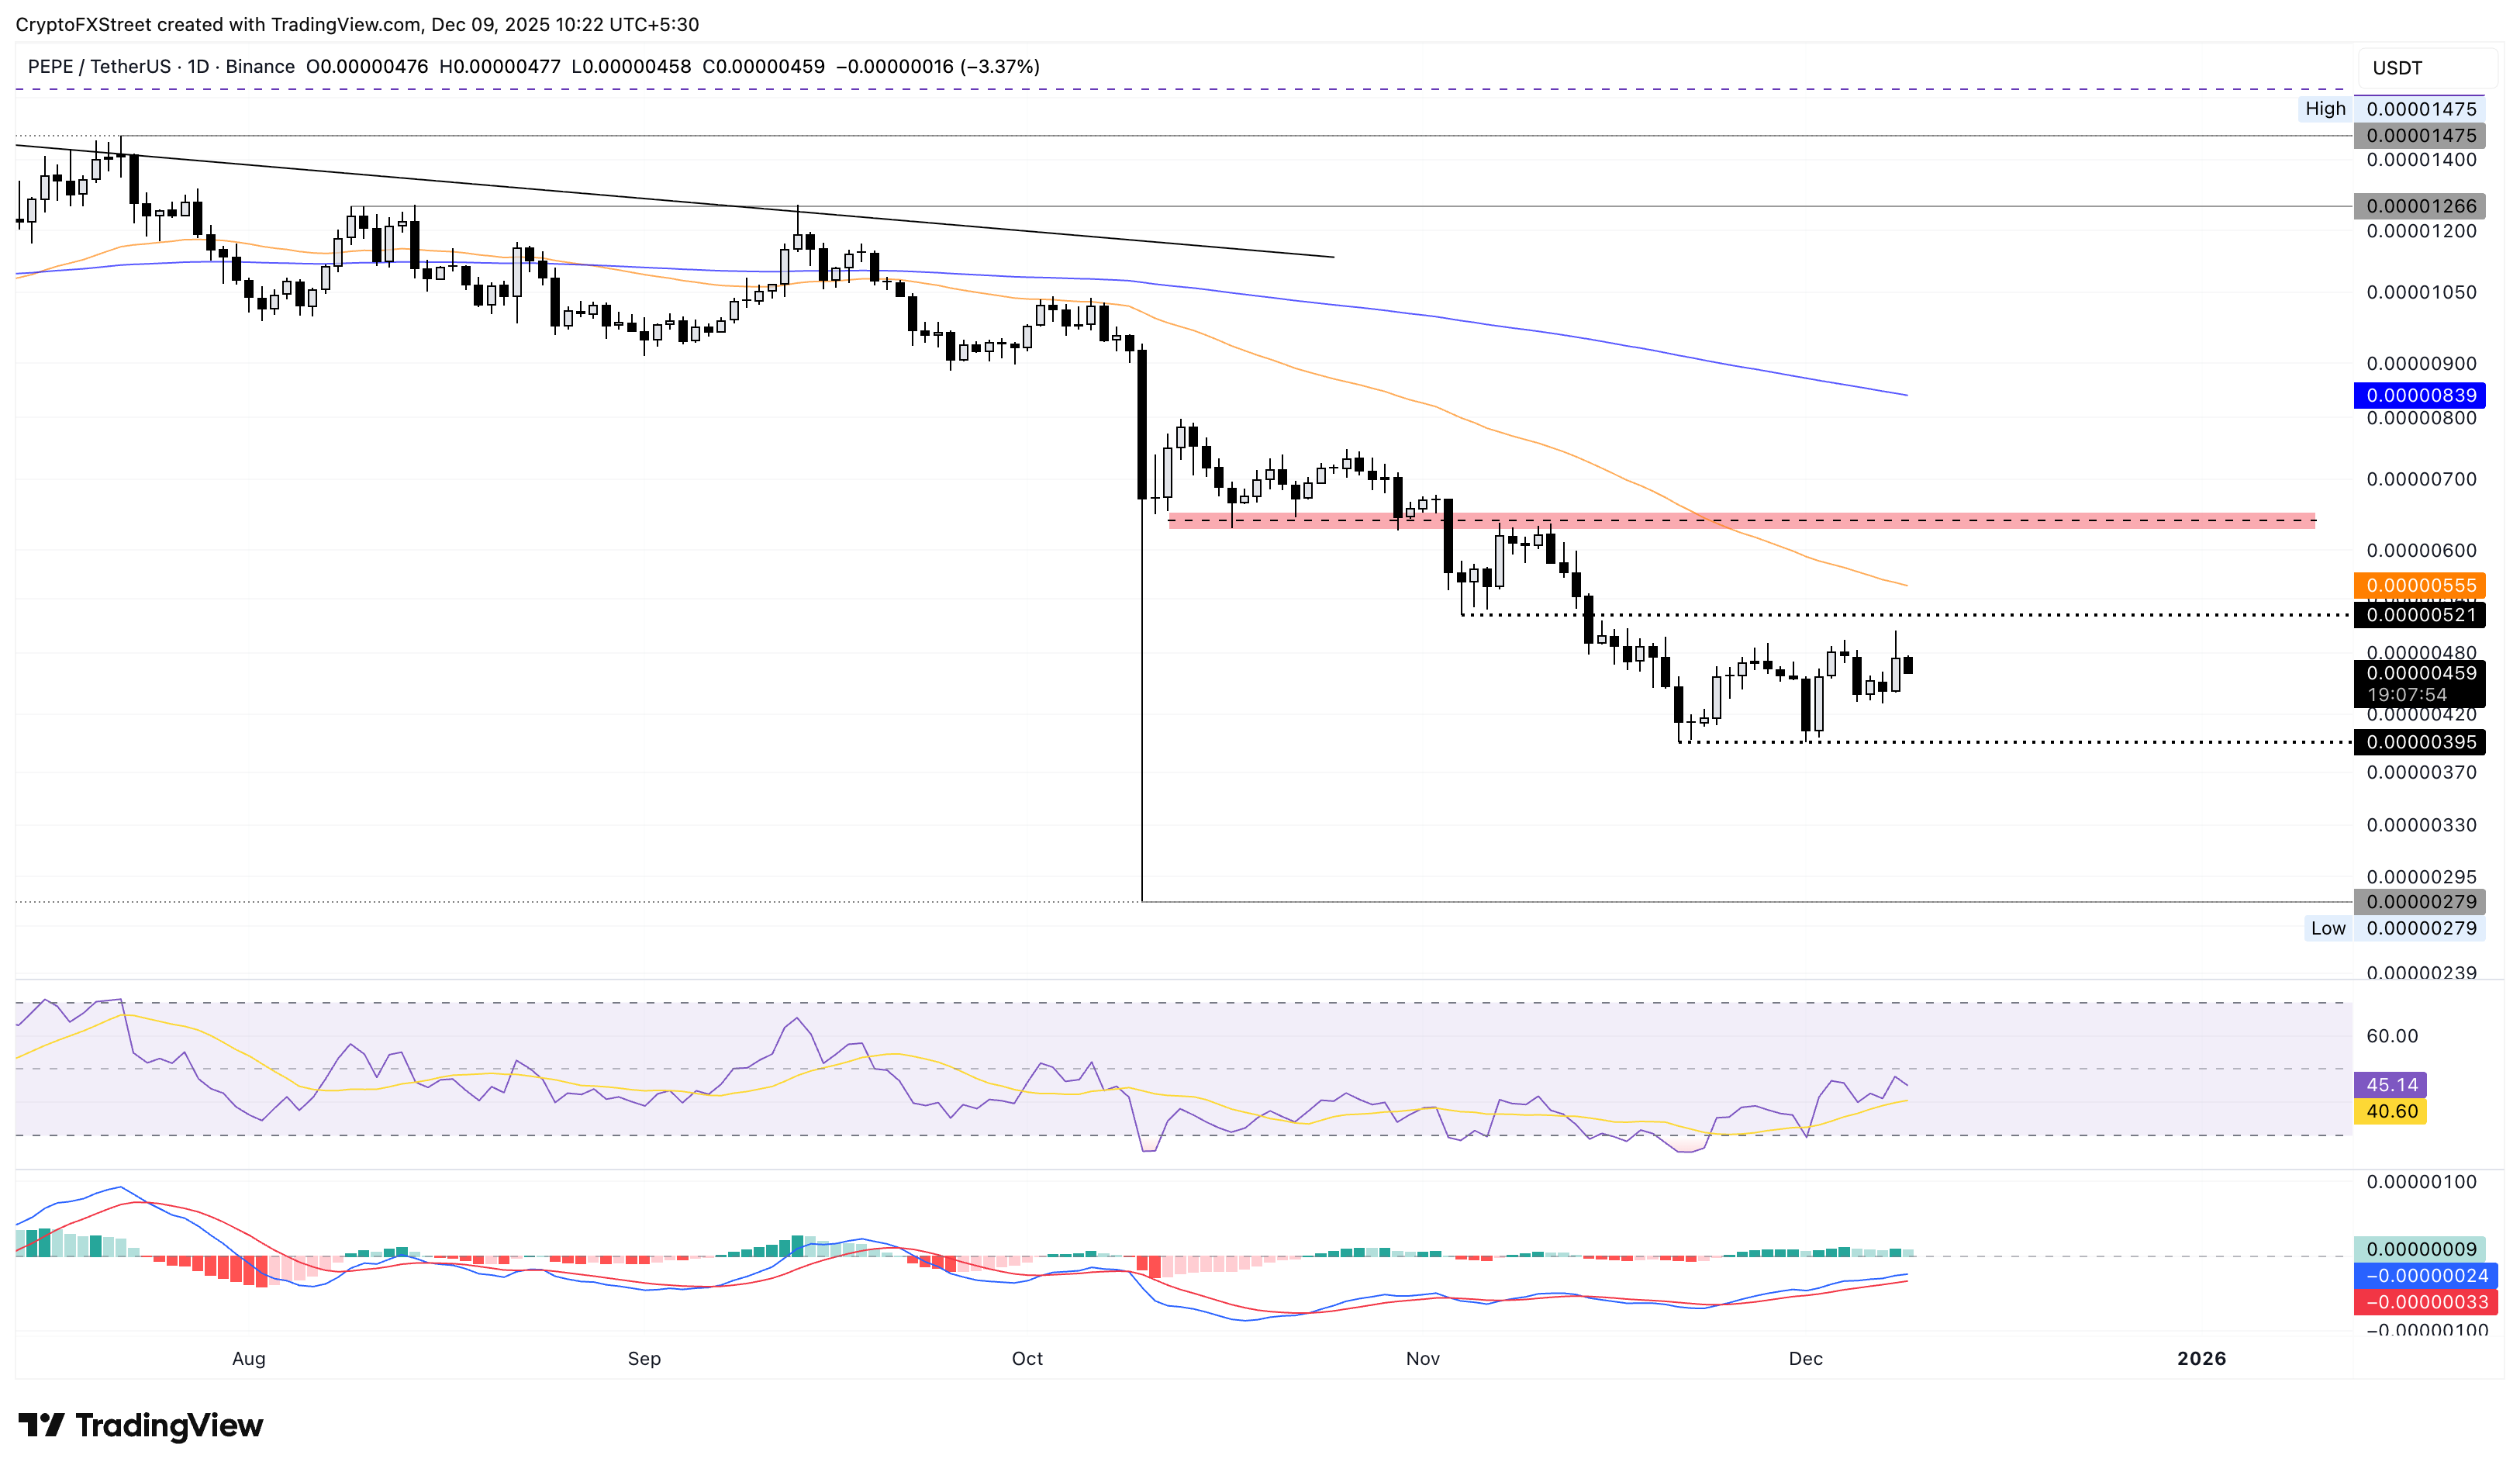
If PEPE secures a daily close above the $0.00000521 level marked by the November 4 low, it could aim for the supply present near $0.00000650, followed by the 200-day EMA at $0.00000839.

Mais de um milhão de usuários confiam na FXStreet para dados de mercado em tempo real, ferramentas de gráficos, insights de especialistas e notícias de Forex. Seu calendário econômico abrangente e webinars educacionais ajudam os traders a se manterem informados e tomarem decisões calculadas. A FXStreet conta com uma equipe de cerca de 60 profissionais, divididos entre a sede em Barcelona e diversas regiões globais.
Ler mais


