
Pi Network Price Forecast: PI flashes bullish signals as mainnet migration pauses, sentiment recovers
Por Vishal Dixit
Atualizado: 5 May 2026


ARTIGOS POPULARES

Pi Network (PI) hovers above $0.1800 at press time on Tuesday, holding steady after a 3% surge the previous day. Recovery in the broader market sentiment and the five-day delay in fresh supply migration to the mainnet ease downside pressure on the PI token price.
- Pi Network holds steady above $0.1800 on Tuesday, after roughly 3% gains on Monday.
- A five-day pause in the mainnet migration and a recovery in broader market sentiment ease downside pressure on the PI token.
- The technical outlook for the PI token is cautiously bullish as upside momentum recovers on the 4-hour timeline.
Pi Network (PI) hovers above $0.1800 at press time on Tuesday, holding steady after a 3% surge the previous day. Recovery in the broader market sentiment and the five-day delay in fresh supply migration to the mainnet ease downside pressure on the PI token price. The technical outlook for PI is mildly bullish, as trend momentum recovers on the 4-hour chart, suggesting an upside breakout is possible.
Fresh supply pressure eases on the Pi Network mainnet
Pi Network faces persistent downside pressure from supply unlocks during the Know-Your-Customer (KYC)-verified mainnet migration, which enables investors to transfer their PI token holdings to Centralized Exchanges (CEXs).
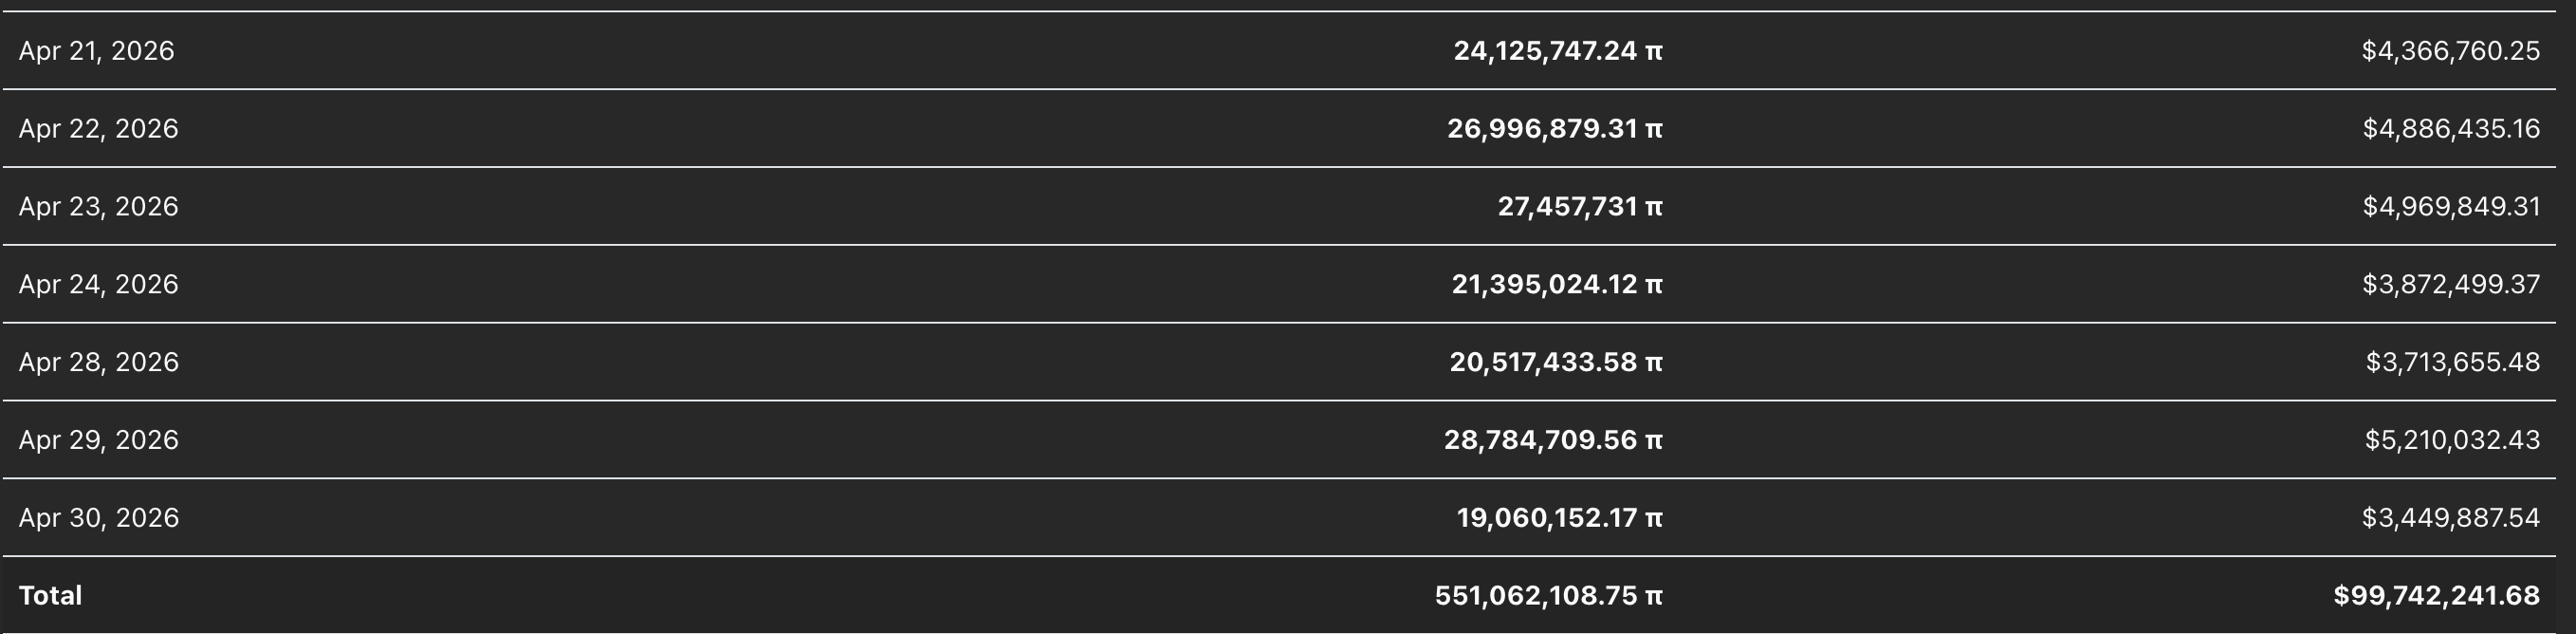
However, PiScan data shows a five-day delay in this migration, with the last inflow of 19.06 million PI tokens on Thursday. This slowdown in mainnet migration implies a loss of fresh supply inflow from testnet holders who might be eager to offload their holdings.
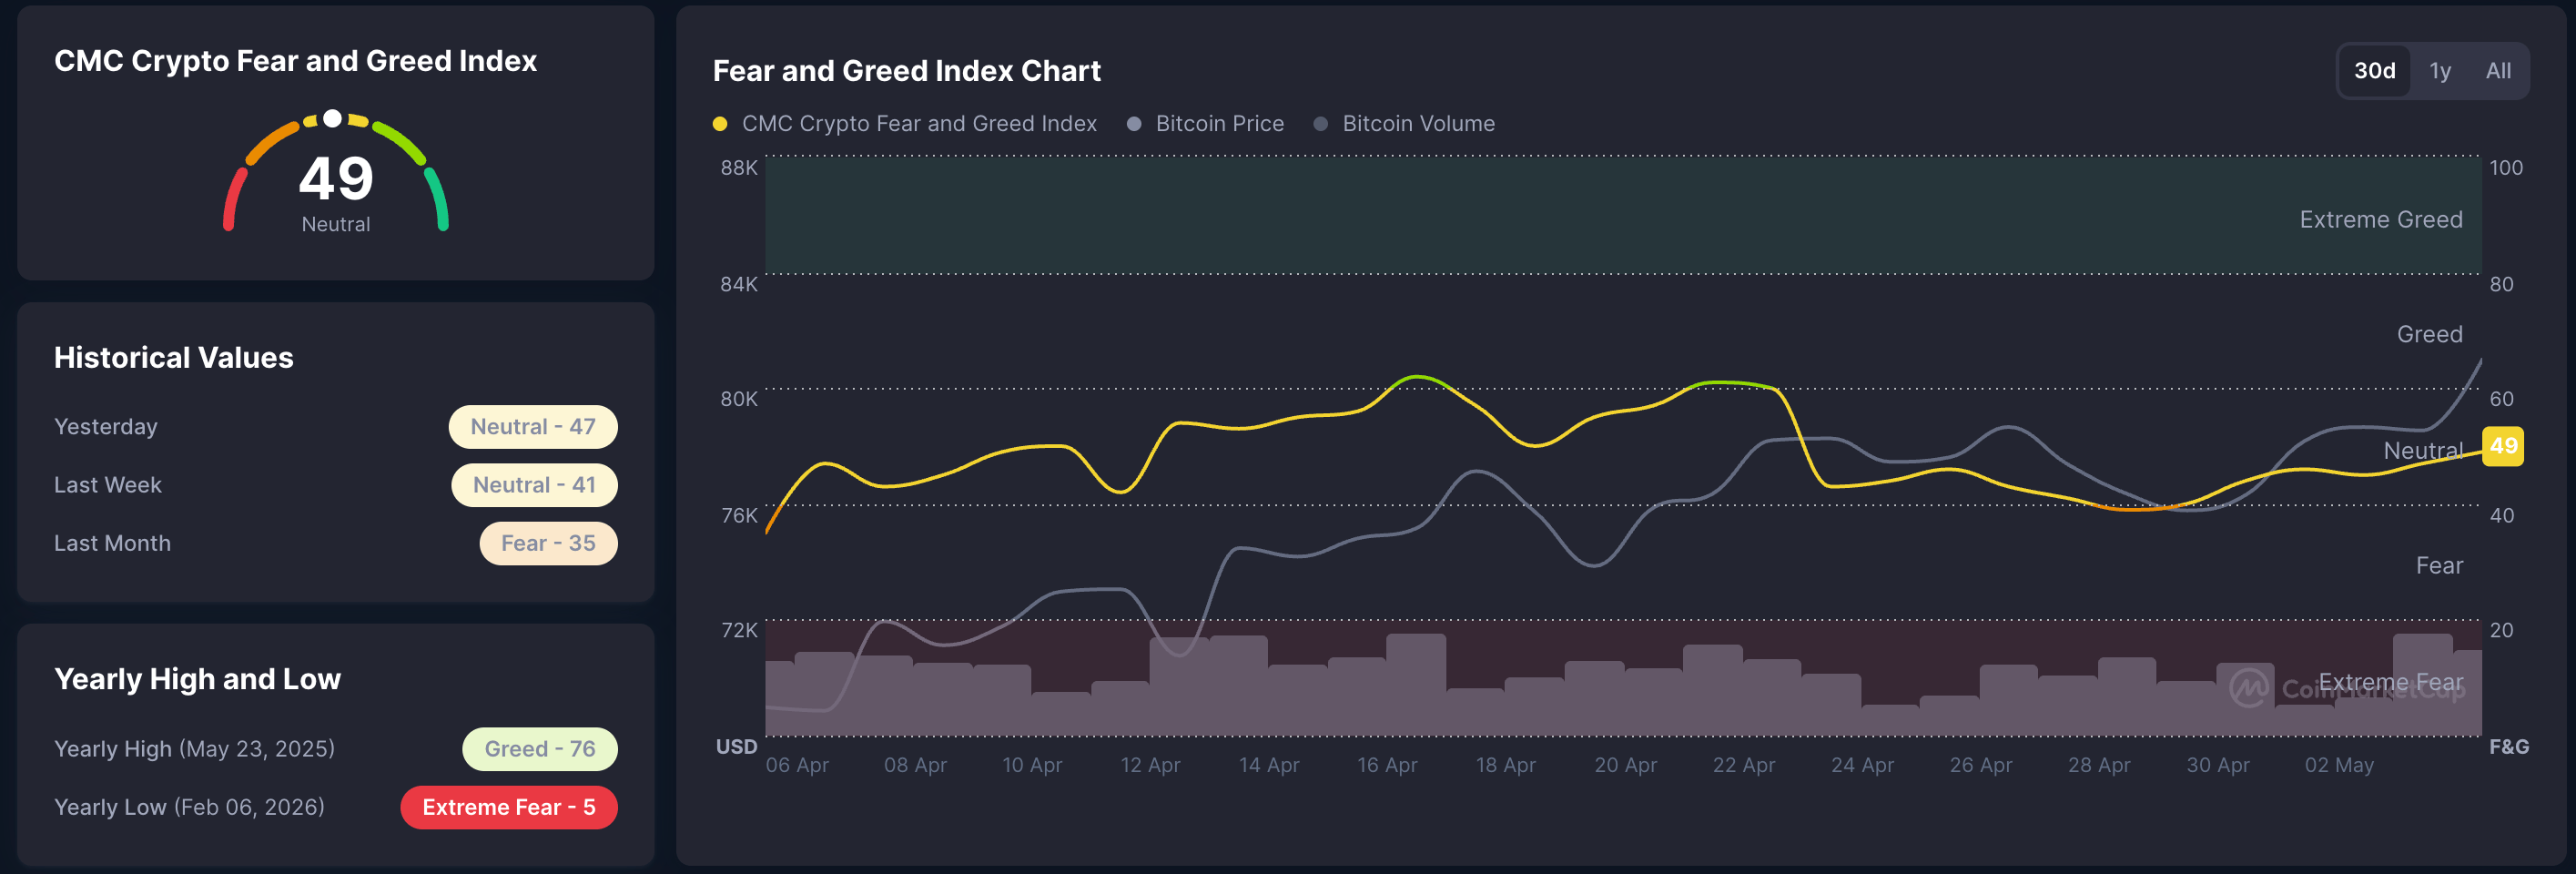
Meanwhile, the broader market sentiment is improving with Bitcoin holding above $80,000 on Tuesday. CoinMarketCap’s Fear and Greed Index stands at 49, up from 41 last week, which indicates a rise in risk-on sentiment. Typically, an increase in broader market risk appetite improves the upside potential for high-risk tokens such as Pi Network.
Technical outlook: Is Pi Network gearing up for a rebound?
Pi Network trades around $0.1812, holding a constructive near-term bullish bias as price stays above both the 50-period Exponential Moving Average (EMA) on the 4-hour chart at $0.1789 and the 200-period EMA at $0.1772.
The rebounds from close to $0.1750, suggests underlying dip-buying interest, but remain capped by the overhead resistance zone between $0.1821-$0.1827. A decisive close above this zone could target the $0.2000 round figure, surpassing the $0.1970 close from April 29.
The Relative Strength Index (RSI) at 55 on the 4-hour chart is rising above the midline, while the Moving Average Convergence Divergence (MACD) line extends higher after crossing above its signal line, hinting at moderate bullish momentum.
On the downside, initial support is reinforced by the 50-EMA at $0.1790, with a deeper floor emerging at the 200-EMA near $0.1772 if sellers attempt a corrective pullback.
(The technical analysis of this story was written with the help of an AI tool.)

Mais de um milhão de usuários confiam na FXStreet para dados de mercado em tempo real, ferramentas de gráficos, insights de especialistas e notícias de Forex. Seu calendário econômico abrangente e webinars educacionais ajudam os traders a se manterem informados e tomarem decisões calculadas. A FXStreet conta com uma equipe de cerca de 60 profissionais, divididos entre a sede em Barcelona e diversas regiões globais.
Ler mais


