
Pi Network Price Forecast: PI hits record low as risk appetite weakens
Por Vishal Dixit
Atualizado: 30 Jun 2026


ARTIGOS POPULARES

Pi Network (PI) remains under intense selling pressure on Tuesday, extending losses after hitting a record low of $0.1120 the previous day. The Pi2Day celebrations on Sunday failed to lift retail demand as the Open Interest continues to decline, indicating reduced risk appetite.
- Pi Network extends losses on Tuesday for the third consecutive day after hitting a record low of $0.1120 the previous day.
- Data shows a declining trend in PI token Open Interest as investors' risk appetite wanes.
- The technical outlook for PI remains bearish, with a risk of a steeper downside spiral.
Pi Network (PI) remains under intense selling pressure on Tuesday, extending losses after hitting a record low of $0.1120 the previous day. The Pi2Day celebrations on Sunday failed to lift retail demand as the Open Interest continues to decline, indicating reduced risk appetite. PI should hold above $0.1120 to avoid a steeper correction that could threaten the $0.1000 psychological level.
Buyer conviction fades for PI
Investors are losing confidence in the PI token amid a broader market downturn. Heavy risk-off sentiment weighs on speculative altcoins like Pi Network, which often require a catalyst or community demand to fuel an upcycle.
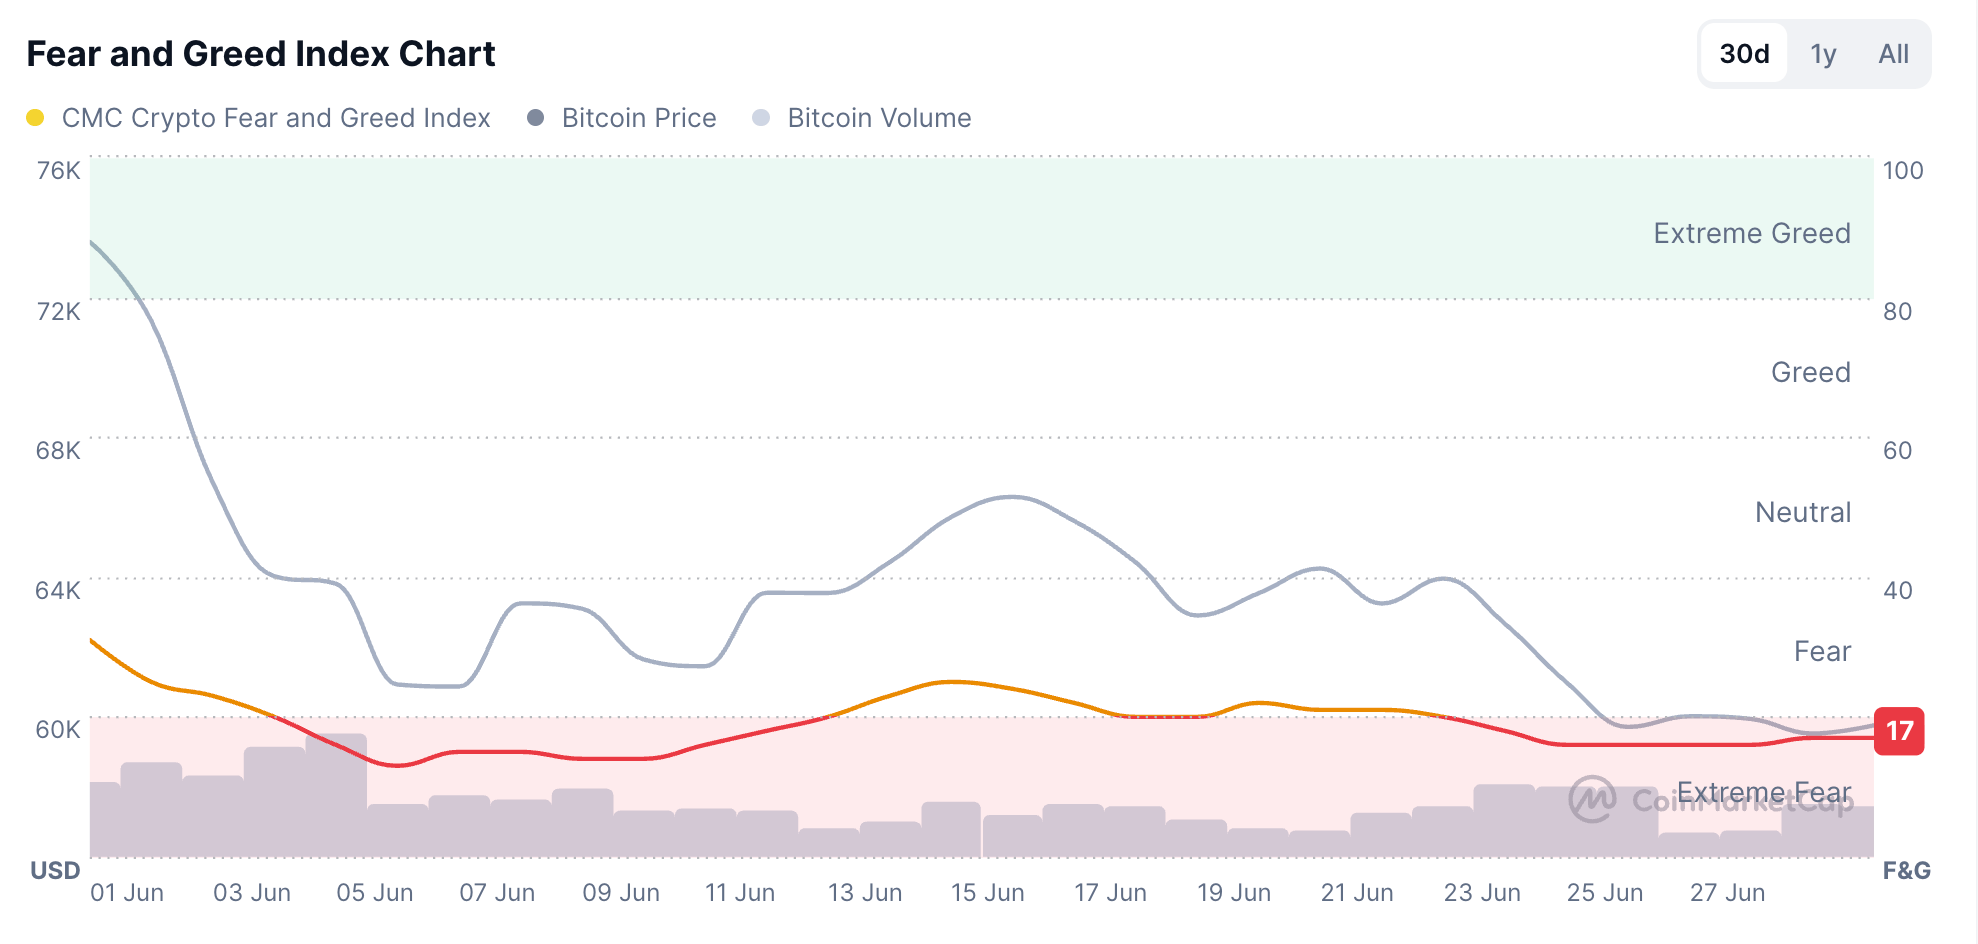
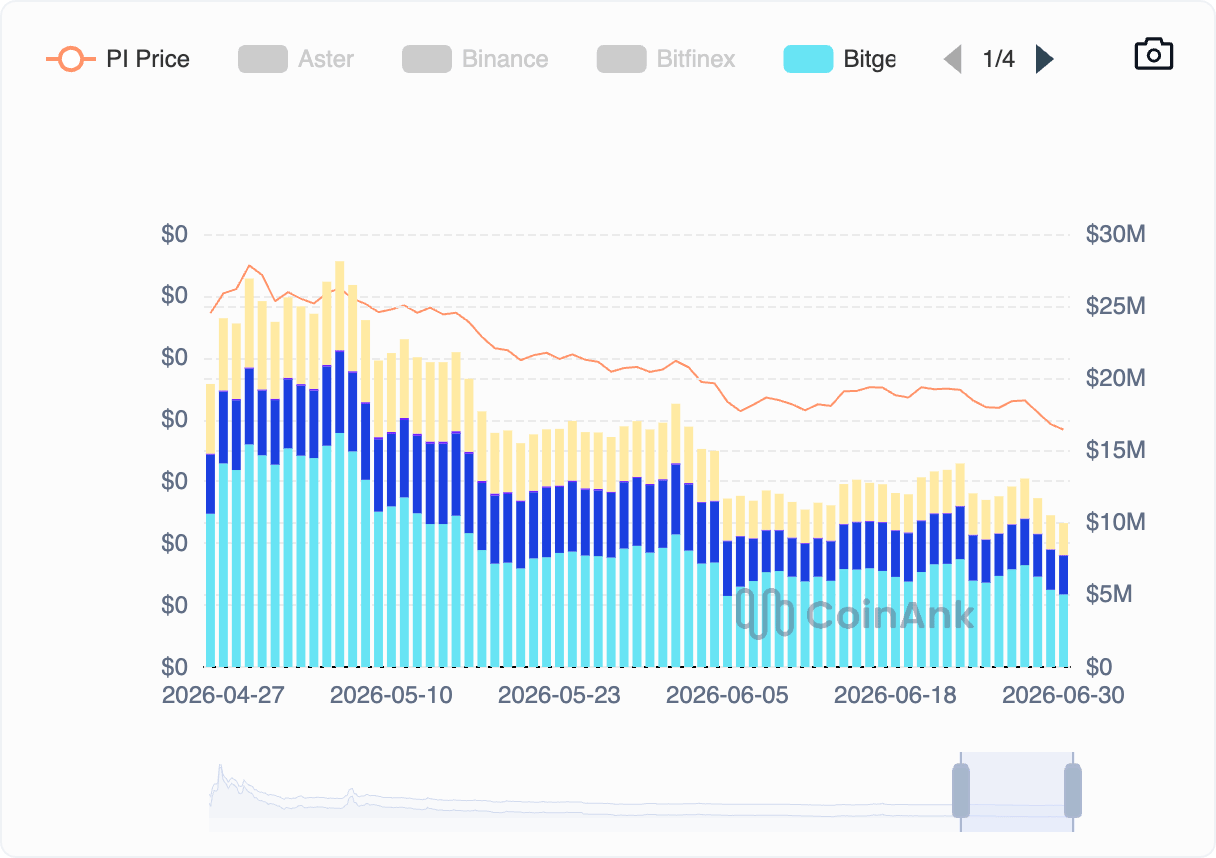
The Crypto Fear and Greed Index at 17 reflects steady risk-averse behavior among investors, while CoinAnk data shows a declining trend in PI Open Interest (OI), which crossed below $10 million on Tuesday. For a sustained recovery in PI, broader market risk-on sentiment and a community-linked catalyst, such as a listing on a top-tier exchange, emerge as the need of the hour.
Technical outlook: How low will PI token price go?
Pi Network is trading below $0.1200 at press time on Tuesday, extending losses for the third consecutive day. The steady three-day decline in PI reached a fresh record low of $0.1120 on Monday, breaking below the $0.1184 low set on June 6.
Momentum on the daily timeframe supports the bearish outlook. The Moving Average Convergence Divergence (MACD) has crossed below the signal line, starting a fresh negative histogram. Meanwhile, the Relative Strength Index (RSI) at 28 slips back into the oversold zone with a downtick, indicating persistent downside pressure.
From a technical perspective, the PI token remains in a clear bearish spiral and is testing the S2 Pivot Point at $0.1124. If PI slips below this level, it could extend its decline toward the $0.1000 psychological level, followed by the S3 Pivot Point at $0.0836.
(The technical analysis of this story was written with the help of an AI tool.)

Mais de um milhão de usuários confiam na FXStreet para dados de mercado em tempo real, ferramentas de gráficos, insights de especialistas e notícias de Forex. Seu calendário econômico abrangente e webinars educacionais ajudam os traders a se manterem informados e tomarem decisões calculadas. A FXStreet conta com uma equipe de cerca de 60 profissionais, divididos entre a sede em Barcelona e diversas regiões globais.
Ler mais


