

Pi Network Price Forecast: Retail interest wanes as downside breakout looms
- Pi Network edges below $0.1500 on Tuesday for the third consecutive day.
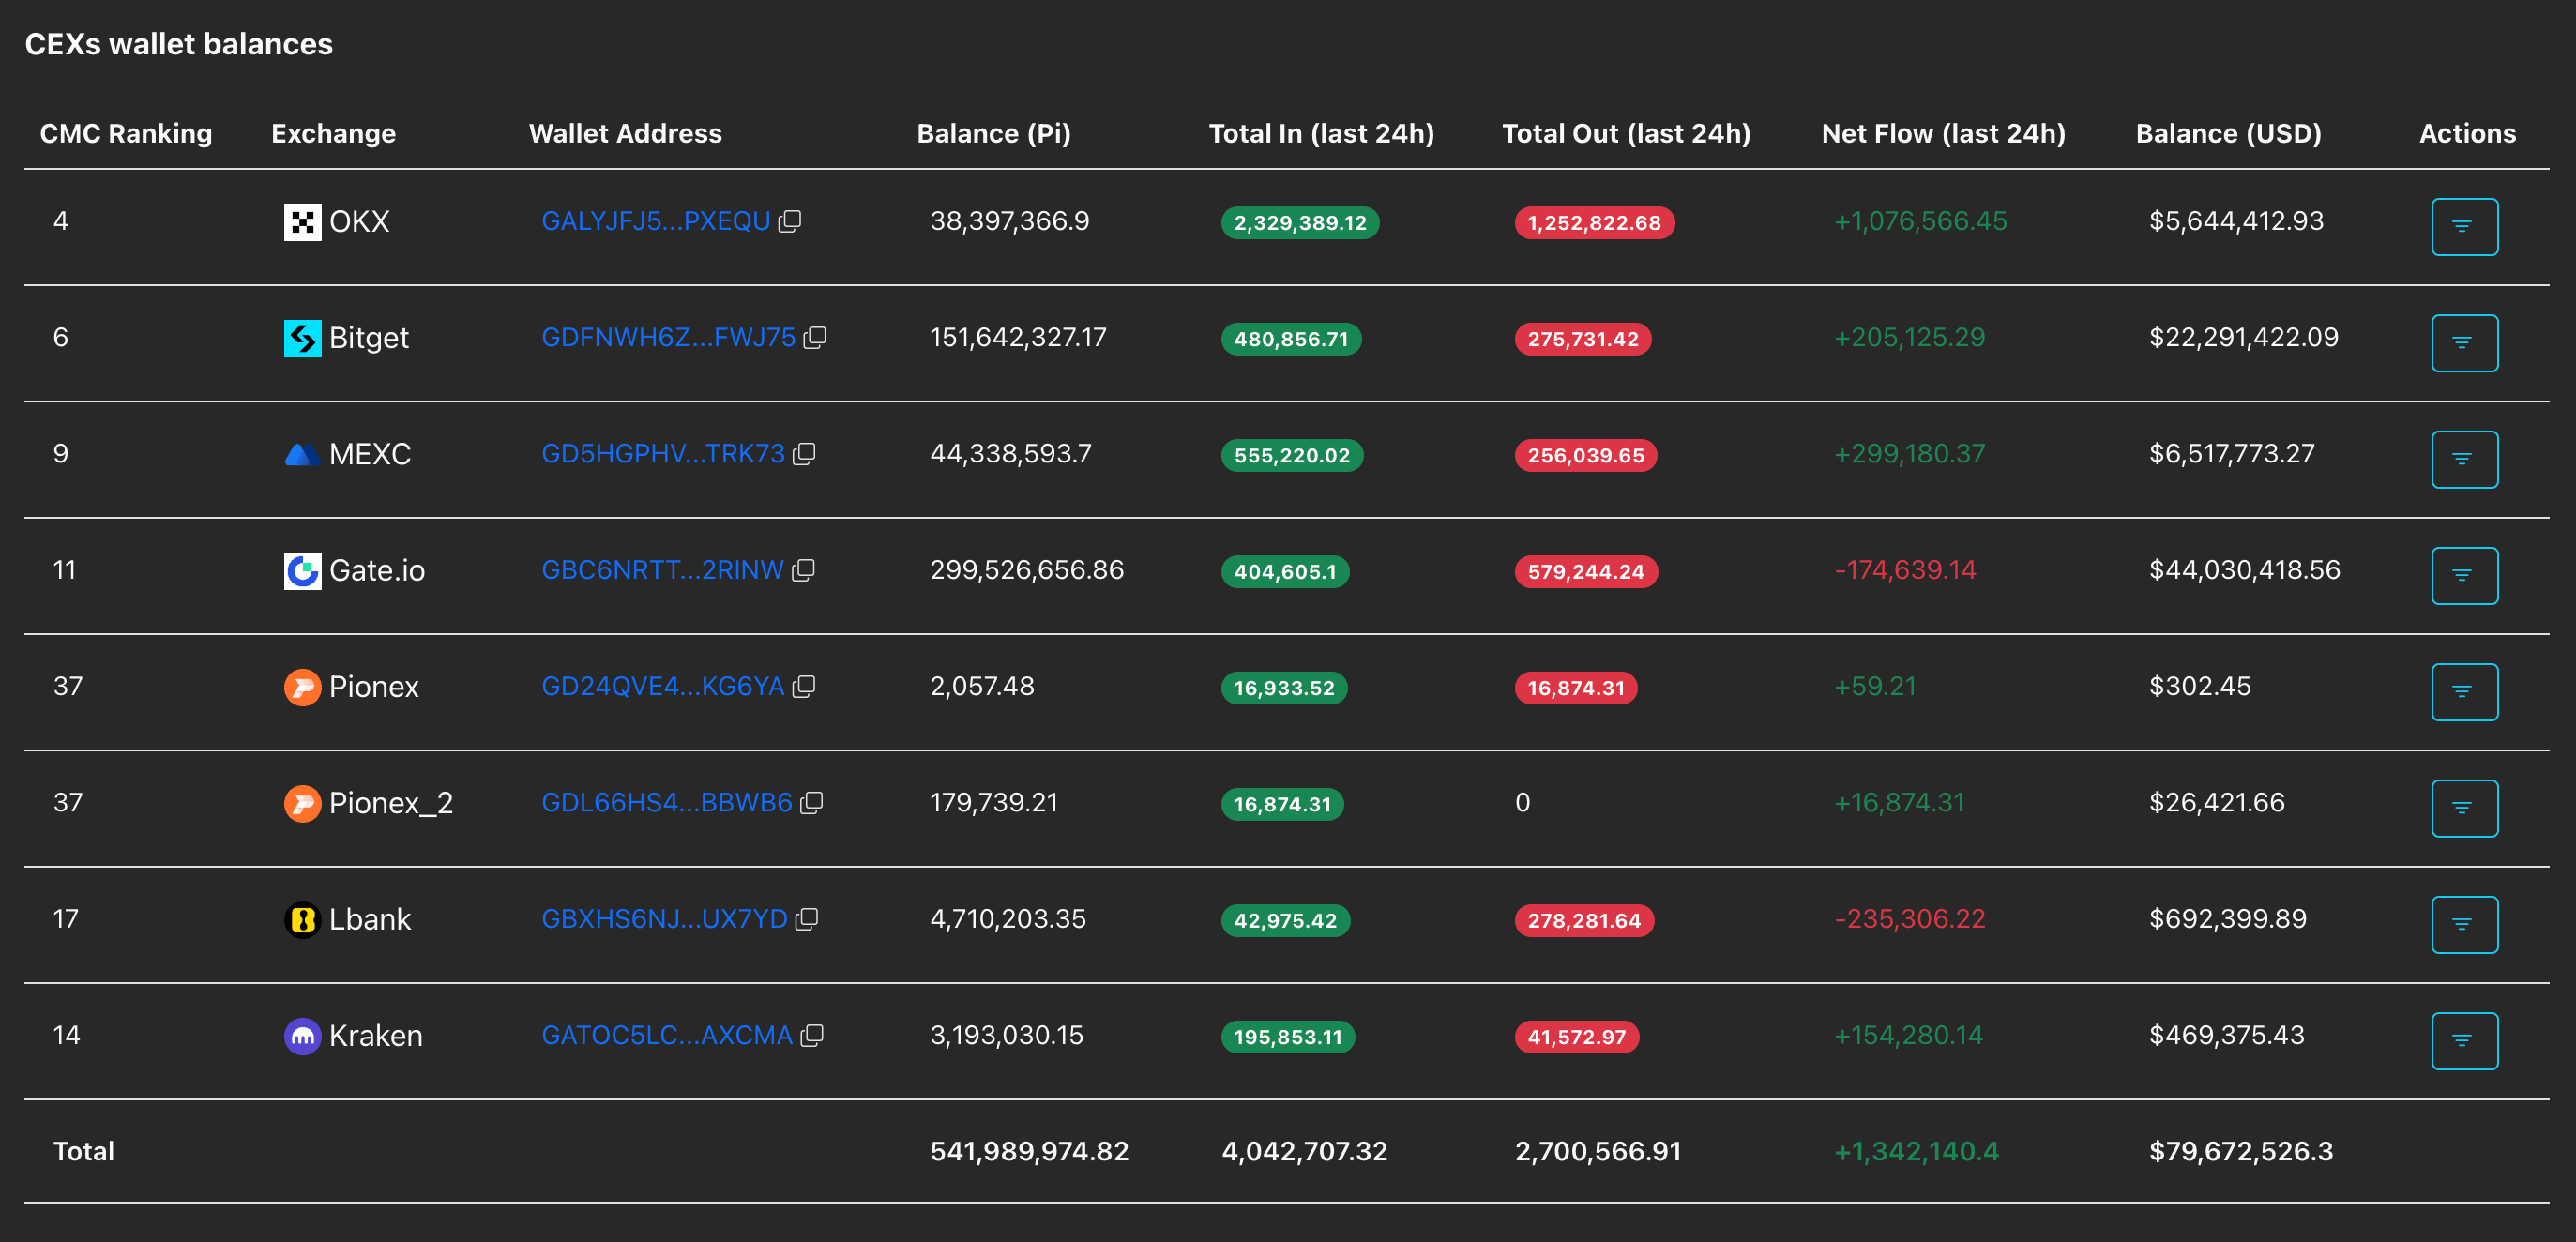
- Declining social interest and over 1.30 million PI deposits on CEXs suggest waning investor demand.
- The technical outlook for PI is bearish, with a risk of a downside breakout from the consolidation range.
Pi Network (PI) is under intense selling pressure, crossing below $0.15000 at press time on Tuesday. Data show declining social interest in the Pi Network, while Centralized Exchanges (CEXs) recorded inflows of over 1.30 million PI tokens in the last 24 hours, suggesting a drop in investors' confidence. Technically, Pi Network risks a steeper correction if it breaks out of the short-term consolidation range on the downside.

Retail interest in Pi Network wanes
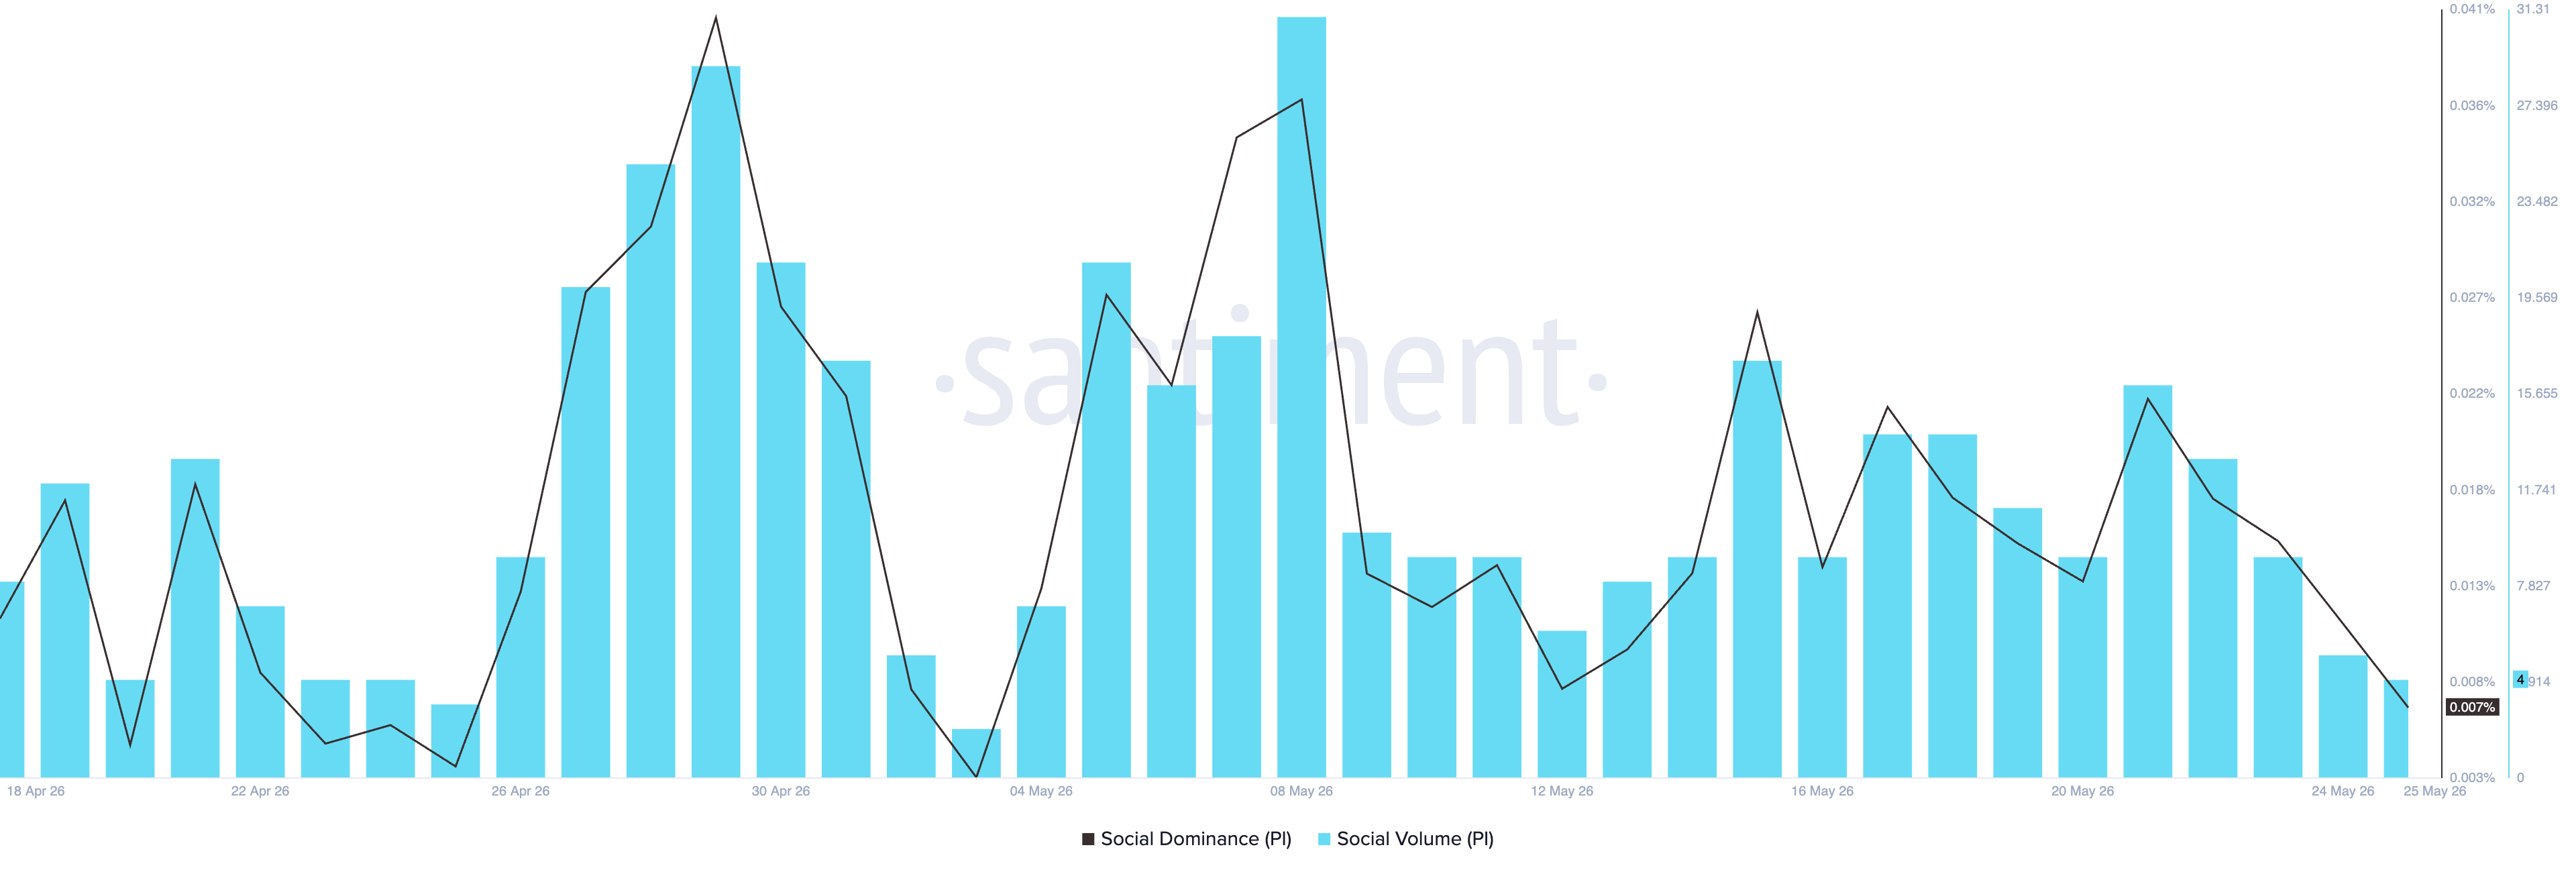
Pi Network is failing to retain investors' interest as the broader cryptocurrency market chases narratives around AI, privacy, and tokenized Real World Assets (RWAs). Santiment data shows the social dominance of Pi Network dropped to 0.007% on Monday, down from 0.022% on Thursday, suggesting reduced speculation around PI, which generally fuels its upticks.
On the other hand, a surge in CEXs inflows reaffirms that investors are trimming their PI holdings. PiScan data show over 1.34 million PI tokens have been deposited on exchanges, suggesting a sell-off.
Technical outlook: Will Pi Network jump off the bearish cliff?
Pi Network holds a bearish near-term bias after three consecutive days of losses. The short-term decline threatens a downside breakout from the consolidation range between the May 18 low of $0.1463 and the high of $0.1550.
The mobile mining cryptocurrency also extends beneath the 50-, 100-, and 200-period Exponential Moving Averages (EMAs) on the 4-hour chart, suggesting that rallies remain corrective within a broader downside structure.
The Relative Strength Index (RSI) at 34 on the same chart drops closer to the oversold zone while the Moving Average Convergence Divergence (MACD) slips marginally below its signal line, hinting that bearish pressure is present but not yet capitulative.
A decisive close below the $0.1463 support could test the S1 and S2 Pivot Points at $0.1449 and $0.1410, respectively.
A potential rebound would face initial resistance at the 50-period EMA at $0.1528, which now acts as the first cap to any recovery attempts. A sustained move above this level would then target the R1 Pivot Point at $0.1541, near the consolidation ceiling at $0.1550.
(The technical analysis of this story was written with the help of an AI tool.)














