
Silver Price Analysis: Recovery stalls at 100-day SMA, sellers eye $75
Por Christian Borjon Valencia
Atualizado: 13 Apr 2026


ARTIGOS POPULARES

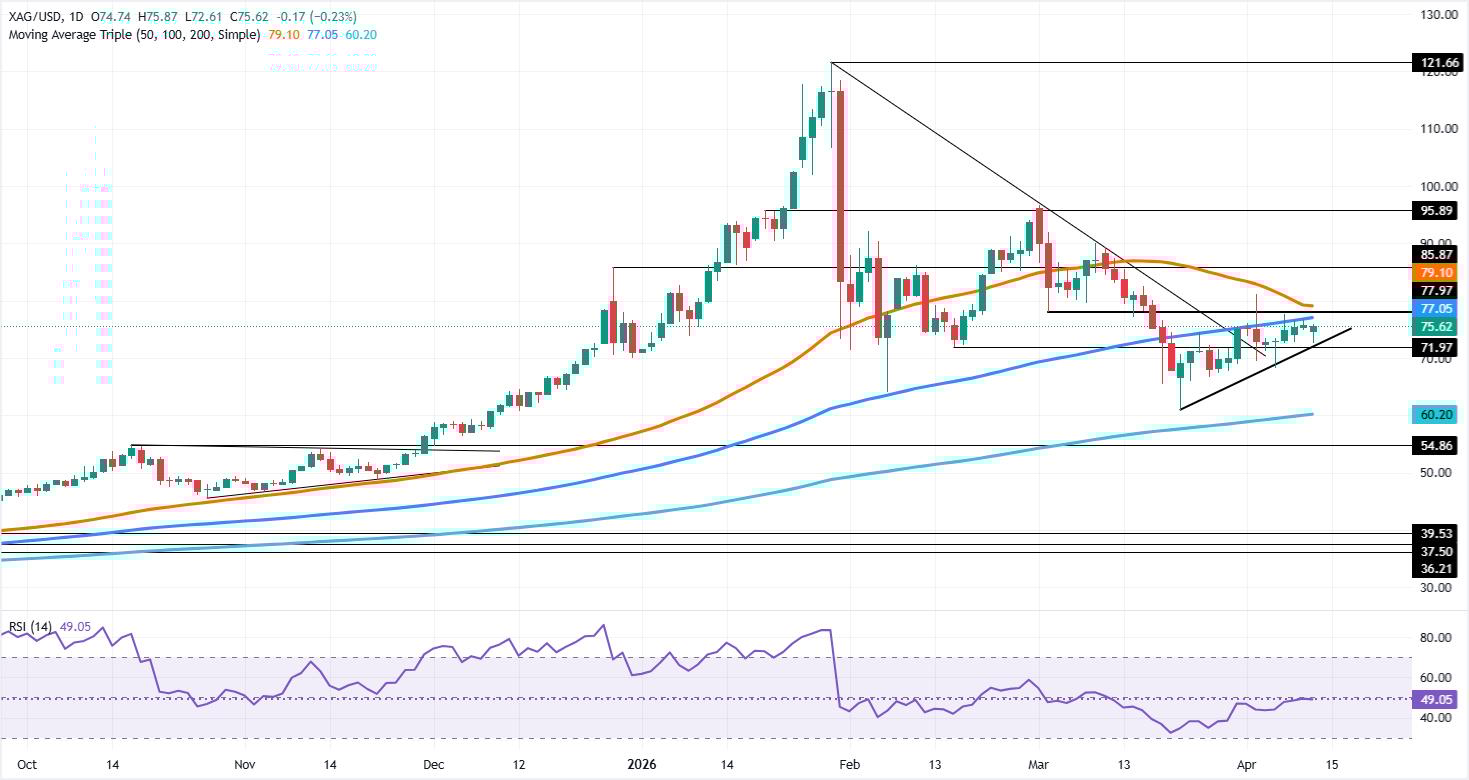
Silver (XAG/USD) recovers some ground on Monday yet is poised to finish the day with losses of 0.33% after gapping down over the weekend due to news painting a gloomy outlook for the US-Iran conflict. At the time of writing, XAG/USD trades at $75.58 after bouncing off daily lows of $72.61.
- Silver rebounds from $72.61 but remains capped below 100-day SMA.
- RSI hovers near neutral, indicating lack of clear directional bias.
- Break above $76.09 or below $73.28 sets next trend direction.
Silver (XAG/USD) recovers some ground on Monday yet is poised to finish the day with losses of 0.33% after gapping down over the weekend due to news painting a gloomy outlook for the US-Iran conflict. At the time of writing, XAG/USD trades at $75.58 after bouncing off daily lows of $72.61.
XAG/USD Price Forecast: Technical Outlook
The technical picture shows Silver remains capped on the upside by the 100-day Simple Moving Average (SMA) at 76.09 and on the downside by the 20-day SMA at 73.28. Price action shows mixed signals, but reaching a four-day low of $72.61 could open the door to lower prices, even though XAG/USD is ending the day past $75.50.
The Relative Strength Index (RSI) shows the white metal is moving sideways around the neutral level, waiting for a fresh catalyst. This could be the release of the US Producer Price Index (PPI) figures on Tuesday.
If XAG/USD surpassed the 100-day SMA, the next stop would be the March 3 low turned resistance at $77.98, ahead of the 50-day SMA at $79.21. Conversely, if Silver slumps below the 20-day SMA at $73.28, sellers could push prices towards the April 2 daily low of $69.58, before aiming towards the next area of interest at $60.95, the March 23 cycle low.
XAG/USD Price Chart – Daily
Silver FAQs
Silver is a precious metal highly traded among investors. It has been historically used as a store of value and a medium of exchange. Although less popular than Gold, traders may turn to Silver to diversify their investment portfolio, for its intrinsic value or as a potential hedge during high-inflation periods. Investors can buy physical Silver, in coins or in bars, or trade it through vehicles such as Exchange Traded Funds, which track its price on international markets.
Silver prices can move due to a wide range of factors. Geopolitical instability or fears of a deep recession can make Silver price escalate due to its safe-haven status, although to a lesser extent than Gold's. As a yieldless asset, Silver tends to rise with lower interest rates. Its moves also depend on how the US Dollar (USD) behaves as the asset is priced in dollars (XAG/USD). A strong Dollar tends to keep the price of Silver at bay, whereas a weaker Dollar is likely to propel prices up. Other factors such as investment demand, mining supply – Silver is much more abundant than Gold – and recycling rates can also affect prices.
Silver is widely used in industry, particularly in sectors such as electronics or solar energy, as it has one of the highest electric conductivity of all metals – more than Copper and Gold. A surge in demand can increase prices, while a decline tends to lower them. Dynamics in the US, Chinese and Indian economies can also contribute to price swings: for the US and particularly China, their big industrial sectors use Silver in various processes; in India, consumers’ demand for the precious metal for jewellery also plays a key role in setting prices.
Silver prices tend to follow Gold's moves. When Gold prices rise, Silver typically follows suit, as their status as safe-haven assets is similar. The Gold/Silver ratio, which shows the number of ounces of Silver needed to equal the value of one ounce of Gold, may help to determine the relative valuation between both metals. Some investors may consider a high ratio as an indicator that Silver is undervalued, or Gold is overvalued. On the contrary, a low ratio might suggest that Gold is undervalued relative to Silver.

Mais de um milhão de usuários confiam na FXStreet para dados de mercado em tempo real, ferramentas de gráficos, insights de especialistas e notícias de Forex. Seu calendário econômico abrangente e webinars educacionais ajudam os traders a se manterem informados e tomarem decisões calculadas. A FXStreet conta com uma equipe de cerca de 60 profissionais, divididos entre a sede em Barcelona e diversas regiões globais.
Ler mais


